Canada
CA10Y | Rate Cuts Ahead for Canada. Watch the Banks!Back in November (2018) the yield on the 10 year Canadian treasury hit the upper boundary historical trendline and reversed sharply after briefly overshooting. Fundamentally, interest rates follow GDP figures so we can use these technicals to give us a bit of a prognoses for the financial and economic wellbeing of the country... and its not looking good.
Today the central bank confirmed the fears so expect Canadian rates to drop across the board (but I expect spreads to rise between safe paper and junk). It will be interesting to watch what happens to bank stocks over the next 12-18 months as the economy slows down. Will we see a credit crunch? How will this impact the Loonie versus the US dollar?
I am expecting trouble for Canadian banks as they are now dealing with a red hot housing market, the rout in commodities, and now, rising consumer delinquencies. Most importantly, bank capital (equity) will likely get squeezed, which will put tension on bank balance sheets and their eagerness to extend credit. A policy for negative interest rates is already primed and ready in the Bank of Canada's toolbox. But luckily Canada doesn't have "reserve requirements" for banks ;)
***This is not investment advice and is simply an educational analysis of the market and/or pair. By reading this post you acknowledge that you will use the information here at YOUR OWN RISK
USDCAD Looking for 200 Moving AverageUSDCAD looking for 200 moving average? I think so. A risky one, but it could be nice!
Sidenote: "Top-notch entries are exclusive to members of Cream Live Trading"
Learn how to beat the market as Professional Trader with an ex-insider!
Have a Nice Trading Week!
Cream Live Trading, Best Regards!
Galaxy Digital (GLXY) Pops 40% After CEO Buys 2.7% of SharesMike Novogratz, the founder and CEO of Galaxy Digital LP (GLXY) now owns around 80% of the company. Shares reacted well to the news, jumping 40% to close the day at $1.40 CAD.
Gold stocks showing strengthQuite a few gold stocks are showing strength.
All of them have seen-
1. A spike in volume
2. Greater price range for the day
3. New 3-month highs
These indicate a bullish run from Gold stocks, possibly testing previous highs.
Is the fact that gold is a safe haven in bearish markets causing this? Gold price going up, gold stocks going up.
Time to buy inverse etfs? With stocks markets falling like crazy it may be time to hold more cash than equity.
Inverse etfs might be a good hedging idea or a replacement to shorts.
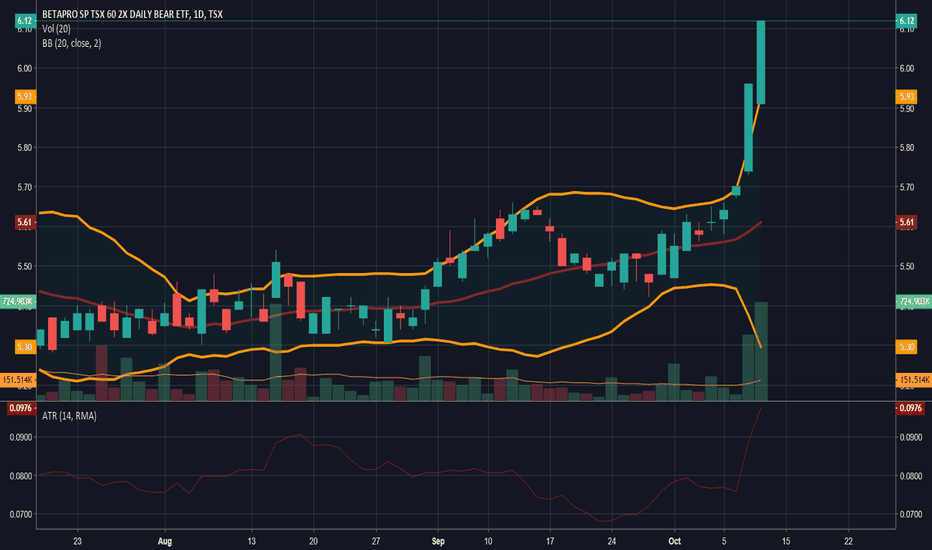
There have been big expansion the last two days. Volatility increase, range increase and strong green candles indicate a bearish tsx.
Usd/Cad , Lets Roll . Hey traders ,
First i want to mention that is most fundamental analysis , combination with technical.
Lets go straight to our chart:
USD/CAD is trading in a bull trend above the 200-day simple moving average (SMA).
On daily we see a green pin bar , from price action this is signal that the price will go lower.
The oil prices seems to recover after the bull pump that came out , crude oil it's on correlation with Cad because the main exports from Canada are in USA , i expect the price on oil come little down and then more up than the highs of Friday.
What effect can cause to this pair this move is to take it little higher , ( just lower high) and then sell of .
I believe in this move , because the dollar seems weak , the oil price go up , the news for Canada employment are good so i believe that the SHORT it is where we stand for .
Search for the best entry trigger along side the gaps from the weekend .
Thanks for your reading. Appreciate the feedback .
Good Week .
USDCAD - SUPPLY & DEMAND ZONE ANALYSISHi traders.
Whenever you are looking at a technical level, always ask yourself the following:
- Am I buying at a potential bargain/wholesale/discount price? (supply or demand zones)
- Why is there more likely to be more supply/demand orders at that area? (new traders entering/traders taking profit)
- What are the underlying fundamental/sentiment drivers that should push price in my favour? (interest rates, business cycle, risk on/risk off)
If all 3 are in your favour, take the trade, manage your risk and go for more than you've risked.
Always remember this trade is only 1 trade in the next thousand you're going to take.
Process over outcome!
USDCAD: After BoC Interest Rate Good afternoon everyone,
we are looking at the USDCAD pair again after the BoC Interest Rate decision. They did not change anything so the news were not that good for the CAD and for our long term short trade, that we linked below. On the other hand the pattern is pretty much the same as before. The only difference is that there is another spike high and a better entry chance for now - divergence also held its form. Means we are still overall bearish on this pair.
OPEC-JMMC Day: Oil and Loonie – Tentative moves?By Andria Pichidi - November 20, 2018
USDCAD and USOil, H4 and Daily
USOil prices reached an overnight high of USD 57.44 per barrel. The 4-day run higher in Oil prices, after a period of sharp declines, has helped the Canadian Dollar find a toehold. The contract has been supported by talk of a proposed production cut into year-end by OPEC and Russia, which was the main drive of yesterday’s sharp move higher, ahead of the December 6 meeting to be held in Vienna.
Bloomberg reported that Russia is in wait and see mode with regards to production cuts, quoting Russia energy minister Novak as saying producers need to “better understand both the current conditions and the winter outlook” before agreeing to cuts.
WTI crude is softer today, with prices having fallen back to levels just under $57 per barrel, after a 4-day rebound phase. Meanwhile USDCAD has retreated around the day’s Pivot Point at 1.3170 after pegging a 3-session high at 1.3202 yesterday. This puts Friday’s 12-day low at 1.3126 back in the scopes.
In the daily time frame, the cross has been seen moving within an ascending triangle since mid October, rebounding yesterday away from its lower trend line. As the price holds above the rising trend line, USDCAD remains in strong bullish sentiment in the medium picture. Only in case of a penetration along with the break of 20-day SMA and 23.6% Fib. level since October’s dip, would it find a Support level within 1 .3065-1.3078 area (38.2% Fib. level and 100-day SMA.)
Currently however, the market seems to be in a bullish mode overall, given that USDCAD is still trading above all the daily SMAs and with momentum indicators holding in the positive area. RSI has flattened above neutral and MACD dropped slightly below the trigger line, but remains well above zero line. Hence despite the fact that in the long term bullish bias holds strongly, in the near future, some consolidation is possible based on the flat RSI and small decline in MACD but also on the fact that 100 and 50 day SMA have been flattened in the daily chart. Resistance to the upside is set at yesterday’s high at 1.3200.
A jump above this resistance level could meet November’s high of 1.3263 . Further increases could move the price towards the 1.3300-1.3320 area.
As CAD and Oil are vulnerable to the possible OPEC plans to cut production, any remarks today from officials attending the OPEC-JMMC meeting, will weigh on the two assets. Nevertheless, BoC Wilkins speaks later today as well.
Andria Pichidi
Market Analyst
HotForex
Disclaimer: This material is provided as a general marketing communication for information purposes only and does not constitute an independent investment research. Nothing in this communication contains, or should be considered as containing, an investment advice or an investment recommendation or a solicitation for the purpose of buying or selling of any financial instrument. All information provided is gathered from reputable sources and any information containing an indication of past performance is not a guarantee or reliable indicator of future performance. Users acknowledge that any investment in FX and CFDs products is characterized by a certain degree of uncertainty and that any investment of this nature involves a high level of risk for which the users are solely responsible and liable. We assume no liability for any loss arising from any investment made based on the information provided in this communication. This communication must not be reproduced or further distributed without our prior written permission.
USDCAD BOOM BEARISH 90% CONTINUATION FOR 250 PIPSPrice is consolidating in a bearish channel on Daily timeframe where price made a fake bullish breakout of bearish channel then retraced back down closing the weekly inside the bearish channel, anticipating bearish trend to continue down to 1.2900 (tp1) where price breaks level and continues bearish with 1.2572,1.26825, 1.25815 as next target levels, price seems to be retracing bullish which we await a confirmation of bearish trend continuation with our entry points for this setup between 1.2930 - 1.29663 (1.29663 perfect entry with 0 risk) with 75 - 252 pips profit, stoploss 1.29667- 1.30325 (45-75pips from entry) giving 1/5 R:R
Pivot 1hr PP- 1.29420 R1- 1.2947 s1- 1.29388 r2- 1.29498 s2- 1.29342 r3- 1.29544 s3- 1.2931
4hr PP- 1.2937 r1- 1.29458 s1- 1.29288 r2- 1.2954 s2- 1.2920 r3- 1.29628 s3- 1.29118 risk only 10% of funds
PONY Can Go Either Way - Wait for the BreakDumped hard from the top of the rising wedge I outlined in my last analysis. Has found some support at one of the previous key demand areas, which coincides with the 78.6% retrace. Looks to have formed a flag now, which can break either way. RSI is near oversold on the daily, but the 4h Stoch is forming a bearish cross. If I had to bet, I'd guess it's going to break down toward the lower support line, but its safer to wait and see how it plays out.
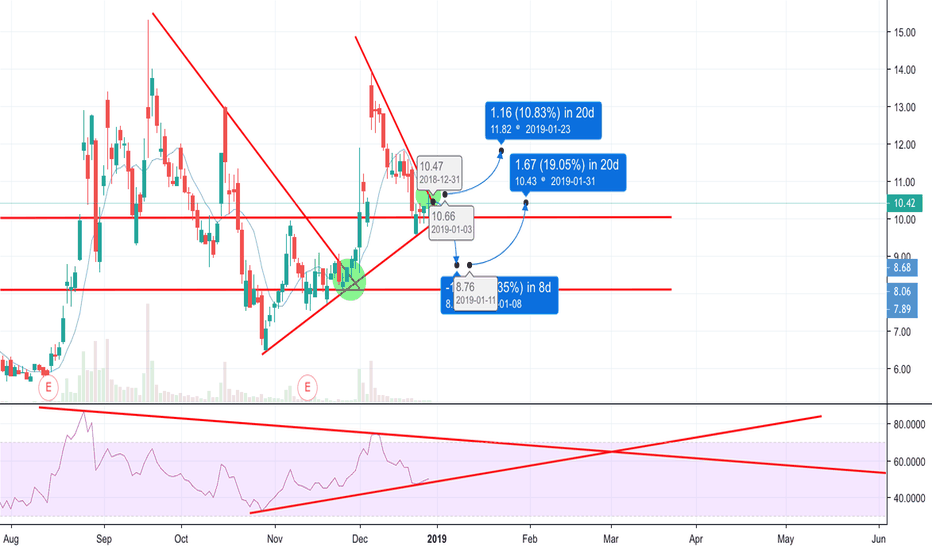
Maxar Rebound Attempt 2Daily MACD bullish cross, Stoch RSI moving up, huge bullish divergence on the RSI while still being near oversold. Found support once again on the 23.6% forming a double bottom. Earnings report coming at the end of the month. Expected growth from Q3 last year is 11%.


