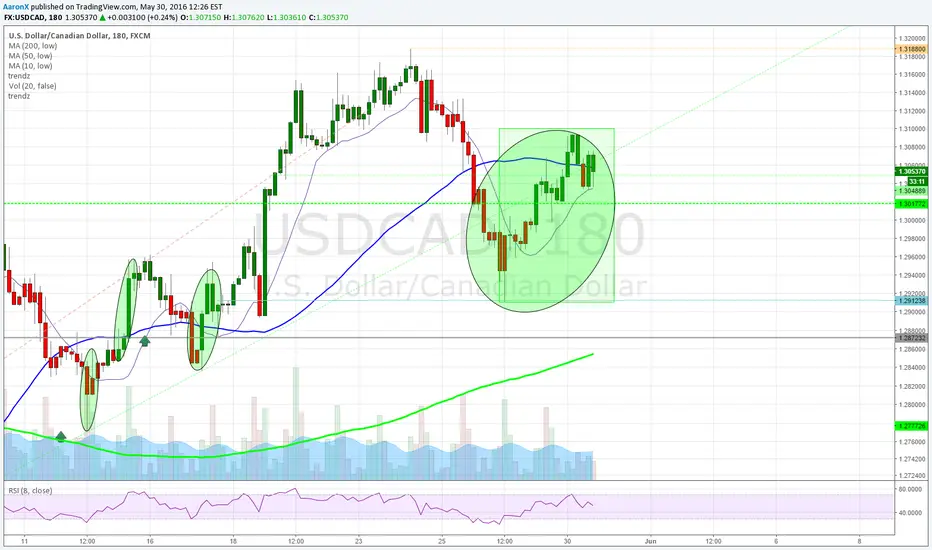
LONG USDCAD, WATCH PA YELLOW BOX As usual my rough idea how the market may proceed in the next few months
Canada

It looks like CRUDEOIL will be between 50-53 this week! FINALLYThe uptrend continues since CRUDE hit 30s. It looks like there is nothing much to keep it lower than 50 this week. Maybe even 53+
Best position would be to go long around 48.50 and TP around 51 but that may be risky. Your call :)
Good luck.
LIKEs and FOLLOWs are appreciated.
Thanks!

#USDCAD ABC Correction In Play To Complete Wave 4!This is a monthly chart so it gives the clear vision on where to put your money and where the market is most likely headed.
We have just successfully completed waves 1,2 & 3 now looking to complete wave 4 around 122-120 before going long to the 160 level.
Trade safe, nothing is guaranteed in this market!

CAD/JPY - Confluences upon confluencesTook a long position on this pair based on the following reasons:
- Ascending W/D trendline has not been broken + LH have been made constantly
- Inverted H+S pattern on daily
However, as this is a rising wedge, this has the potential to fall right through the roof and continue heading south, I have entered slightly early neglecting PA, so be patient and assess the situation.
Trade smart.

EURCAD - Good tradeHighly anticipated higher prices soon. I'm Neutral for now , waiting for more price action to confirm my bias to the upside.

USDCAD LONG POSSIBILITIES THIS WEEKCurrently watching USDCAD during a possible completion of another ABCD pattern . I will not be holding this trade until it reaches D because it could possibly form a double top. I'll be taking profits when it climbs back to B price point 1.318.

USDCAD bull setup again? (:50sma catching bullish again! This could be swinging even higher near the 1.32's.


AUD/CAD Long!!! Another Bounce In ActionAgain, on the daily time frame we see a nice wedge forming here. It appears to me a bit to early for the breakout which is making me lean toward a long position. In addition the 200sma is acting as support to PA. Seems to be a high probability long play here.
As always, risk management is crucial!!!

USDCAD NEUTRALThere are technicals for either outcome to go off from my analysis here on the USDCAD Daily. Given the monthly support rejected price aswell as the top channel rejecting price for a 3rd bounce, gives me an incline a B/O seems pretty natural and potentially to the upside. however with all MA'S crossed over to the downside on all higher TF'S & bearish engulfings formed on resistance a continuation could be @ hand.. whatt do you all think>

$CADJPY Smaller Wolfe Wave Nears Completion at Point 5Hello Traders,
Here is a bearish Wolfe Wave forming. This is a smaller time frame Wolfe than the larger one I have linked below and also highlighted in grey. This could potentially cancel out the larger frame Wolfe. If the larger time frame Wolfe completes at Geo"s Off-Set rule we could have a Wolfe Wave completion at 5" for the smaller Wave. It will be interesting to see how this plays out.
Side Note - The dotted orange line represents an invalidation line, something I picked up from 4xforecaster. In order to know when the projected Wolfe is invalidated, one must take the parallel of the 1-3 and place on the current point 4. If price surpasses this line, then the current Wolfe Wave is invalidated. You can view more cool lessons from 4xforecaster here: www.tradingview.com
Best,
Chartistry

CADJPY: Potential for huge downside in this pairCADJPY has broken under a previous week's low recently after finding massive supply coming in at a previous low volume resistance level, where the bears showed hand. Interestingly enough, we now have 5 closed quarters without a new high, and a close under the quarterly mode, thus confirming a long term downtrend in this pair is viable.
The weekly chart shows us with clarity where the highest activity levels sit. Currently we have 8 week levels where price has transacted at, soon to become 9, thus favoring continuation of the downtrend that kicked off during December 2015.
Once we observe price move under 82.774, it'd be safe to assume we might have a sharp decline, with potential to hit the 75 handle in 9 weeks or less. Confirmation according to the time at mode logic would arrive later, but I'm already in this trade based on the daily chart price action. We have 5 days without a new high after today's close, further validating this thesis. You can go short on any intraday retracement, or at market now, with stops above the 85 mark.
Good luck if taking this trade, if interested in receiving timely trade signals and/or tuition, contact me privately for more information. I'm currently offering a discount for new clients who opt for my trading course.
Cheers,
Ivan Labrie.

The main Canadian index showing a nice path for the stock marketThe main Canadian index shows a very nice picture telling us to expect sideways action before another upleg materialize to end the advance from the January low. A very nice rally that is running out of steam pretty much like the US market.
A good target is around the 14K mark. We will keep an eye on it and we think the top is in, we will let you know.
This index has a strong bias towards Financials, Energy and Gold miners thus even if I think it is a good proxy for the overall direction of all markets, it is an even better indicator for those three sector and especially Energy and miners.
We see this rally and the upcoming pullback as part of a bigger rally. In other word, we are bullish long term until further notice

USDCAD Divergence Movement for "Up" trendBasic divergence movement has occured in 4h chart. Breaking up 1.3322 point is first strong buy signal and 1.3392 is the next.
We wish you all have a profitable trade!
Adim Adim Forex

AUD/CAD very possible shortI can assume we are most likely to have opportunity to go short in this pair. after a high rise of this currency, we are back to the downtrend.
I set my stop loss around 50 pips just above my fibb retracement
take profit around 0.9840-20
Happy Trading

Possible bat pattern formation on CADEURHope for a completion of this bat pattern to enter at 0.701
There could also be RSI signals if this forms. If the RSI is overbought at the time of formation then we have a stronger case for the second target to be met.

USDCAD - in descent for 11 weeks, time to go long?With oil prices rebounding flow towards commodity currencies was evident. While guessing Crude oil tops is pointless, after 11 weeks and more than 11 % appreciation loonie might be at a resting point.
The Canadian government is to anounce its fiscal stimulus, I believe most positive factors are already priced in, hence I am trying to go long at the weekly 61.8% fib retracement level, trying to get around 3% nominal move.

CADAUD cypher and Gartley movementsNo trade setup here, just some formations and potential formations to give an insight into multiple harmonic patterns.
Look for the cypher that has already formed to swing into a Gartley formation.
Potential Gartley is perfect - exact confluence between the 0.786 retracement and 1.272 extension.

$NZDCAD Wolfe Wave Completion at 5', Geo Off-Set Rule Target$NZDCAD created a bullish Wolfe Wave in the 4hr time frame. The structure completed at 5' so we are looking at the Off-Set rule at point 4 as a target.
Happy Trading.

$CADJPY Wolfe Wave, 5' Completion, Geo Off-Set Rule TargetHello Traders,
CADJPY completed a Wolfe Wave at 5'(5 prime) and is now looking at the Geo Off-Set Rule at point 4.
An entry at this level will be of moderate risk.

High probability Breakout BUY USD CAD As Eur/Usd is due for a draw down soon the Loonie is looking for a push to the upside. If Price ends above 1.34664 on the 1hr chart look to go long.
