CPI triggers sell-off, 3330 can be short-term long📰 News information:
1. Focus on tomorrow's CPI data
2. Bowman's speech at the Federal Reserve
3. Tariff information outflows and countries' responses to tariff issues
📈 Technical Analysis:
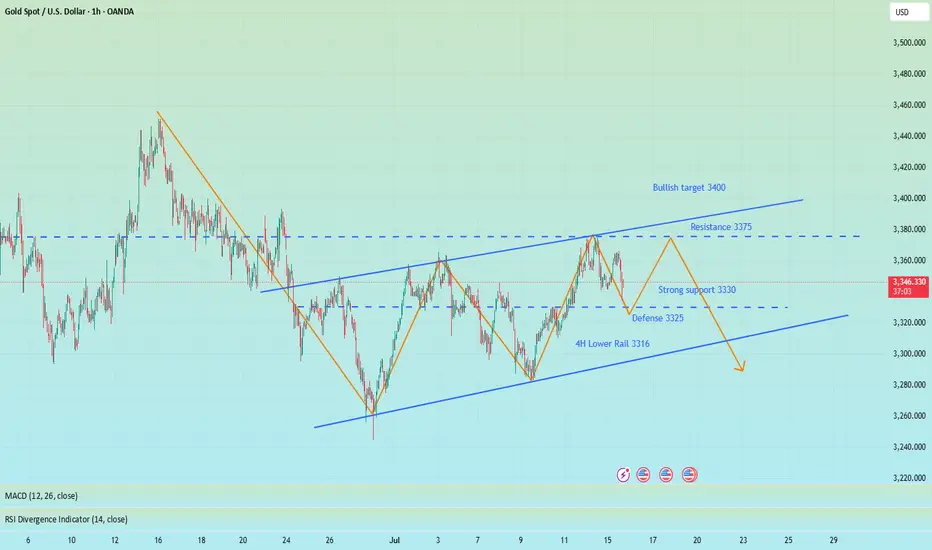
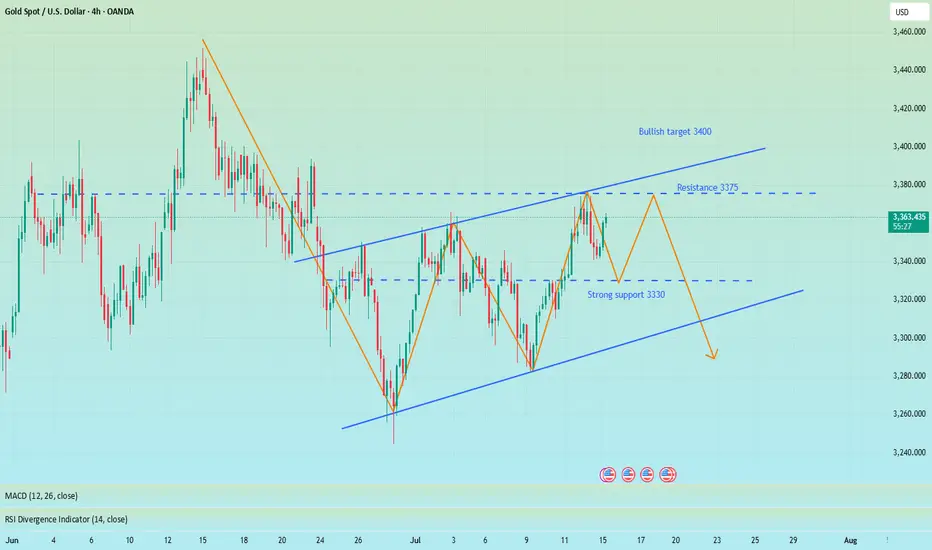
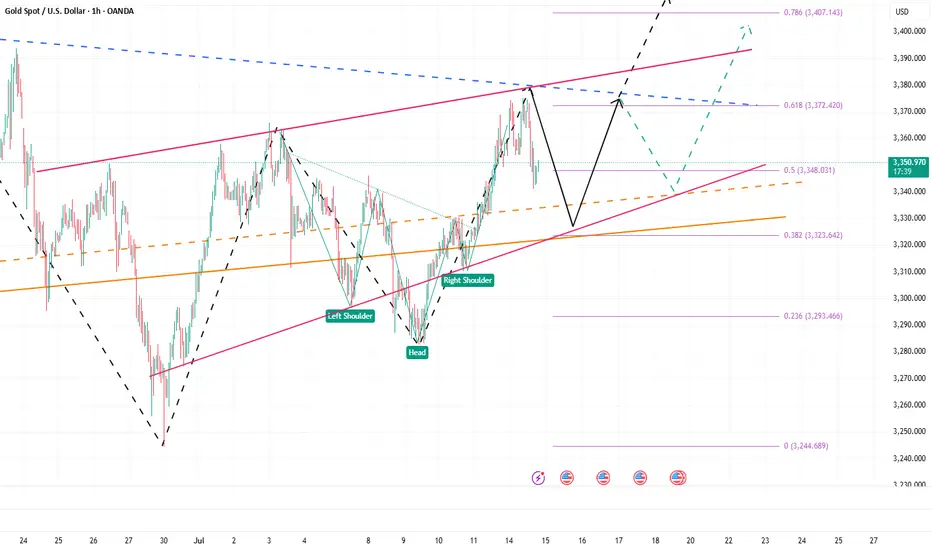
The short-term trend flag pattern has been formed, and our short-selling strategy perfectly hits the TP. According to current news, Trump has once again urged the Federal Reserve to cut interest rates. While there is almost no possibility of a rate cut this month, there is a high probability that a 25 basis point rate cut will be completed in September, which is also in line with our previous prediction of market trends.
The big negative line in 4H pierced the middle Bollinger band. Although the CPI data is bullish, it has little impact based on the announced value. Market expectations have been digested in advance, so there is no room for a big drop. The upper points still focus on the short-term resistance of 3355-3365. If it rebounds to this area first in the short term, you can consider shorting again. Focus on the strong support of 3330 below. As long as the retracement entity does not fall below 3330, gold will rise again and touch the resistance line of 3375-3385.
🎯 Trading Points:
BUY 3335-3325
TP 3355-3365
In addition to investment, life also includes poetry, distant places, and Allen. Facing the market is actually facing yourself, correcting your shortcomings, facing your mistakes, and exercising strict self-discipline. I share free trading strategies and analysis ideas every day for reference by brothers. I hope my analysis can help you.
OANDA:XAUUSD PEPPERSTONE:XAUUSD FOREXCOM:XAUUSD FX:XAUUSD TVC:GOLD FXOPEN:XAUUSD
Candlestick Analysis
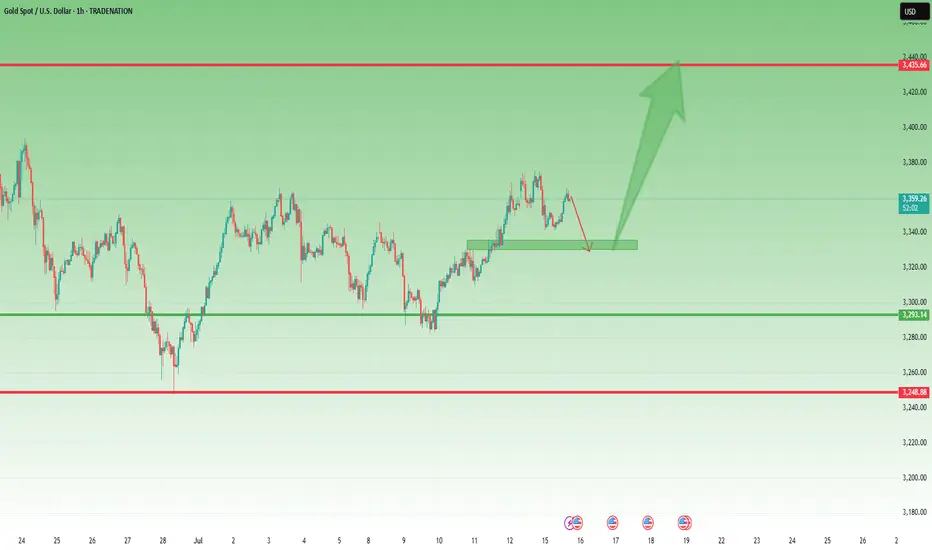
Gold Pullback in Play – Still Aiming for 3450 📌 In yesterday’s analysis, I argued that bulls likely won the battle and that a new leg up toward 3450 could be next from a swing trade perspective. I also mentioned that buying dips remains the preferred strategy.
And indeed – we got that dip.
📉 Price pulled back to 3340 and bounced,
but it hasn’t yet touched my key area of interest: 3330–3335.
What now?
My view stays the same –I still expect a move toward the 3450 zone,but I also believe a deeper dip toward support is still on the table – likely a liquidity grab before the next leg up.
Trading Plan:
✅ Buying dips remains the core strategy
🚫 Invalidation only comes on a break below 3305–3310
🎯 Upside target remains well above 3400, aiming for 1000+ pips
Let’s stay focused and let price come to us.
🚀
Disclosure: I am part of TradeNation's Influencer program and receive a monthly fee for using their TradingView charts in my analyses and educational articles.
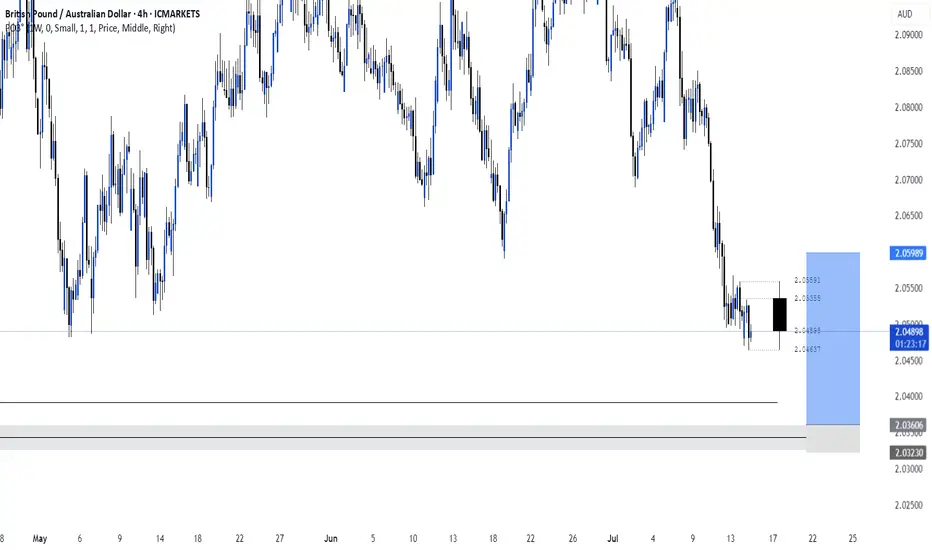
GBPUSD TRADE RECAP AND ANALYSISFrom the previous day we can see the market had a slight retrace and sold into key support area. will price break this area or not? we will have to wait to find out

FX Matrix: DXY, GBPUSD, EURUSD Weekly UpdateWeekly Targets:
DXY: 98.138 - 98.261
GBPUSD: 1.34148 - 1.33606
EURUSD: 1.14463

US10Y & T-Bond Futures Weekly UpdateWeekly Targets:
US10Y: 4.445% - 4.477%
T-Bond: 112.18 - 112.12 - 111.25

Trading Day SummaryTrading Day Summary
Today wasn’t a winning day on the books, but it was a major win in discipline.
I hit my daily loss limit before 10 AM, stopped live trading, and switched over to paper trades to protect my capital.
The setups I took—especially in Gold and Euro—lacked full confirmation, and one overnight trade didn’t align with my plan.
I experienced around $200 in slippage, which added to the loss.
The bright side? I stayed in control. No revenge trades. No emotional spirals.
My paper trade afterward was textbook—5R+ potential. That tells me the strategy is sound. Execution and timing just need to be sharper.
Bottom line: this is a marathon, not a sprint. I’m proud of the discipline and the mindset. Tomorrow, we reset and refocus.

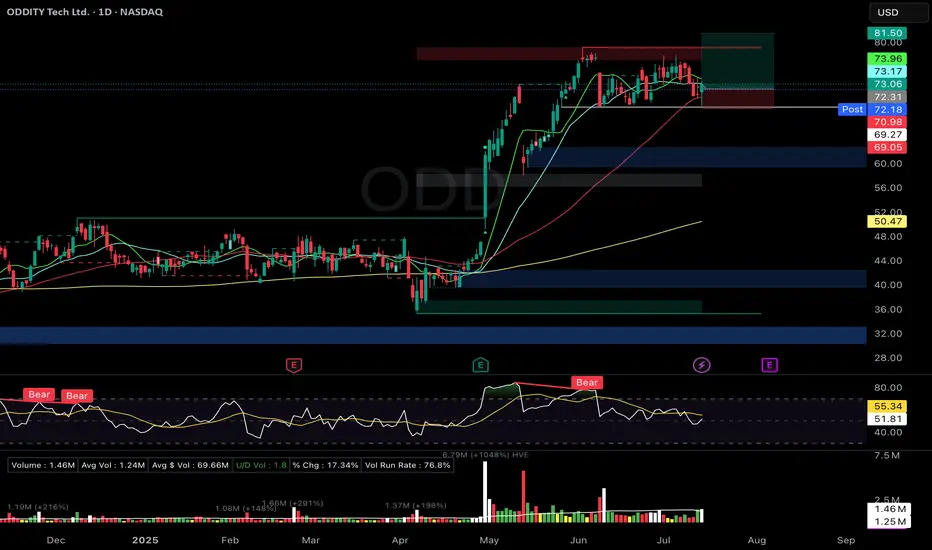
ODD Flat Base (Stage 2) – Support ReversalOddity Tech Ltd. ( NASDAQ:ODD )
🚀 Entry: $72.31
📊 Setup: Flat Base (Stage 2) – Support Reversal
🛑 Stop: $69.05
🎯 Target: $89.50
🔑 Why I Entered:
Solid 6-week flat base (~13% depth) with a bullish hammer candle reversal off the 50-DMA and key support.
Moving averages (10/21/50 DMA) are coiling tightly, indicating a potential breakout.
Strong institutional accumulation signals backed by increasing volume.
Exceptional fundamentals: EPS growth at 79%, RS Rating at 95, Composite at 97 (per IBD).
🎯 What's Next:
Watching for a decisive breakout above the $79.18 pivot on high volume for a potential scale-in.
Earnings due in two weeks—staying vigilant for any unusual volatility ahead of the announcement.
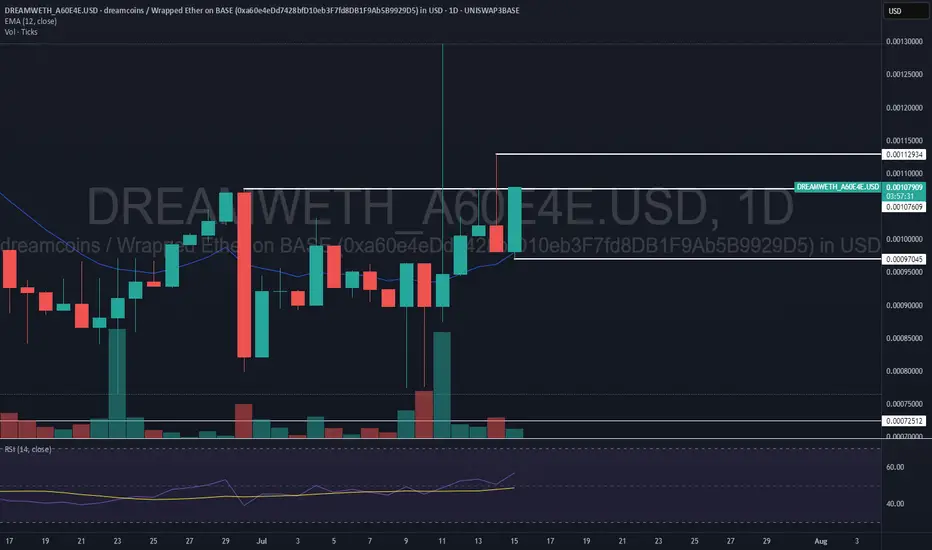
Can Dreamcoin bulls have a daily uptrend?Price failed to close about last week high and bears still have full control, however a daily uptrend could be the first step for a weekly bounce.
price lost the 4 hour uptrend but the daily 12 ema acted as support. Bulls would need to regain the 4 hour uptrend to confirm the the daily uptrend above 0.00113 to hint the weekly bounce.
Anything below 0.00097 would negate this possibility.
Mid-Session Market ReviewMid-Session Market Review
S&P 500: After some initial volatility from the 8:30 news, the market accepted above the prior day’s levels but has since pulled back within range, consolidating just below the highs.
NASDAQ: The NASDAQ remains above all of yesterday’s levels and is currently balancing between the high of the day and the 23,100 level, showing a rotational pattern.
Russell 2000: This market is rotational within the prior day’s range and has accepted below the CVA and PVA. Potential trade opportunities might come with a pullback to the 2,245 area.
Gold: Gold has accepted below the prior value area and is still rotational within the CVA. Trade opportunities could present themselves near the prior day’s low.
Crude Oil: The market is quite choppy, hovering around the prior day’s low and value area low. Caution is advised, with potential long opportunities on a pullback, as long as conditions align.
Euro Dollar: The Euro is dropping significantly, moving below all key levels without much respect for them. This could provide short opportunities if there’s a pullback.
Yen: Similar to the Euro, the Yen is also pushing below previous levels. It’s getting choppy near the CVA low, so caution is needed until it shows more respect for those levels.
Natural Gas: The market is rotational within the prior day’s range and respecting the CVA high. Long opportunities might be possible if conditions are right.
Aussie Dollar: It’s showing some respect for the CVA low and is still rotational. There could be a potential long setup forming, depending on how it plays out.
British Pound: The Pound has accepted below all key levels, and a pullback to the CVA low might provide short opportunities, though caution is needed around the VWAP.

Nifty Analysis EOD – July 15, 2025 – Tuesday🟢 Nifty Analysis EOD – July 15, 2025 – Tuesday 🔴
"Buyers Step Back with Conviction, Reclaim Lost Ground"
Nifty began the session with a flat-to-positive tone, and the first 5-minute candle confidently added 60 points, pushing the index toward 25,150 – aligning with the Previous Day High (PDH). However, the level couldn't hold on the first attempt and Nifty slipped back to the day's open. After a brief consolidation, bulls made a strong comeback.
The second push broke through the PDH, Day High, and the resistance zone of 25,180–25,212, and extended the move up to mark the day’s high at 25,245.20. Post that, the index hovered above the breakout zone and closed solidly at 25,195.80, showing strength and follow-through.
📈 The day’s structure was clean and directional — a healthy bounce and hold above critical levels, reinforcing the idea that buyers are regaining control after last week’s consolidation and weakness.
🕯 5 Min Time Frame Chart with Intraday Levels
🕯 Daily Time Frame Chart with Intraday Levels
🕯 Daily Candle Breakdown
Open: 25,089.50
High: 25,245.20
Low: 25,088.45
Close: 25,195.80
Change: +113.50 (+0.45%)
📊 Candle Structure Breakdown
Real Body: 106.30 points – strong green bullish body
Upper Wick: 49.40 points – profit-taking or resistance at highs
Lower Wick: 1.05 points – negligible dip from open
🔍 Interpretation
Opened flat and quickly built momentum.
Temporary pullback in first 15 minutes was bought into strongly.
Closed with a clean green body, showing clear intraday bullish intent.
Holding above the 25,180–25,212 zone is a big win for bulls.
🕯 Candle Type
Bullish Marubozu-like (strong green body with minimal lower wick) — shows conviction and potential start of a new upswing post recent chop.
📌 Key Insight
25,080–25,100 is now a key base and must be protected.
If Nifty can break and hold above 25,240–25,250, a move toward 25,295–25,315 looks likely.
Failure to hold above 25,180 would be first sign of hesitation.
🛡 5 Min Intraday Chart
⚔️ Gladiator Strategy Update
ATR: 186.18
IB Range: 67.35 → Medium IB
Market Structure: 🟢 Balanced
Trades Triggered
10:30 AM – Long Trade → ✅ Target Achieved, Trailed SL (R:R 1:2.48)
📌 Support & Resistance Zones
Resistance Levels
25,168
25,180 ~ 25,212
25,260
25,295 ~ 25,315
Support Levels
25,125
25,080 ~ 25,060
25,000 ~ 24,980
24,965
💭 Final Thoughts
"Trend is nothing without follow-through — today buyers showed up, but tomorrow they must push past 25,250 to prove it wasn't just a bounce."
✏️ Disclaimer
This is just my personal viewpoint. Always consult your financial advisor before taking any action.

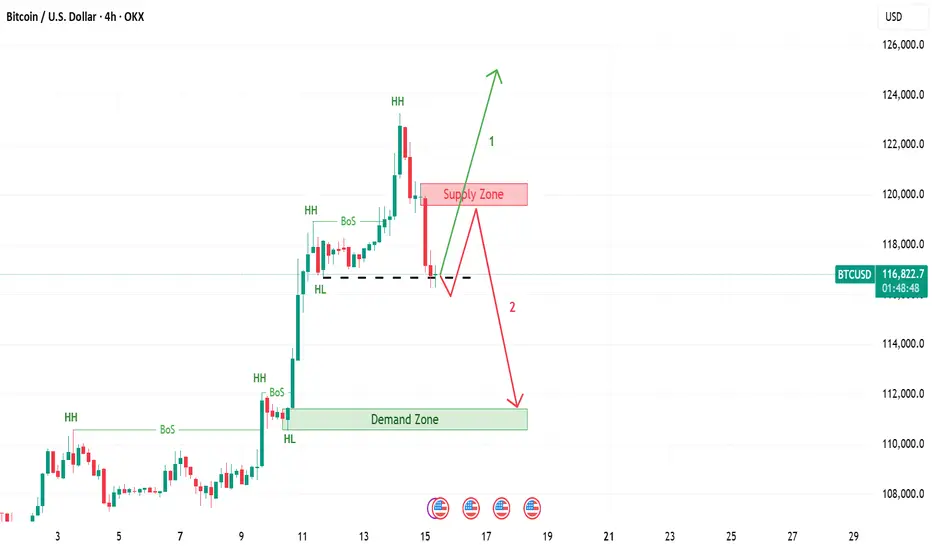
Bitcoin | 2 Scenarios If the 4 hour candle closes below last HL, then expect price return to supply zone and then go down till demand zone. If not, expect continuation of the upward trend, when 4 hour candle breaks last HH.
Which scenario you expect?
Don’t hesitate, a massive gold move Is brewingRefer to my previous trading idea. Gold retreated as expected. We almost caught the highest point of the day and shorted gold near 3365, and successfully hit TP: 3346, which enabled us to successfully profit 190pips in short-term trading, with a profit of nearly $10K, which is a good result in short-term trading.
Currently, the lowest point of gold in the retracement process has reached around 3335, which has fully released the short energy and vented the bearish sentiment in the market. All the bad news is out, which means good news! Although gold fell from 3375 to 3335, the retracement was as high as $40, but the rising structure has not been completely destroyed. The previous W-shaped double bottom support structure and the resonance effect of the inverted head and shoulder support structure still exist. As long as gold stays above 3325, gold bulls still have the potential to attack.
Moreover, after this round of retracement, the bearish sentiment of gold was vented, and the liquidity was greatly increased, attracting more buyers to actively enter the market. Gold may start a retaliatory rebound, and even touch 3375 again or even break through and continue to the 3380-3390 area.
So for short-term trading, I think we can try to go long on gold in the 3335-3325 area appropriately, first looking forward to gold regaining lost ground: 3350-3360 area, followed by 3380-3390 area.

Pre-Market PrepToday’s market insights show a lot of potential opportunities across the board:
S&P 500: We’re in a strong upward imbalance, trading above the prior day’s range and value area. The focus is on long opportunities, but waiting for confirmation on any pullbacks.
NASDAQ & Russell 2000: Similar to the S&P, both are also in an upward imbalance. For the Russell, there’s a specific focus on looking for long setups around the prior day’s high.
Gold: The market is rotational within the prior day’s range and value area, with a slight bias toward looking for long opportunities from the lower end of that range.
Crude Oil: After some initial volatility, it has settled back into the prior day’s range. Long opportunities look promising, especially on a pullback to the CVA low.
Euro Dollar: The market is a bit low on volume and holding below the CVA. Longs are considered if we see acceptance back into that area, while shorts are on the table if we remain below the prior day’s value area.
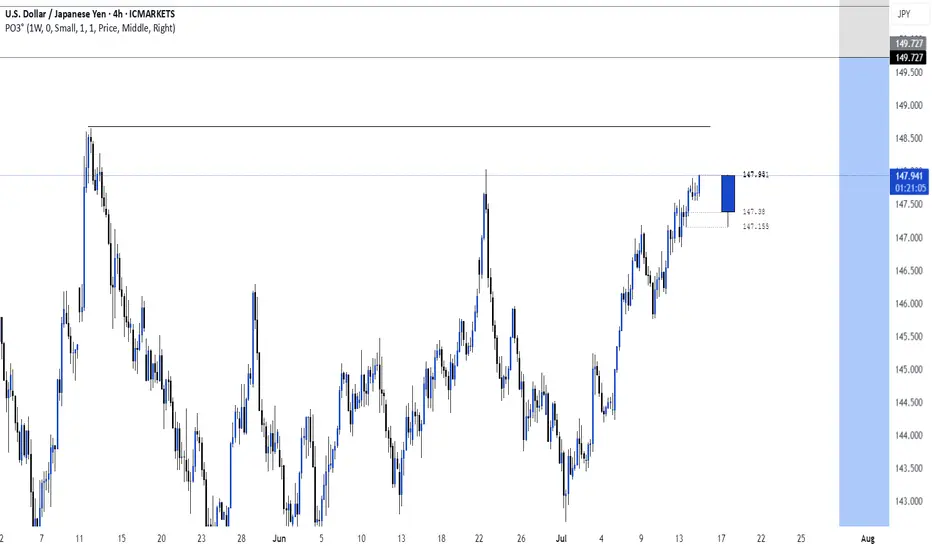
Yen Dollar: Trading below the prior day’s range and value area, the focus is on short opportunities, especially if we see continued acceptance below key levels.
Aussie Dollar: It’s rotational and currently above the prior day’s value area, making both long and short opportunities viable, depending on how the market moves.
Nat Gas: It’s also rotational within the prior day’s range, but further analysis is needed after updating levels.
Overall, the strategy is to trade smart, confirm setups, and stay aware of the bigger trends while managing risk.

Gold’s Uptrend Is a Mirage, Bears Are Lurking Beneath!Gold repeatedly touched around 3375 yesterday and then fell under pressure, proving that there is strong resistance above. Moreover, after gold retreated and touched around 3341 yesterday, it did not recover in time and stand above 3350. It was not until today that it rebounded and touched around 3365. The rebound cycle has been extended to the present, and the rebound strength is not very strong.
Since gold retreated, it has not been able to recover the lost ground in time. Gold is under pressure in the 3360-3370 area in the short term. If gold cannot successfully break through this resistance area during the day, then gold will retreat again, and will refresh the 3341 low again, and continue to the 3335-3325 area.
So for short-term trading, I think we can try to short gold in the 3360-3370 area appropriately, looking at the target area: 3350-3340
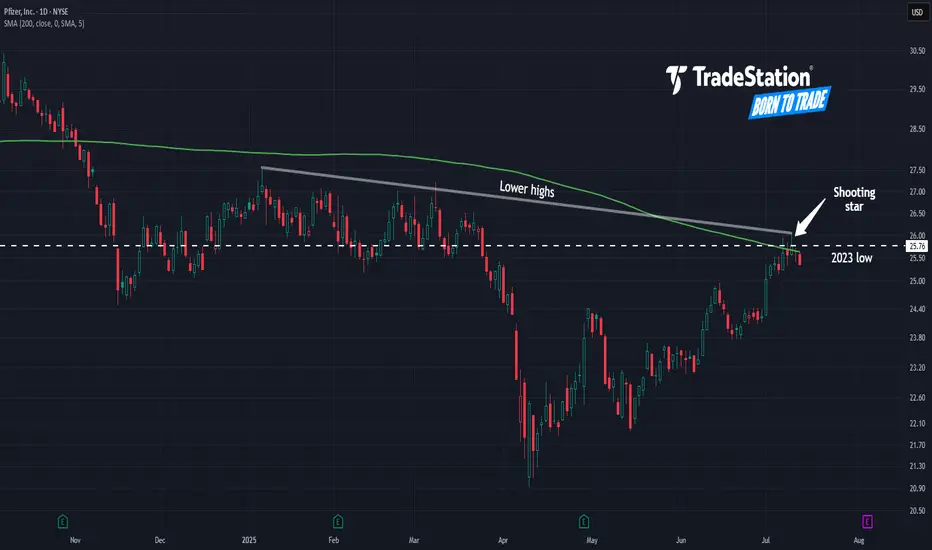
Pfizer May Be StallingPfizer has limped higher since April, but some traders may think the pharmaceutical giant is at risk of stalling.
The first pattern on today’s chart is the series of lower highs since January. PFE potentially just made another lower high at this falling trendline, which may suggest resistance is taking effect.
Second, the peak is occurring near the 200-day simple moving average. That could indicate its long-term trend is pointing lower.
Third is the 2023 low of $25.76. At the time, it was the lowest price in the preceding decade. After spending more than a year on either side of this level, PFE is now stalling in the same area. Has old support finally turned into new resistance?
Fourth, the candles of July 8 and July 10 showed prices trying and failing to cross the same long-term level. Such “shooting star” candlesticks may be short-term reversal patterns.
Finally, PFE is an active underlier in the options market. (It’s averaged more than 90,000 contracts per session in the last month, according to TradeStation data.) That might help traders take positions with calls and puts.
TradeStation has, for decades, advanced the trading industry, providing access to stocks, options and futures. If you're born to trade, we could be for you. See our Overview for more.
Past performance, whether actual or indicated by historical tests of strategies, is no guarantee of future performance or success. There is a possibility that you may sustain a loss equal to or greater than your entire investment regardless of which asset class you trade (equities, options or futures); therefore, you should not invest or risk money that you cannot afford to lose. Online trading is not suitable for all investors. View the document titled Characteristics and Risks of Standardized Options at www.TradeStation.com . Before trading any asset class, customers must read the relevant risk disclosure statements on www.TradeStation.com . System access and trade placement and execution may be delayed or fail due to market volatility and volume, quote delays, system and software errors, Internet traffic, outages and other factors.
Securities and futures trading is offered to self-directed customers by TradeStation Securities, Inc., a broker-dealer registered with the Securities and Exchange Commission and a futures commission merchant licensed with the Commodity Futures Trading Commission). TradeStation Securities is a member of the Financial Industry Regulatory Authority, the National Futures Association, and a number of exchanges.
Options trading is not suitable for all investors. Your TradeStation Securities’ account application to trade options will be considered and approved or disapproved based on all relevant factors, including your trading experience. See www.TradeStation.com . Visit www.TradeStation.com for full details on the costs and fees associated with options.
Margin trading involves risks, and it is important that you fully understand those risks before trading on margin. The Margin Disclosure Statement outlines many of those risks, including that you can lose more funds than you deposit in your margin account; your brokerage firm can force the sale of securities in your account; your brokerage firm can sell your securities without contacting you; and you are not entitled to an extension of time on a margin call. Review the Margin Disclosure Statement at www.TradeStation.com .
TradeStation Securities, Inc. and TradeStation Technologies, Inc. are each wholly owned subsidiaries of TradeStation Group, Inc., both operating, and providing products and services, under the TradeStation brand and trademark. When applying for, or purchasing, accounts, subscriptions, products and services, it is important that you know which company you will be dealing with. Visit www.TradeStation.com for further important information explaining what this means.
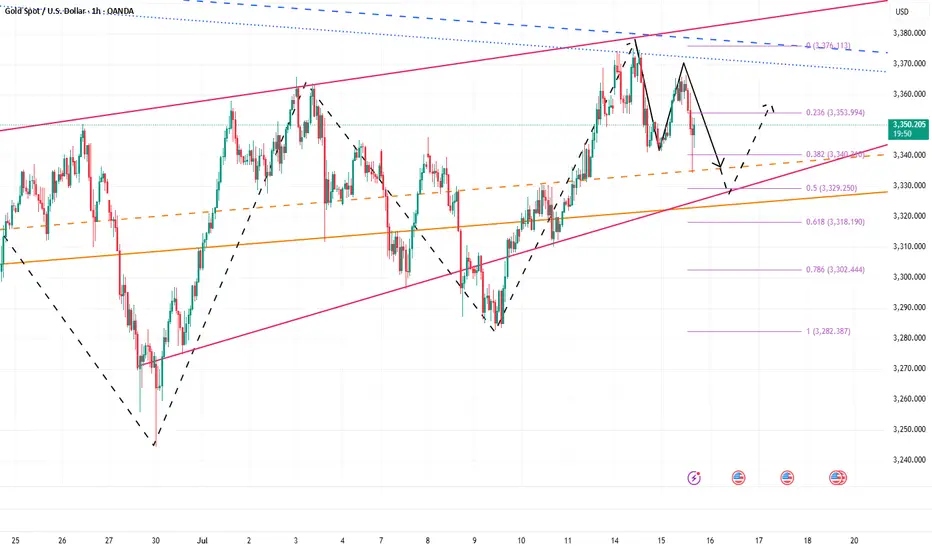
It is expected to fluctuate and fall before CPI data📰 News information:
1. Focus on tomorrow's CPI data
2. Bowman's speech at the Federal Reserve
3. Tariff information outflows and countries' responses to tariff issues
📈 Technical Analysis:
The 1H chart shows that the gold price continued to pull back last night and then fluctuated at the bottom, and continued the rebound trend this morning. The key pressure level is the top and bottom conversion level. The current rebound in gold is only a secondary confirmation of the top structure at the 30-minute level. After reaching 3365, it has shown signs of short-term pressure. In a volatile market, if the price begins to consolidate horizontally, it may indicate the end of this round of volatile upward trend, and it will enter a downward phase later. Considering the market sensitivity before the release of CPI data, it is recommended to focus on the volatile decline trend. After today's rebound, it is necessary to focus on the 3365-3368 area as a short-selling range, and the long-short defense position is set at yesterday's intraday high of 3375. The support below focuses on the 3350-3340 range.
🎯 Trading Points:
SELL 3358-3368
TP 3345-3333
In addition to investment, life also includes poetry, distant places, and Allen. Facing the market is actually facing yourself, correcting your shortcomings, facing your mistakes, and exercising strict self-discipline. I share free trading strategies and analysis ideas every day for reference by brothers. I hope my analysis can help you.
FXOPEN:XAUUSD TVC:GOLD FX:XAUUSD FOREXCOM:XAUUSD PEPPERSTONE:XAUUSD OANDA:XAUUSD
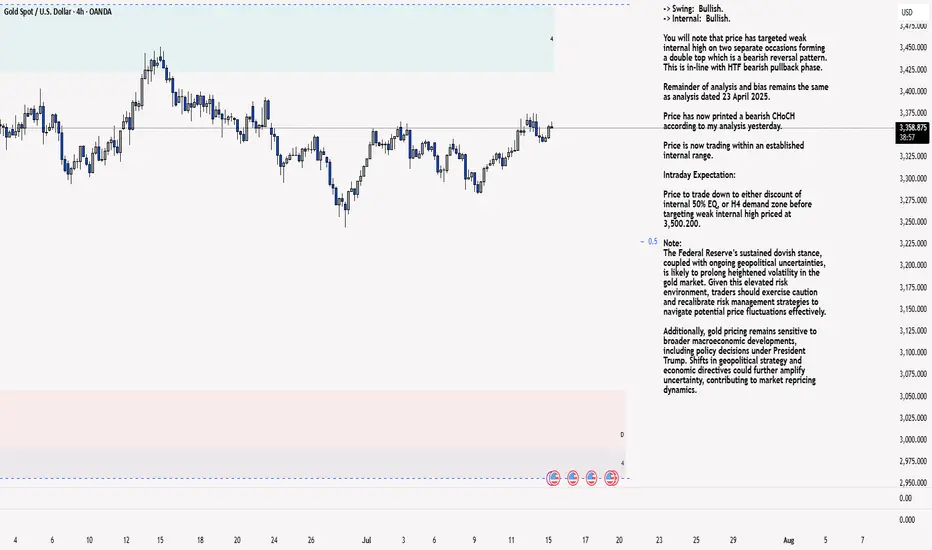
XAU/USD 15 July Intraday AnalysisH4 Analysis:
-> Swing: Bullish.
-> Internal: Bullish.
You will note that price has targeted weak internal high on two separate occasions forming a double top which is a bearish reversal pattern. This is in-line with HTF bearish pullback phase.
Remainder of analysis and bias remains the same as analysis dated 23 April 2025.
Price has now printed a bearish CHoCH according to my analysis yesterday.
Price is now trading within an established internal range.
Intraday Expectation:
Price to trade down to either discount of internal 50% EQ, or H4 demand zone before targeting weak internal high priced at 3,500.200.
Note:
The Federal Reserve’s sustained dovish stance, coupled with ongoing geopolitical uncertainties, is likely to prolong heightened volatility in the gold market. Given this elevated risk environment, traders should exercise caution and recalibrate risk management strategies to navigate potential price fluctuations effectively.
Additionally, gold pricing remains sensitive to broader macroeconomic developments, including policy decisions under President Trump. Shifts in geopolitical strategy and economic directives could further amplify uncertainty, contributing to market repricing dynamics.
H4 Chart:
M15 Analysis:
-> Swing: Bullish.
-> Internal: Bullish.
H4 Timeframe - Price has failed to target weak internal high, therefore, it would not be unrealistic if price printed a bearish iBOS.
The remainder of my analysis shall remain the same as analysis dated 13 June 2025, apart from target price.
As per my analysis dated 22 May 2025 whereby I mentioned price can be seen to be reacting at discount of 50% EQ on H4 timeframe, therefore, it is a viable alternative that price could potentially print a bullish iBOS on M15 timeframe despite internal structure being bearish.
Price has printed a bullish iBOS followed by a bearish CHoCH, which indicates, but does not confirm, bearish pullback phase initiation. I will however continue to monitor, with respect to depth of pullback.
Intraday Expectation:
Price to continue bearish, react at either M15 supply zone, or discount of 50% internal EQ before targeting weak internal high priced at 3,451.375.
Note:
Gold remains highly volatile amid the Federal Reserve's continued dovish stance, persistent and escalating geopolitical uncertainties. Traders should implement robust risk management strategies and remain vigilant, as price swings may become more pronounced in this elevated volatility environment.
Additionally, President Trump’s recent tariff announcements are expected to further amplify market turbulence, potentially triggering sharp price fluctuations and whipsaws.
M15 Chart:
Eyes on 3335–3325: Next Bullish Launchpad!!!Today, gold hit 3375 several times and then fell back after encountering resistance. The lowest has reached 3341. Although the rising structure has not been completely destroyed, and the technical double bottom structure and the inverted head and shoulder structure support resonance effect still exist below, since gold fell below 3350, it has not even been able to stand above 3350 in the current rebound. The gold bull pattern has been weakened to a certain extent, and the market has begun to diverge in the long and short consciousness.
Gold encountered resistance and fell back near 3375 three times, proving that the upper resistance is relatively strong. Gold must increase liquidity by retracement to store more energy for breakthrough, so the short-term correction of gold is actually within my expectations, which is why I advocate brave shorting of gold today! However, according to the current retracement range and the fact that gold has been unable to stabilize above 3350, I believe that gold has not fallen to the right level and there is still room for retracement below. So I think gold will continue to pull back to test the 3335-3325 area. If gold retests this area and does not fall below, we can boldly go long on gold in this area.
Once gold rebounds after testing the 3335-3325 area, as liquidity increases, the market may form a strong bullish force to support gold to continue its rebound and continue to the 3380-3390 area, or even the 3400-3410 area.
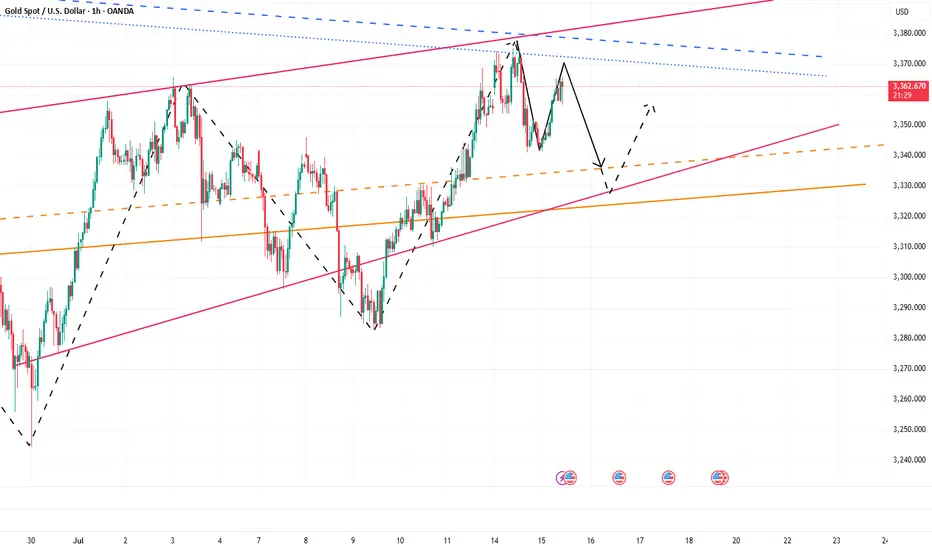
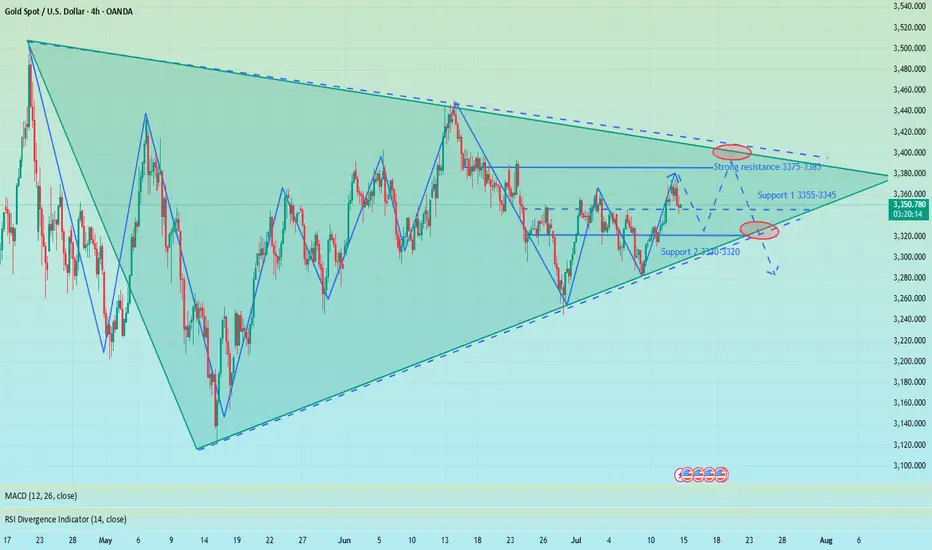
Converging triangle, may rise again in the short termUnder the influence of recent tariffs and the Federal Reserve's interest rate cuts, the main trend of the gold market remains bullish, but from the weekly and monthly level analysis, there is a high probability that it will pull back again after this round of highs and maintain a large range of fluctuations at a high level. Technical analysis shows that gold currently does not have the conditions for a unilateral surge at the daily level. Although the key level of 3345 has been broken, the continuity of the market is extremely poor, and volatility is still the main theme. At present, the trend of gold has formed a converging triangle pattern, and it may rise again in the short term. However, we need to be vigilant that the weekly line may form a high-rise and fall pattern, and the price of gold may fall back to 3300! Therefore, in today's late trading, you can consider retreating to the 3335-3330 area to go long
OANDA:XAUUSD
End-of-Session Market ReviewToday was a solid trading day with some interesting moves across the markets:
S&P 500: The market trended upwards from the open, gradually moving into and above the prior day’s value area, closing near the high of that range.
NASDAQ 100: After some initial back-and-forth, it climbed above the prior day’s high and value area, showing strength into the close.
Russell 2000: This market was quite choppy and balanced for a good part of the session, but eventually pushed up to close near the prior value area high.
Gold: It stayed range-bound, moving between the CVA high and the prior day’s value area without breaking out.
Crude Oil: We saw a significant drop right from the start, with prices falling about 1.5 points and ending the day lower, though still within the prior day’s range.
Euro Dollar: It tested the CVA low, dipped below the prior day’s low, and then bounced back to close around that level.
Yen Dollar: It started near the prior value area low, accepted below it by midday, and remained balanced in that lower range.
Aussie Dollar: Initially, it held above the CVA area and tested a higher level before sharply dropping below the prior day’s low and then balancing in that lower area.
In total, I took eight trades today. Two of them were in the Yen, both valid setups that didn’t work out and ended in stop-outs. I also took some long trades in the Aussie Dollar that I probably could have avoided since the market was choppy.
On the positive side, I managed risk well and ended up with two winning trades that put me in the green by about $1,200. Overall, I’d rate today as an A- day. Moving forward, I’ll focus on staying out of choppy markets, paying attention to the developing value area, and possibly using Heikin Ashi bars for better clarity.
