DOW JONES INDEX (US30): Classic Gap Trade
I see a gap down opening on US30 index.
As always, there is a high chance that this gap is going to be filled.
A bullish imbalance candle and a local change of character CHoCH
indicate a highly probable rise to a gap opening level.
Target - 44300
❤️Please, support my work with like, thank you!❤️
I am part of Trade Nation's Influencer program and receive a monthly fee for using their TradingView charts in my analysis.
Candlestick Analysis

AUDUSD: Pullback From Support 🇦🇺🇺🇸
There is a high chance to see a pullback from the underlined
key horizontal support on AUDUSD.
As a confirmation, I see a bullish imbalance candle on an hourly time frame.
Goal - 0.658
❤️Please, support my work with like, thank you!❤️
I am part of Trade Nation's Influencer program and receive a monthly fee for using their TradingView charts in my analysis.

GBPUSD SELL After seeing the previous weekly candle close bearish and the daily trading below the moving average and 4hr structure pointing to the down side we could see a continuation of the move to the downside into next areas of weekly support

EURJPY ANALYSIS After seeing the previous weekly candle close bullish and the past few weeks pushing to the upside we could expect the momentum to continue into weekly highs of 175.000

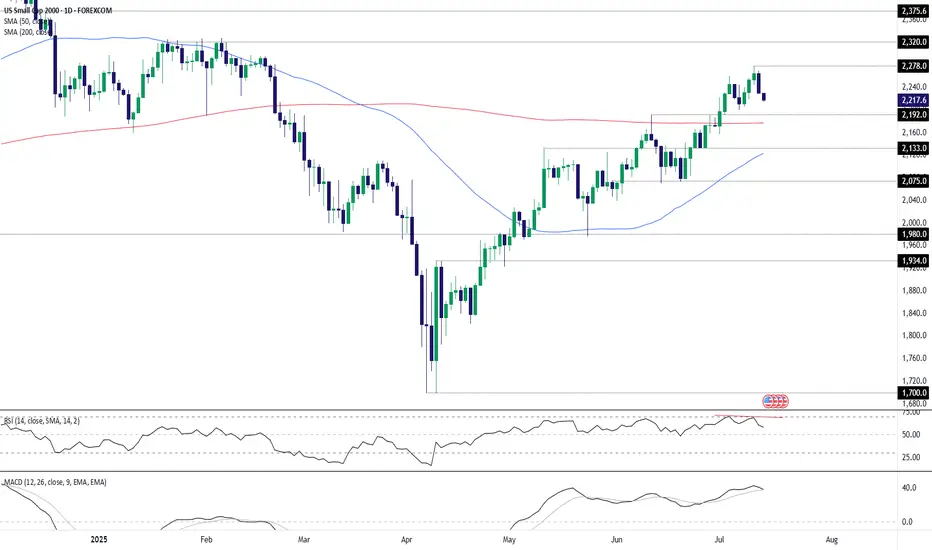
US Small Caps: Evening star pattern flags reversal riskThe U.S. Small Cap contract often generates reliable reversal signals, meaning the three-candle evening star pattern completed Friday should be of interest to traders, especially with bullish price momentum also showing signs of rolling over.
Should the price push back towards Monday’s opening level, shorts could be established beneath the level with a stop above for protection. 2192 looms as an initial target, having acted as both support and resistance in the recent past, although the 200-day moving average found at 2176.7 screens as a more appealing target given its importance for longer-term directional moves in the past.
If the price were to close beneath the 200DMA, it may act as a catalyst to spark a deeper unwind towards 2133 or 2075.
Good luck!
DS
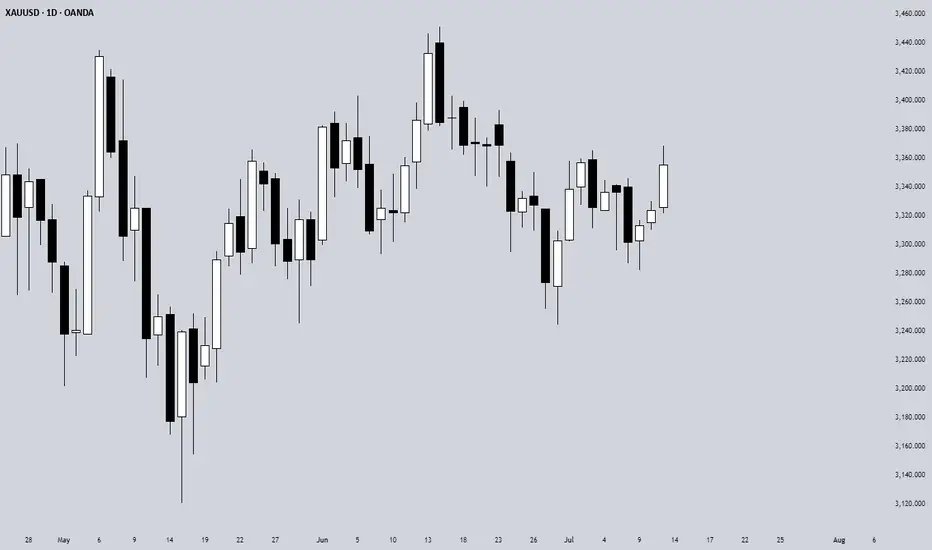
Gold trend forecast for next week, continue to go longAfter the gold broke through on Friday, we started to turn long, and gold rose strongly. Gold finally rose as expected, and the gold bulls are still strong. If there is no major change in the news over the weekend, the decline next week will not be large, and we can continue to buy. The gold 1-hour moving average continues to cross upward and the bulls are arranged and diverge. The strength of gold bulls is still there, and the gold moving average support has also moved up to around 3330. After gold broke through 3330 yesterday, gold fell back to 3330 and stabilized and rose twice. The short-term gold 3330 has formed a strong support. Gold will continue to buy on dips when it falls back to 3330 next week.

The impact of tariffs continues, shorting is expected to retrace📰 News information:
1. Focus on tomorrow's CPI data
2. Bowman's speech at the Federal Reserve
3. Tariff information outflows and countries' responses to tariff issues
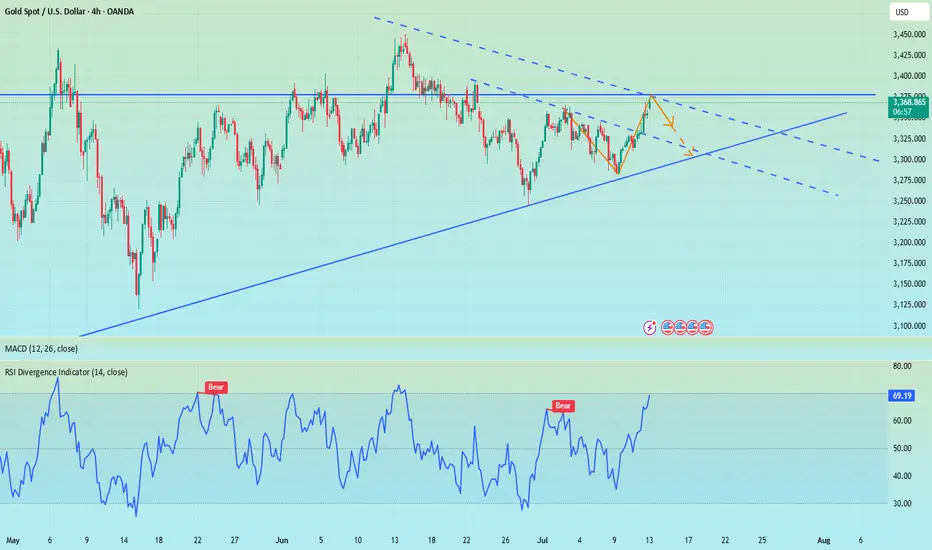
📈 Technical Analysis:
During the weekend, the Trump administration's tariff information continued to come out, causing a large amount of funds to flow into the safe-haven market, triggering an escalation of market risk aversion. Although the collapse in the previous tariff remarks did hit the market's buying enthusiasm to a certain extent, the strong rise on Friday also stimulated the market's buying enthusiasm again. This, whether it is on the way down or on the way up, has attracted retail investors to a certain extent. As we judged on gold on Friday and the weekend, short-term bulls are undoubtedly strong. However, I think it is very dangerous to continue to chase long positions at high levels. Therefore, I tend to short-term and then consider continuing to chase long positions after the market retreats to the support level.
First of all, the CPI data will be released tomorrow. With inflation in the United States currently heating up, the Federal Reserve is undoubtedly resisting a rate cut in July. This has, to some extent, dampened the enthusiasm of bulls. Secondly, it is necessary to pay attention to the response of Europe and Japan to the tariff issue. Due to the timeliness, the current market expectations are undoubtedly limited.
In the short term, the RSI indicator is already seriously overbought. For today's operation arrangement, it is recommended to short at the rebound of 3365-3375. If the gold price continues to maintain a strong trend in the short term and breaks through this resistance area, it is time to stop loss. First of all, we should pay attention to whether 3355-3345 can be broken. Once it falls below the support of 3355-3345, we will need to see the 3330 line below, and it may even fall below 3300. Therefore, we also need to take precautions and follow up.
🎯 Trading Points:
SELL 3365-3375
TP 3355-3345
In addition to investment, life also includes poetry, distant places, and Allen. Facing the market is actually facing yourself, correcting your shortcomings, facing your mistakes, and exercising strict self-discipline. I share free trading strategies and analysis ideas every day for reference by brothers. I hope my analysis can help you.
FXOPEN:XAUUSD TVC:GOLD FX:XAUUSD FOREXCOM:XAUUSD PEPPERSTONE:XAUUSD OANDA:XAUUSD
USDJPY: Bullish Continuation After Breakout📈 USDJPY is set to increase further in price after breaking through a significant daily/intraday horizontal resistance.
The next target is 147.81.

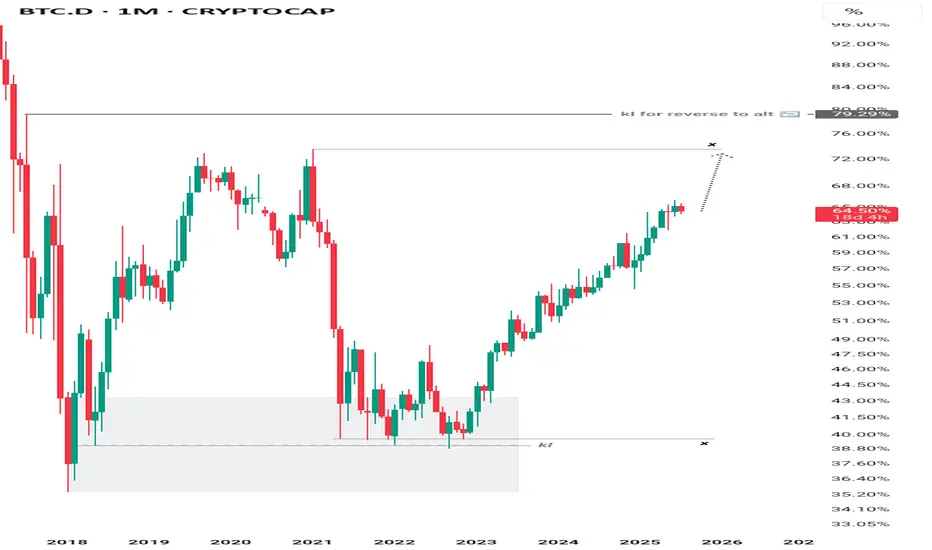
BTC Dominance Maintains UptrendBTC dominance continues its climb toward the 73% region, with no significant signs of altcoin capital rotation at this stage. Market structure remains intact in favor of Bitcoin leadership.
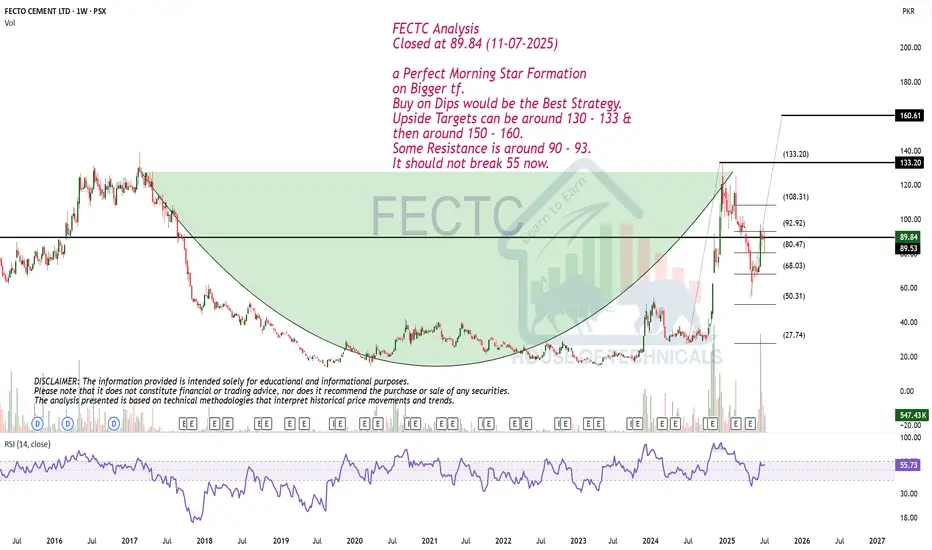
a Perfect Morning Star Formation on Bigger tf.FECTC Analysis
Closed at 89.84 (11-07-2025)
a Perfect Morning Star Formation
on Bigger tf.
Buy on Dips would be the Best Strategy.
Upside Targets can be around 130 - 133 &
then around 150 - 160.
Some Resistance is around 90 - 93.
It should not break 55 now.

Dreamcoinswow is a daily bouncethe last four days's low of the day have been higher than the previous day.
This weekly sesion broke the high of the last week but its still struggling to close above.
The 4 hour timeframe is a uptrend maintaining its 12 ema as support.

Learning#02 : Fractals⛰️ Learning#02 : Fractals
The Cleanest Clue on a Cluttered Chart
If you like clean charts and smart price behaviour, Fractals are one of those tools that give subtle but powerful signals. They’re not magic. They simply reflect what price is telling you—if you’re willing to listen.
Let’s unpack the concept and learn how to use Fractals like a pro.
🔍 What Is a Fractal in Trading?
In technical analysis, a Fractal is a five-candle pattern that marks a local top or bottom in price. It’s a pure price-action signal that doesn’t rely on lagging indicators.
There are two types of Fractals:
Bearish Fractal (Top): The 3rd candle has the highest high, surrounded by two lower highs on each side.
Bullish Fractal (Bottom): The 3rd candle has the lowest low, flanked by two higher lows on each side.
These formations are Price's way of saying: *"I tried to go further, but couldn't."
📊 What Do Fractals Indicate?
A shift in short-term control (bulls vs. bears)
Minor support or resistance zones
Useful markers for entries, exits, or trailing stop levels
They don't guarantee reversals but are excellent at highlighting where price momentum may pause, reverse, or build structure.
📈 How to Use Fractals – A Practical Guide
Let’s be clear: Fractals are not trade signals by themselves.
Instead, they work best when used in confluence with your strategy. Think of them as tools that:
Help confirm breakout levels
Refine pullback entries
Guide you in drawing cleaner trendlines, fib zones, and support/resistance levels
Assist in identifying swing highs and lows for Dow Theory-style trend analysis
🔗 Fractals + Strategy = Smart Trading
Whether you trade breakouts or mean reversion, Fractals help clarify:
Which highs or lows matter
Where to place stop losses with structure-based logic
How to trail SL as the trade progresses
They quietly organize your chart into readable, tradeable levels.
🚀 Practical Uses of Fractals
Fractals are the first tool I add to any chart—they instantly reveal structure and guide every step of my analysis.
1. Breakout Confirmation
Wait for a candle to close above a bullish fractal high or below a bearish fractal low.
Useful when the market is trending or forming structures like double bottoms/tops.
2. Pullback with Confirmation
Use the fractal zone as a short-term S/R level. If price returns and shows signs of rejection (like an inside bar, wick rejections, or low volume), consider entries based on confirmation.
Great in sideways or swing environments.
3. Trend Structure Validation
Fractals reveal clear pivot highs/lows, helping:
Confirm higher highs/higher lows
Mark structure for trendline drawing
Validate Fib levels or S/R zones
4. Trailing Stop Loss
Update your SL to trail behind the most recent opposite-side fractals.
In longs: SL below new bullish fractals
In shorts: SL above new bearish fractals
This lets you stay in the move while managing risk like a pro.
How it’s Look Like on Chart
snapshot
⚠️ Common Mistakes to Avoid
Trading every fractal blindly
Ignoring price context or trend
Relying on fractals in low-volume, choppy markets
📝 Final Thoughts
Fractals are like breadcrumbs left by price action. They quietly point to areas where the market faced resistance or found support. Alone, they’re not enough. But in the hands of a price-action trader, they’re incredibly useful.
Used alongside market structure, confirmation signals, and clean charting habits, Fractals become:
Trend identifiers
Entry enhancers
Stop loss trail markers
⭐ Bonus Tip
Next time you mark a level, Fibonacci or draw a trendline, check if a Fractal confirms it. You’ll be surprised how often it does.
Trade simple. Trade clean.
— Kiran Zatakia

Nifty Analysis EOD – July 11, 2025 – Friday🟢 Nifty Analysis EOD – July 11, 2025 – Friday 🔴
"Smooth Slide, Silent Pressure – Bulls on the Edge"
Nifty opened with a 60-point gap-down, and despite an initial attempt to fill the gap with a 40-point bounce, the index couldn’t sustain. What followed was classic, smooth selling pressure — a slow bleed marked by 16 consecutive 5-minute candles that never broke the previous candle’s high.
There was no panic, just a persistent drift downward. The day’s structure was a silent yet firm rejection from higher levels, with 25,150 acting as an anchor for most of the session, eventually closing near 25,140.
📉 This session marks a revisit to the breakout zone of June 26–27.
Is this a false breakout or a healthy retest?
Only time — and a bounce or breakdown from 25,080–25,060 — will tell.
⚠️ If we close below 25,000, the entire bullish move from late June might be invalidated.
But a sharp bounce from the 25080–25060 zone could spark a hopeful reversal setup.
🕯 5 Min Time Frame Chart with Intraday Levels
🕯 Daily Time Frame Chart with Intraday Levels
🕯 Daily Candle Breakdown
Open: 25,255.50
High: 25,322.45
Low: 25,129.00
Close: 25,149.85
Change: −205.40 (−0.81%)
📊 Candle Structure Breakdown
Real Body: 105.65 points – clean bearish body
Upper Wick: 66.95 points – buyers rejected
Lower Wick: 20.85 points – weak defense at bottom
🔍 Interpretation
Price opened weak and stayed weak.
An intraday push to 25,320 was sharply sold into.
Closing near the day’s low shows full bear control.
Minimal bounce from day low indicates lack of bullish confidence.
🕯 Candle Type
A Bearish Rejection Candle – resembles an inverted hammer in a downtrend; suggests sellers still strong and bulls hesitant
📌 Key Insight
The zone of 25,320–25,350 has turned into firm intraday resistance.
25,100–25,130 is the immediate make-or-break support — below that lies 25,000–25,050.
For bulls to breathe again, we need a bounce and hold above 25,250–25,300.
🛡 5 Min Intraday Chart
⚔️ Gladiator Strategy Update
ATR: 193.17
IB Range: 78.45 → Medium IB
Market Structure: 🔴 Imbalanced
Trades Triggered
10:21 AM – Short Trade → 🎯 Trailing SL Hit (R:R 1:2.41)
📌 Support & Resistance Zones
Resistance Levels
25,168
25,180 ~ 25,212
25,260
25,295 ~ 25,315
Support Levels
25,125
25,080 ~ 25,060
25,000 ~ 24,980
24,965
💭 Final Thoughts
"It wasn’t a crash, it was a quiet rejection — and that makes it more dangerous. If bulls don’t show up now, bears might get bolder from here."
✏️ Disclaimer
This is just my personal viewpoint. Always consult your financial advisor before taking any action.

USDJPY: More Growth Ahead! 🇺🇸🇯🇵
USDJPY broke and closed above a minor daily resistance
with a confirmed BoS.
The next strong resistance is 148.0
It is going to be the next goal for bulls.
❤️Please, support my work with like, thank you!❤️
I am part of Trade Nation's Influencer program and receive a monthly fee for using their TradingView charts in my analysis.

The 3-Method Framework: Simplifying Technical AnalysisMost traders get caught up in complex indicator setups, thinking that more tools equal better results. We rely on moving averages to tell us if prices are trending up or down, and we depend on support and resistance levels to predict market movement. But what if I told you there's a simpler, more powerful way to read the market using pure price action?
Today, I want to share my experience and understanding of bias and expectations for the next candle formation. This approach is refreshingly simple because we don't need to understand every single price movement - we just need to focus on what matters most.
Method 1: Opening Price Comparison
The first method is beautifully straightforward. For a bullish bias, the current opening price should be above the previous opening price. That's it. Sounds almost too simple, right? But simplicity often holds the greatest power in trading.
For Gold yesterday, we simply needed to compare the latest opening price on the Daily timeframe with the previous opening price. It's that simple.
Method 2: Mid-Level Analysis
The second approach involves comparing mid-levels between candles. We compare the mid-level of the previous candle with the mid-level of the candle before that. I know it might sound a bit complicated when explained this way, but once you visualize it on your chart, the concept becomes crystal clear.
Still on Gold, we just compare the 50% or mid-level of the previous candle with the candle two periods back from the latest candle on the daily chart.
Method 3: Expansion Expectations
The third method helps us anticipate expansion in price. Traditional complex methods require analyzing numerous factors, but this simplified approach only needs two candles before the current one. Here's how it works: we use the high and low of the candle two periods back, and the open and close (body) of the previous candle. If the previous candle's body sits within the high-low range of the two-candle-back formation, we can expect price expansion.
The beauty of this method is that we don't care whether the price is bullish or bearish - we simply expect expansion to occur. Think of it like a compressed spring: when price gets squeezed within a previous range, it often seeks to break out in either direction. We're not predicting the direction, just the likelihood of significant movement.
Still on Gold, I randomly selected all inside candles on the Daily timeframe. Remember, the purpose is only to expect expansion, not direction. If you want to use this for directional bias, make sure you apply the additional analysis required.
Remember, there are no guarantees in trading, but this method provides valuable insight into potential market expansion.
Advanced Combinations for Enhanced Analysis
Combining Methods 1 and 2 creates our most accessible approach since you only need two candles. When both the opening price and mid-point from two candles ago indicate bullish conditions, we can expect the current candle to follow an OLHC bullish pattern.
You can see the 3 examples I've provided in the image, and all of these are applicable across all timeframes, both daily and 4-hour.
Combining all three methods offers a more sophisticated analysis, particularly useful for anticipating market reversals. This involves marking the current and previous opening prices, comparing mid-levels from the last two candles, and identifying the high/low range from two to three candles back.
Now I'm adding Inside Candles from 2-3 periods back (My personal rule is maximum 3 candles before the current candle, or this analysis will lead to analysis paralysis).
The Bullish and Bearish Rules
Bullish Rule 1:
Opening price above the previous opening price
Mid-level of the previous candle above the mid-level of the previous candle before that.
Inside candle formation (optional)
Bearish Rule 1:
Opening price below the previous opening price
Mid-level of the previous candle below the mid-level of the previous candle before that.
Inside candle formation (optional)
The Secret Sauce: Timeframe Harmony
Here's where the "devil is in the details" comes into play. You might find perfect bullish conditions on your chart, but the market still reverses. The secret lies in using this method on Daily and 4-hour timeframes simultaneously.
Simply understand it from the chart.
Simply understand it from the chart.
If Rule 1 conditions are met on the daily chart, they must also align on the 4-hour chart. When the 4-hour contradicts the daily, follow the 4-hour signal as it might indicate a "sell on strength" or "buy on weakness" scenario.
The formula is simple: must align with
I've never tested this on 1-hour charts because the Daily and 4-hour combination provides sufficient accuracy for my trading approach.
Enhanced Rules for Precision
Rule 2 makes the inside candle formation mandatory rather than optional. Sometimes you'll encounter mixed signals where the mid-level suggests one direction while the opening price suggests another. The solution? Drop down to a lower timeframe for additional confirmation.
I don't recommend using this method below the 4-hour timeframe, but you can certainly apply it to Monthly or Weekly charts for long-term bias determination. The key is analyzing both Daily AND 4-hour timeframes together, not just one or the other.
When timeframes conflict, often just one key level provides the confirmation you need - typically a previous Monthly or Weekly high or low.
Final Thoughts
Pure price action mastery isn't about having the most sophisticated setup or the most indicators on your chart. It's about understanding the fundamental relationship between opening prices, mid-levels, and candle formations across meaningful timeframes.
This approach has served me well because it cuts through market noise and focuses on what price is actually telling us. Start with these three methods, practice identifying the patterns, and gradually build your confidence in reading pure price action.
Remember, consistent profitability comes from mastering simple, reliable methods rather than chasing complex strategies. Keep practicing, stay disciplined, and let price action guide your trading decisions.
Good Luck! :)
OIL IDEA /30 06 25So we are looking for this Short position, but first we need a better Premium position

POPCAT IDEA 29/06/25Any retracement to the 1D FVG could be a nice entry if you are not in yet
Let´s see how it respond to Premium Zone and we could expect go for mayor liquidity

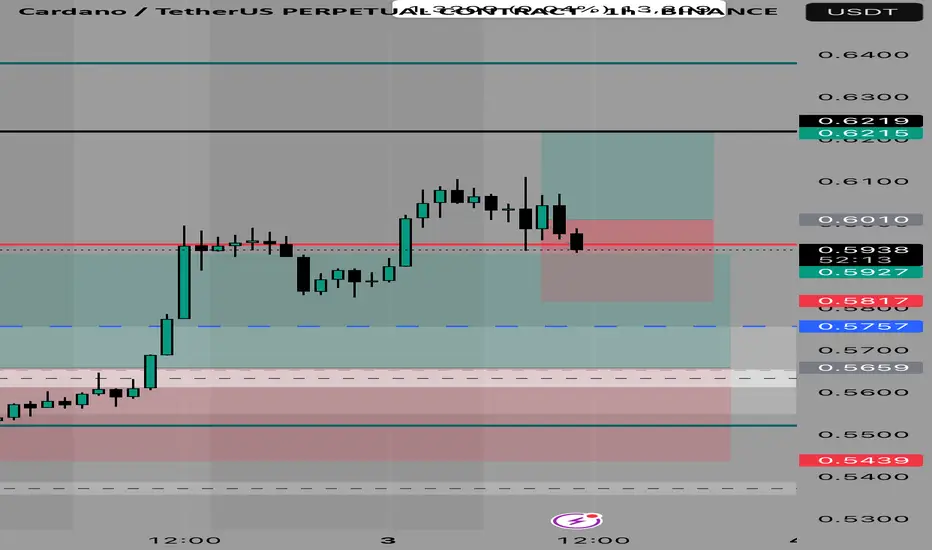
ADA idea 03 07 25Grids can it’s a great way to deal with volatility and timming within a range with clear PD Arrays

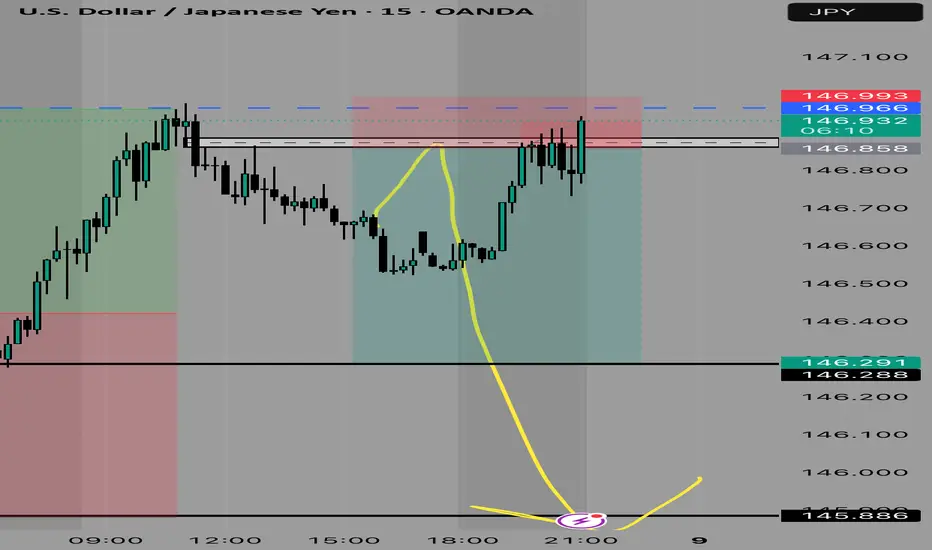
USDJPY IDEA 08/07/25So we are looking for a Discount Zone with this one. Since we are in a Premium PD Array, we are expecting a short term reversal
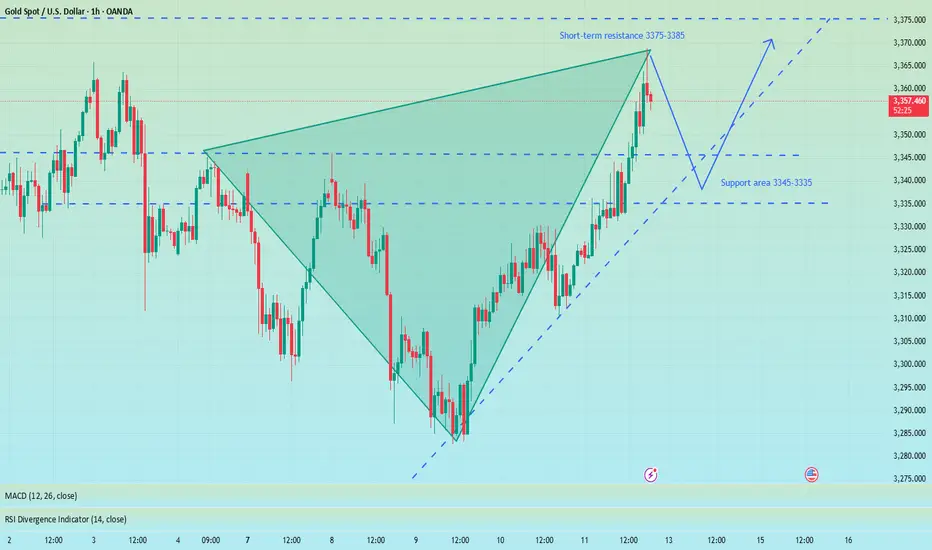
Precisely look at 3365 and pay attention to the pullback chanceAt present, gold has risen as expected and reached the highest level near 3368. The upper 3375-3385 constitutes a short-term resistance level. At present, the bullish momentum is still relatively strong, and the short-term support structure below has been formed. I still maintain the views of the previous transaction and wait for a second trading opportunity when it pulls back below. Although the 1H chart shows that the current trend remains strong and the retracement is small, it is necessary to remain cautious - even if the market is strong, it is not recommended to chase long easily, and the risk of a deep correction in the gold price must be guarded against. First, pay attention to the support area of 3345-3335 below. If it falls back to this level, you can consider going long with a light position.
OANDA:XAUUSD
Continue to try to find the top of the band to short goldGold maintained a slow and volatile rise structure during the day. The highest has reached 3348, and it is only a step away from 3350. Will gold continue its upward momentum as usual?
In fact, it was beyond my expectation that gold could break through 3345 in the short term. According to my original expectation, the intraday high of gold was almost around 3345. Although the rebound of gold exceeded expectations, it is currently located near the resistance of 3348-3350, so I will definitely not give priority to chasing gold at high levels in short-term transactions.
Moreover, gold is currently in the resistance area of 3348-3350. The volatility of gold has converged, and the upward momentum has declined. As gold continues to rebound and faces the key resistance area again, the bulls are relatively more cautious. In this context, this resistance area may act as a catalyst, and the bears will react, leading the decline in gold. However, as gold rebounds and the support below gradually stabilizes, we can appropriately reduce the expectation of gold's decline and adjust the decline target to the 3330-3320 area.
So for short-term trading, I will still short gold based on the resistance area, trying to find a swing top in the 3340-3350 area, and look at the target area of 3330-3320.
