ETH BEARISH AT RESISTANCE ETH rejecting daily resistance, likely price will look to find supports at zones marked below
DYOR
Candlestick Analysis

BTC Bearish at 1DBTC printing bearish engulfing candlestick pattern on 1D, rejecting previous resistance
we are likely going to see price test 98k, 92k and worst scenario 86k
DYOR

strong RSI, strong VOLUME, strong PRICE ACTIONthe banknifty is nbear life high. this stock is eyeing a multimonth, breAKOUT .
RSI: ABOVE 70 strong
volume: huge spike
price action: strong uptrend
the above could lead to strong follow up

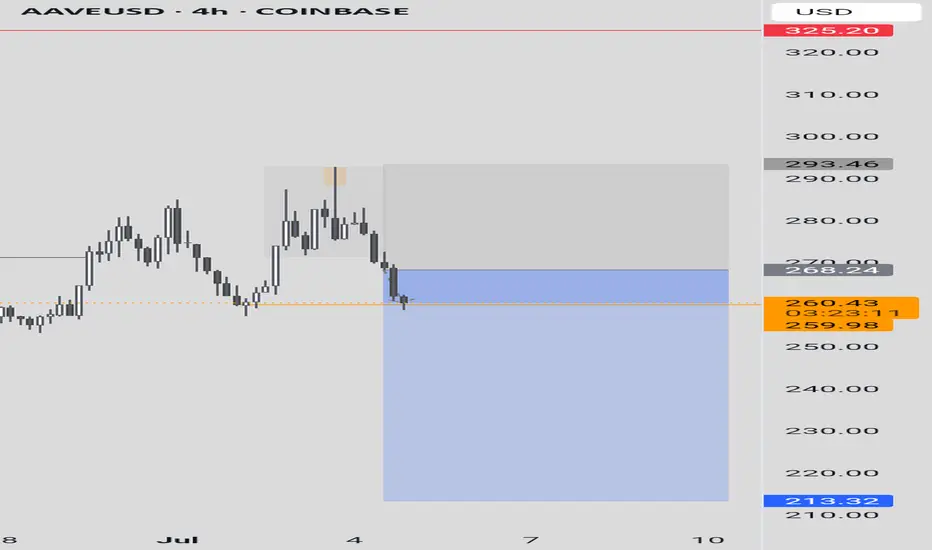
AAVEUSDT Cryptocurrency Futures Market Disclaimer 🚨🚨🚨
Trading cryptocurrency futures involves high risks and is not suitable for all investors.
Cryptocurrency prices are highly volatile, which can lead to significant gains or losses in a short period.
Before engaging in crypto futures trading, consider your risk tolerance, experience, and financial situation.
Risk of Loss: You may lose more than your initial capital due to the leveraged nature of futures. You are fully responsible for any losses incurred.
Market Volatility: Crypto prices can fluctuate significantly due to factors such as market sentiment, regulations, or unforeseen events.
Leverage Risk: The use of leverage can amplify profits but also increases the risk of total loss.
Regulatory Uncertainty: Regulations related to cryptocurrencies vary by jurisdiction and may change, affecting the value or legality of trading.
Technical Risks: Platform disruptions, hacking, or technical issues may result in losses.
This information is not financial, investment, or trading advice. Consult a professional financial advisor before making decisions. We are not liable for any losses or damages arising from cryptocurrency futures trading.
Note: Ensure compliance with local regulations regarding cryptocurrency trading in your region.
thanks for like and follow @ydnldn to have more information outlook and free signal.
About me :
"I am a passionate swing trader focused on analyzing financial markets to capture profit opportunities from medium-term price movements. With a disciplined approach and in-depth technical analysis, I concentrate on identifying trends, support-resistance levels, and price patterns to make informed trading decisions. I prioritize strict risk management to protect capital while maximizing profit potential. Always learning and adapting to market dynamics, I enjoy the process of refining strategies to achieve consistency in trading."
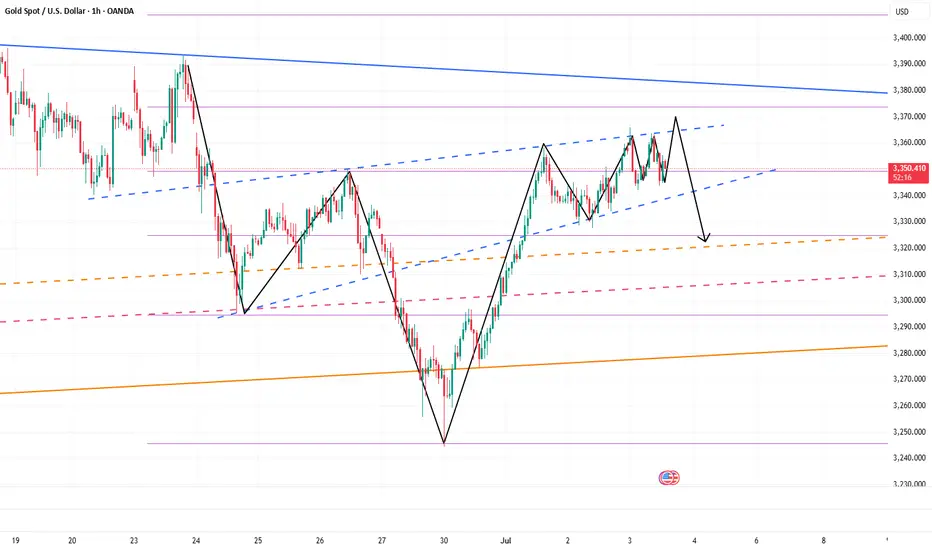
Go short before breaking 3350, go long before falling to 3320📰 News information:
1. Geopolitical situation
2. Tariff implementation and interest rate cut bill
📈 Technical Analysis:
As I said, the US stock market closed early today, and the market will lack some momentum. It is difficult to have a large fluctuation. It is expected to fluctuate and consolidate. I also explained in the previous post that the upper pressure in the short term is at 3340-3350. If it is touched, we can try to short and defend 3360. If it falls back to 3323, we can try to go long for the first time. If it continues to fall, it is expected to reach 3315-3305. Therefore, if it first touches 3323, go long, SL 3316, and consider going long if it touches 15-05 below.
🎯 Trading Points:
SELL 3340-33350
TP 3330-3320-3310-3300
BUY 3323
TP 3333-3340-3350
BUY 3315-3305
TP 3325-3333-3340
In addition to investment, life also includes poetry, distant places, and Allen. Facing the market is actually facing yourself, correcting your shortcomings, confronting your mistakes, and strictly disciplining yourself. I hope my analysis can help you🌐.
TVC:GOLD OANDA:XAUUSD FX:XAUUSD FOREXCOM:XAUUSD PEPPERSTONE:XAUUSD FXOPEN:XAUUSD

SOLUSDT Holding Long Term Trendline SupportSOLUSDT continues to show strong bullish structure, with price consistently holding above a multi-year ascending trendline a key structural element that has defined its uptrend. This dynamic support has anchored price action within a broader ascending formation, reflecting steady long-term accumulation.
Additionally, the chart reveals a well defined Cup and Handle formation, further reinforcing the bullish outlook. As long as price respects the immediate demand zone, this area remains a prime region for re-accumulation, with expectations for it to hold as a firm support level.
The projected target for this setup is clearly illustrated on the chart, aligning with the broader bullish continuation narrative.
Share your view, do you see SOLUSDT pushing higher from here, or is a deeper retest likely before the breakout?

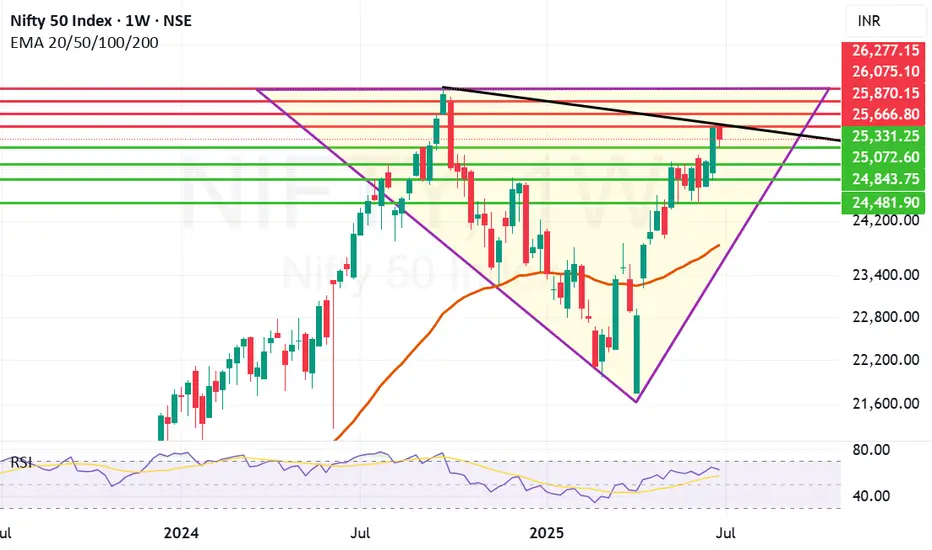
Good Closing by Nifty: Trump Tariff decision awaits us next weekNifty closed the week at 25461 well after gaining 130 points from Friday low of 25331. Overall Nifty closed 55 point positive from Thursday closing. This was a very smart recovery of Nifty from the lows of the day but we are heading towards Trump Tariff deadline of 9th July. That has potential to shake the market and move it any direction so investors should keep an eye on the developments and keep their stop losses and trailing stop losses in place. Overall Nifty is on the path to V shaped recovery as indicated in the chart. If everything works out in favour of India in the negotiation the 816 point gap from previous all time high will be bridged sooner than later. Once we reach the Previous All-time high the recovery will be complete. But we have to be cautiously optimistic.
Nifty supports currently remain at: 25331, 25072, 24843, 24481. If 24481 is broken than Bears will try to drag Nifty towards 23840 (Which is the Mother line of Weekly Chart).
Nifty Resistances currently remain at: 25666 (Trend line Resistance), 25870, 26075, 26277 (Previous All time high).
Disclaimer: The above information is provided for educational purpose, analysis and paper trading only. Please don't treat this as a buy or sell recommendation for the stock or index. The Techno-Funda analysis is based on data that is more than 3 months old. Supports and Resistances are determined by historic past peaks and Valley in the chart. Many other indicators and patterns like EMA, RSI, MACD, Volumes, Fibonacci, parallel channel etc. use historic data which is 3 months or older cyclical points. There is no guarantee they will work in future as markets are highly volatile and swings in prices are also due to macro and micro factors based on actions taken by the company as well as region and global events. Equity investment is subject to risks. I or my clients or family members might have positions in the stocks that we mention in our educational posts. We will not be responsible for any Profit or loss that may occur due to any financial decision taken based on any data provided in this message. Do consult your investment advisor before taking any financial decisions. Stop losses should be an important part of any investment in equity.
3 PM Market Update _ USDCADWhat happened was that the market reversed into a buy sentiment which i was able to take advantage of by using my strategy!!

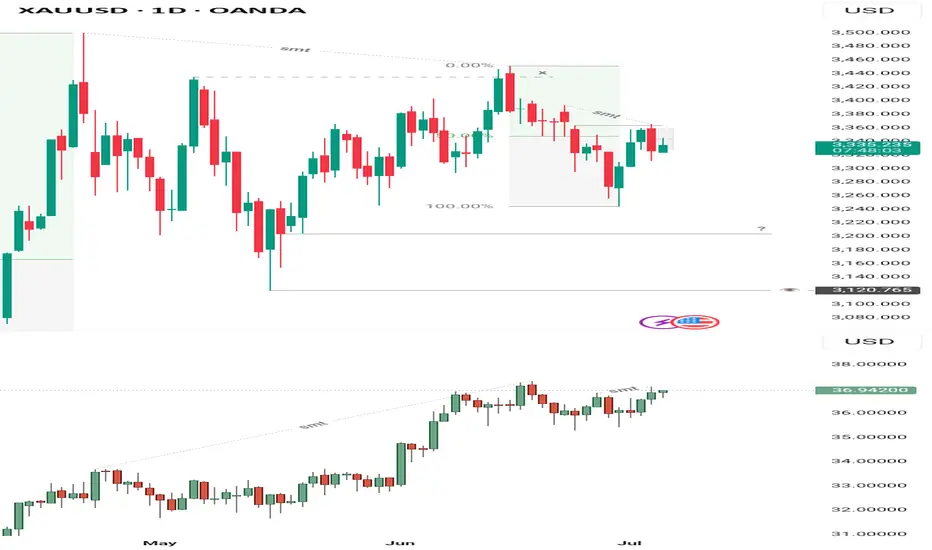
Gold-Silver Discrepancy Analysis – Reevaluation After NFP ReactiAfter taking a loss yesterday, I had to reassess my outlook on Gold. The market behavior leading into and following the NFP event revealed significant discrepancies between Gold and Silver that can’t be ignored.
Since April 24th — the day Gold printed its highest price in human history — the daily chart has shown consistent lower low formations. In contrast, Silver had been forming higher highs on the daily during this same period, showing relative strength.
However, this dynamic began to shift. On the 4-hour chart, Silver is now printing lower lows from last month’s high, aligning more closely with Gold, which has been bearish on both the daily and 4-hour timeframes since its peak.
A key moment occurred just before the NFP release: Silver made a strong run above last week’s high, while Gold failed to even trade above Wednesday’s high — which coincides with the gap fill from last week Tuesday’s open. This divergence in price behavior is crucial.
Gold closed yesterday with a full-bodied bearish engulfing candle, rejecting that same gap area. Meanwhile, Silver’s breakout above last week’s high, despite its internal weakness, is a clear discrepancy of value.
Now, with Silver beginning to shift into lower low structure on the daily and no bullish market structure shift present on the 4-hour chart, the bullish narrative weakens. This divergence between both metals—especially as Silver shows signs of internal breakdown—suggests a high-probability case that the market may be preparing for a broader downside move rather than continuation to the upside.
That said, the key level at 3225/3200, which I marked during my previous bullish outlook, remains on watch. Price reaction at this zone will be critical in determining whether the market still has a chance to reclaim bullish intent or if the short bias continues to play out. If the bearish pressure holds, 3120 becomes a likely target—and a deeper fall toward 2960 wouldn’t be surprising either, considering it aligns with a key discount zone from the weekly timeframe.
Trade Idea For USDCADDon't forget to follow!!
Eurusd on our medium timeframe is CT to the higher timeframe so at this stage we only targeting a fixed 1:5RR.

U.S. stocks are closed, how to operate gold volatility📰 News information:
1. Geopolitical situation
2. Tariff implementation and interest rate cut bill
📈 Technical Analysis:
Gold has maintained a volatile pattern recently, lacking a sustained unilateral trend. The unclear short-term direction of DXY has limited the volatility of gold. The market has repeatedly shown a mixture of high-rise decline and downward recovery. It is unable to effectively break through the previous high and lacks the momentum to break downward. The short-term pressure during the day is concentrated on the 3340-3345 line, and the upper middle track is at 3350. If it fails to effectively break above 3350, then gold may fall further. On the contrary, if it can stand above the middle track 33350, then gold may rise further. The short-term support below is near the 3323 line. If it fluctuates during the day, maintain a high-altitude low-multiple cycle.
🎯 Trading Points:
SELL 3340-3350
TP 3330-3320-3310
BUY 3320-3310
TP 3340-3350
In addition to investment, life also includes poetry, distant places, and Allen. Facing the market is actually facing yourself, correcting your shortcomings, confronting your mistakes, and strictly disciplining yourself. I hope my analysis can help you🌐.
FXOPEN:XAUUSD PEPPERSTONE:XAUUSD FOREXCOM:XAUUSD FX:XAUUSD OANDA:XAUUSD TVC:GOLD

Still short gold before breaking 3355After the release of NFP yesterday, gold began to fall sharply from 3352, reaching a low of around 3312; although it has gradually rebounded above 3340, the time span is not short, so the rebound is not strong; and the double top structure successfully constructed by gold in the 3365-3360 area in the short term still plays a technical suppression role in the short term, greatly weakening the rebound potential; and with the decline of gold yesterday, I think before gold recovers the 3352 starting point, gold will also be under pressure in the 3345-3355 area in the short term. If gold cannot successfully break through this area during the rebound, gold is expected to retest the 3330-3320 area again.
Because of the US Independence Day, the gold market will be closed in advance today. It is expected that gold will not have a breakthrough today, so it may be difficult to break through the 3345-3355 area in the short term, so we can still continue to maintain the trading rhythm of shorting gold in terms of trading.
So I think shorting gold still has a lot of profit potential. We can short gold with 3345-3355 area as resistance and look to the target area: 3335-3325-3315.

SWING IDEA - JK LAKSHMI CEMENT JK Lakshmi Cement , a key player in India’s cement sector under the JK Group showing strong technical confluence making this a swing-worthy setup.
Reasons are listed below :
Formation of a bullish engulfing candle on the weekly chart, indicating a potential trend reversal
Strong support from the 50-week EMA , reinforcing medium-term trend strength
Breakout from a consolidation range that lasted over a year, suggesting renewed momentum
Inverse Head & Shoulders breakout , a classic bullish pattern
Target - 1000
Stoploss - weekly close below 795
DISCLAIMER -
Decisions to buy, sell, hold or trade in securities, commodities and other investments involve risk and are best made based on the advice of qualified financial professionals. Any trading in securities or other investments involves a risk of substantial losses. The practice of "Day Trading" involves particularly high risks and can cause you to lose substantial sums of money. Before undertaking any trading program, you should consult a qualified financial professional. Please consider carefully whether such trading is suitable for you in light of your financial condition and ability to bear financial risks. Under no circumstances shall we be liable for any loss or damage you or anyone else incurs as a result of any trading or investment activity that you or anyone else engages in based on any information or material you receive through TradingView or our services.
@visionary.growth.insights

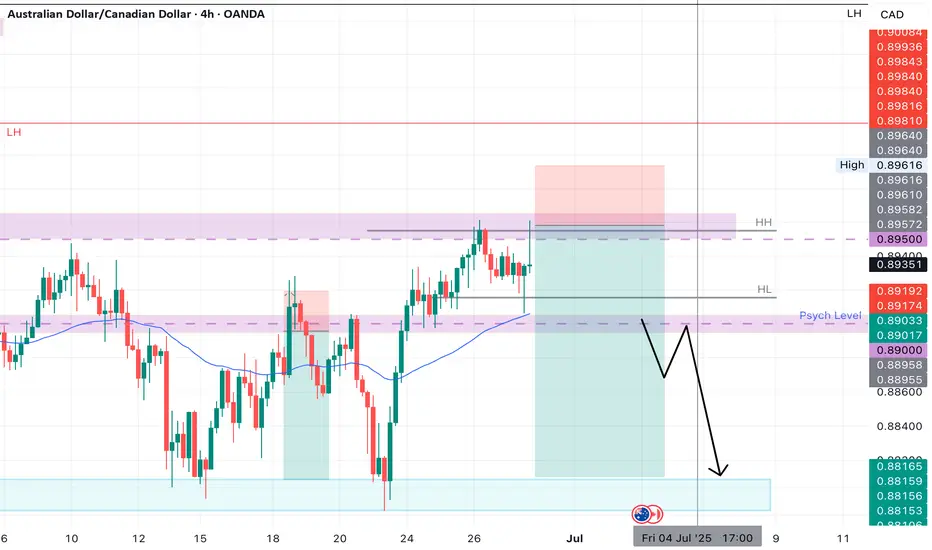
AUDCAD SHORT Market structure bearish on HTFs DW
Entry at both Daily and Weekly AOi
Weekly Rejection At AOi
Previous Weekly Structure Point
Weekly EMA retest
Daily Rejection at AOi
Previous Structure point Daily
Around Psychological Level 0.89500
H4 Candlestick rejection Y
Levels 4,17
Entry 95%
REMEMBER : Trading is a Game Of Probability
: Manage Your Risk
: Be Patient
: Every Moment Is Unique
: Rinse, Wash, Repeat!
: Christ is King.
Will the NFP impact cause the bear market to dominate?📰 News information:
1. Initial jobless claims and NFP data
2. The final decision of the Federal Reserve
📈 Technical Analysis:
In the previous post, I have stated that if the hourly line closes above 3320, gold will fall into high consolidation in the short term. Currently, gold fluctuates narrowly in the short term. I think now we just need to be patient and wait for key points to enter the market. The daily and weekly lines clearly show that the high point of the oscillation range is constantly moving up, and the center of gravity continues to rise. The current market is quietly accumulating momentum, and a new round of weekly and monthly lines are about to rise. Therefore, first of all, I will pay attention to the defensive point below 3320, and then refresh the point below is the previously mentioned 3315-3305. If the point below is touched to get effective support, you can consider going long. Bros who trade independently must strictly set TP and SL to avoid the impact of market fluctuations.
🎯 Trading Points:
BUY 3320-3315-3310
TP 3330-3340-3360
In addition to investment, life also includes poetry, distant places, and Allen. Facing the market is actually facing yourself, correcting your shortcomings, confronting your mistakes, and strictly disciplining yourself. I hope my analysis can help you🌐.
FXOPEN:XAUUSD PEPPERSTONE:XAUUSD FOREXCOM:XAUUSD FX:XAUUSD OANDA:XAUUSD TVC:GOLD

NFP unexpectedly broke out, where will gold go?📰 News information:
1. Initial jobless claims and NFP data
2. The final decision of the Federal Reserve
📈 Technical Analysis:
The unexpectedly negative NFP data caused a sudden plunge in gold prices, which forced me to terminate the transaction urgently. Currently, gold has not fallen below the 3,300 mark. Therefore, I will still pay attention to the closing of the hourly line. If gold closes below 3,320, the downward trend will continue. On the contrary, if it closes above 3,320, gold will consolidate at a high level in the short term. Two days ago, I gave the support level of 3315-3305 below. Please be cautious in trading at the moment.
🎯 Trading Points:
For now, let’s focus on the hourly closing situation
In addition to investment, life also includes poetry, distant places, and Allen. Facing the market is actually facing yourself, correcting your shortcomings, confronting your mistakes, and strictly disciplining yourself. I hope my analysis can help you🌐.
TVC:GOLD OANDA:XAUUSD FX:XAUUSD FOREXCOM:XAUUSD PEPPERSTONE:XAUUSD FXOPEN:XAUUSD

Continue to maintain the rhythm of short tradingUnder the influence of NFP, gold fell sharply as expected. What I had suggested before was proven correct by the market again. "Gold rose in advance to reserve room for the NFP market to fall." After NFP, gold fell to around 3311 and the decline narrowed. Therefore, we accurately seized the opportunity to go long on gold near 3312 and set TP: 3330. Obviously, gold successfully hit TP during the rebound and made an easy profit of 180 pips.
From the current gold structure, gold encountered resistance and retreated twice near 3365, and built a double top structure in the short-term structure. In order to eliminate the suppression of the double top structure, gold still needs to continue to fall after the rebound. After the cliff-like decline of gold, the short-term resistance is in the 3340-3345 area, and the short-term support below is in the 3320-3310 area.
So I think that gold can still continue to short gold after the rebound, and I have already shorted gold around 3336 with the 3340-3345 area as resistance. Now we just need to wait patiently for gold to hit TP. Let us wait and see!

BITCOIN TOUCHED 110K — THEN REJECTEDNot what bulls wanted to see.
With massive gaps below, this kind of price action ain’t it.

Revealed: Beware of a strong counterattack from gold bears!Perhaps due to the impact of the NFP market later, gold fluctuated relatively cautiously today, and neither the long nor the short side showed signs of breakthrough, and the overall trend remained volatile. However, as gold rebounded, the market bullish sentiment gradually tended to be optimistic. In the short term, the lower support area was relatively obvious, that is, the second pull-up point 3335-3325 area, followed by 3315-3305 area;
However, as gold rebounded twice and fell after touching 3365, the suppression above was also obvious. In the short term, it faced the suppression of 3375-3385 resistance. If gold cannot effectively break through this area, gold bears may make a stronger counterattack, so I don’t think gold bears have no chance at all.
Therefore, I think there is still a good profit opportunity to try to touch the top and short gold. You can consider trying to short gold in the 3365-3375-3385 area and look at the target: 3340-3330-3320.
Nifty facing strong resistance between 25587 and 25500. Nifty today again failed to hold levels above 25500 as it made a high of 25587 and closed at 25405. Closing almost 182 point from its high today and 48 points down from yesterday. This is a worrying sign even if just slightly as for moving towards 26K we need a strong closing of the week at least above the Mother line. Nifty closed just below Motherline today which is showing some weakness in the rally which seems to be losing direction. The fear of Tariffs seems to be taking toll on Bulls whereas bears are currently gaining strength. The closing we get tomorrow will indicate a definitive direction to Nifty.
The Supports for Nifty currently remain at: 25385, 25299, 25177 (strong trend line support) and finally we will have Father line support of Hourly candles which is at 25050. Closing 25050 below will have potential to drag Nifty further down towards 24700 which is again a strong Channel bottom support.
The Resistances for Nifty currently remain at: 25416 (Mother line Resistance), 25470, The zone between 25500 and 25587 is a strong Trend line resistance. A closing above 25587 will have potential to take Nifty towards 25603, 25679 or even 25759 (Which is again a strong Channel top resistance).
Disclaimer: The above information is provided for educational purpose, analysis and paper trading only. Please don't treat this as a buy or sell recommendation for the stock or index. The Techno-Funda analysis is based on data that is more than 3 months old. Supports and Resistances are determined by historic past peaks and Valley in the chart. Many other indicators and patterns like EMA, RSI, MACD, Volumes, Fibonacci, parallel channel etc. use historic data which is 3 months or older cyclical points. There is no guarantee they will work in future as markets are highly volatile and swings in prices are also due to macro and micro factors based on actions taken by the company as well as region and global events. Equity investment is subject to risks. I or my clients or family members might have positions in the stocks that we mention in our educational posts. We will not be responsible for any Profit or loss that may occur due to any financial decision taken based on any data provided in this message. Do consult your investment advisor before taking any financial decisions. Stop losses should be an important part of any investment in equity.

GOLD short( RB- ) + Dealing Range + NFP Day ( Volatile )
so yeah pd array rejection block sign of weakness look for short
than wait for dealing rang than look for ur entry type it's on u each trader has an entry type so look to excute targeting SSLQ sell side liquidity simple
Rince repeat follow me on X check my profile

Exact Entry Levels & Profit Potential (July 3, 2025)🎯 Market Structure Breakdown – Exact Entry Levels & Profit Potential (July 3, 2025)
📊 In today’s session, I revisit the market for the second time – and you’ll see why I’m ruling out some setups altogether. There’s value in looking twice. What did I miss earlier? It's all in the structure.
I break down price action step by step, highlight precise entry zones, and show where the real potential for movement lies. Clean levels, no guessing.
⚠️ Note: I don’t trade the first 10 seconds – all orders are placed after 9:30:10 and I'm looking for entries only until 11:30:00.
👉 Check out the full breakdown and stay ahead of the game.
NASDAQ:AMZN
NYSE:ANET
NASDAQ:AVGO
NYSE:BA
NASDAQ:COIN
NASDAQ:CZR
NYSE:DELL
NASDAQ:GOOG
NASDAQ:MSFT
NASDAQ:AMD
NASDAQ:RKLB
NASDAQ:SBUX
NASDAQ:SMCI
NYSE:VRT
NASDAQ:NVDA

US30 buy(low probability because of low volatility)Weekly candle formation: OHLC/OLHC
Structure>liquidity>orderblock!
Bullish structure
Internal liquidity
Orerblock pojnt of interest.
