Gold price rises by more than $100, will the bull run continue?📰 News information:
1. Geopolitical situation
2. PMI data
3. Global Central Bank Governors Meeting
📈 Technical Analysis:
The NY session is about to begin, and there are two things we need to pay attention to. First, the PMI data, and second, the talks between global central bank governors. If Powell again hints that the inflation outlook is weaker than expected, this will increase the Fed's easing bets and trigger a new round of decline in the US dollar. The dovish tone may help gold prices to further rebound. On the contrary, if Powell makes some hawkish or cautious remarks, this may exacerbate the recent downward trend in gold prices. The key point at present is the 3350 mark. If the 4H closing line of the NY session remains below 3350, then in the short term we are expected to continue to retreat to the 3330-3320 range. If the 4H closing line is above 3350 and stabilizes, gold may rebound to the 61.8% position, which is around 3372.
🎯 Trading Points:
SELL 3340-3350-3355
TP 3330-3325-3320
BUY 3330-3320
TP 3340-3350-3372
In addition to investment, life also includes poetry, distant places, and Allen. Facing the market is actually facing yourself, correcting your shortcomings, confronting your mistakes, and strictly disciplining yourself. I hope my analysis can help you🌐.
FX:XAUUSD FXOPEN:XAUUSD PEPPERSTONE:XAUUSD FOREXCOM:XAUUSD FX:XAUUSD OANDA:XAUUSD TVC:GOLD
Candlestick Analysis

SILVER (XAGUSD): Pullback From SupportIt seems that the time has come for 📈SILVER to experience a pullback.
This morning, I've observed a solid intraday bullish signal with the emergence of a head and shoulders pattern on the 4-hour chart.
I anticipate a pullback to at least 36.61, followed by a move to 36.95.

The bull market is too fierce. How to solve the short position?📰 News information:
1. Geopolitical situation
2. PMI data
📈 Technical Analysis:
The conflict between Iran and Israel has stopped for a while, but there is a possibility of it breaking out again. There is a possibility of triggering risk aversion in the short term. From a technical perspective, the 4H MACD indicator shows a golden cross, and the moving average and other indicators are also radiating upward, with a strong bullish signal. The 1H chart Bollinger Bands open upward, and the short-term pressure position is at 3340-3345. The short-term data indicators are seriously overbought, and there may be a profit correction in the short term. Therefore, if you want to short in the short term, you can only consider the 3340-3350 range. In the short term, gold will not usher in a large retracement, and the short-term target is only suitable for looking at 3320-3310. As for the long trading point, it is expected to wait for the European and American trading hours.
🎯 Trading Points:
SELL 3340-3350
TP 3320-3310
BUY 3325-3315
TP 3335-3340-3350
In addition to investment, life also includes poetry, distant places, and Allen. Facing the market is actually facing yourself, correcting your shortcomings, confronting your mistakes, and strictly disciplining yourself. I hope my analysis can help you🌐.
TVC:GOLD OANDA:XAUUSD FOREXCOM:XAUUSD PEPPERSTONE:XAUUSD FXOPEN:XAUUSD FX:XAUUSD

AUDUSD: Bullish Continuation After Breakout 🇦🇺🇺🇸
AUDUSD is going to rise more following a bullish breakout
of a key daily/intraday horizontal resistance.
Next goal - 0.66
❤️Please, support my work with like, thank you!❤️
I am part of Trade Nation's Influencer program and receive a monthly fee for using their TradingView charts in my analysis.

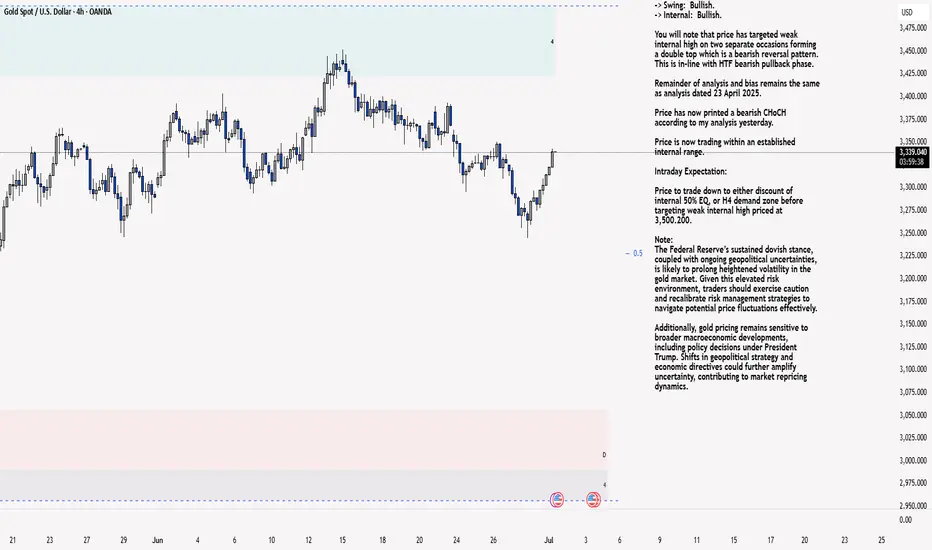
XAU/USD 01 July 2025 Intraday AnalysisH4 Analysis:
-> Swing: Bullish.
-> Internal: Bullish.
You will note that price has targeted weak internal high on two separate occasions forming a double top which is a bearish reversal pattern. This is in-line with HTF bearish pullback phase.
Remainder of analysis and bias remains the same as analysis dated 23 April 2025.
Price has now printed a bearish CHoCH according to my analysis yesterday.
Price is now trading within an established internal range.
Intraday Expectation:
Price to trade down to either discount of internal 50% EQ, or H4 demand zone before targeting weak internal high priced at 3,500.200.
Note:
The Federal Reserve’s sustained dovish stance, coupled with ongoing geopolitical uncertainties, is likely to prolong heightened volatility in the gold market. Given this elevated risk environment, traders should exercise caution and recalibrate risk management strategies to navigate potential price fluctuations effectively.
Additionally, gold pricing remains sensitive to broader macroeconomic developments, including policy decisions under President Trump. Shifts in geopolitical strategy and economic directives could further amplify uncertainty, contributing to market repricing dynamics.
H4 Chart:
M15 Analysis:
-> Swing: Bullish.
-> Internal: Bullish.
H4 Timeframe - Price has failed to target weak internal high, therefore, it would not be unrealistic if price printed a bearish iBOS.
The remainder of my analysis shall remain the same as analysis dated 13 June 2025, apart from target price.
As per my analysis dated 22 May 2025 whereby I mentioned price can be seen to be reacting at discount of 50% EQ on H4 timeframe, therefore, it is a viable alternative that price could potentially print a bullish iBOS on M15 timeframe despite internal structure being bearish.
Price has printed a bullish iBOS followed by a bearish CHoCH, which indicates, but does not confirm, bearish pullback phase initiation. I will however continue to monitor, with respect to depth of pullback.
Intraday Expectation:
Price to continue bearish, react at either M15 supply zone, or discount of 50% internal EQ before targeting weak internal high priced at 3,451.375.
Note:
Gold remains highly volatile amid the Federal Reserve's continued dovish stance, persistent and escalating geopolitical uncertainties. Traders should implement robust risk management strategies and remain vigilant, as price swings may become more pronounced in this elevated volatility environment.
Additionally, President Trump’s recent tariff announcements are expected to further amplify market turbulence, potentially triggering sharp price fluctuations and whipsaws.
M15 Chart:
Gold encounters resistance at 3310-3320 and is about to fallAt present, gold has reached the 3300-3320 area as expected. As I mentioned in my previous article, we can consider shorting gold in batches in the 3300-3320 area;
Although gold once rebounded and stood above 3300, we can clearly see that when facing the short-term resistance area of 3310-3320, the bullish energy of gold has converged and began to show signs of stagflation, so the short-term resistance area of 3310-3320 is still valid.
Before gold breaks through 3310-3320, gold bears still have the upper hand. So as long as gold stays below 3310-3320 in the short term, don't be afraid of gold rebounds. Rebounds are opportunities to short gold. So I still tend to short gold at present, and have opened short gold positions according to the trading plan, hoping that gold can retreat to the target area: 3285-3275-3265. Do you think gold will fall as expected?

Gold (XAUUSD) – July 1 Analysis📍 H4 Key LH Zone: 3348.500 – 3350.500
This is a major decision zone.
Current market structure:
🔸 M15 is in an uptrend with confirmed ChoCh + BoS
What to watch:
We’re approaching the H4 LH supply zone — now we observe how price behaves here.
🔹 If price breaks above this H4 LH zone:
→ HTF and LTF trends align to the upside
→ Potential continuation of the bullish move
🔹 If price respects and stays below this LH zone:
→ Then this recent up-move could be a pullback
→ We may see a new low forming — so be cautious
📍 M15 Zones for Long Setup (if confirmed):
• 3309.500 – 3312.500 (Order Block Zone)
• 3302.500 – 3304.600 (Demand Zone)
We will watch these levels closely.
If price respects these zones and gives M1 confirmation (ChoCh + BoS) — we’ll plan for long entries accordingly.
📖 Let structure guide your decisions. Let price speak first.
📘 Shared by @ChartIsMirror
Author of The Chart Is The Mirror — a structure-first, mindset-grounded book for traders

The latest analysis and layout of gold in July made a good start📰 News information:
1. Geopolitical situation
2. PMI data
📈 Technical Analysis:
Yesterday, we gave the idea of looking at the upper resistance of 3310-3320. The 4H pressure is still at 3327. As long as this key resistance level is not effectively broken, gold will fall again. On the contrary, if it stabilizes above 3327, the trend may reverse. In the short term, pay attention to the upper resistance of 3327. If it is not broken, you can short with a light position. If it falls below 3300-3290, consider going long.
🎯 Trading Points:
SELL 3310-3320
TP 3305-3300
BUY 3300-3290
TP 3310-3320-3350
In addition to investment, life also includes poetry, distant places, and Allen. Facing the market is actually facing yourself, correcting your shortcomings, confronting your mistakes, and strictly disciplining yourself. I hope my analysis can help you🌐.
TVC:GOLD FXOPEN:XAUUSD PEPPERSTONE:XAUUSD FOREXCOM:XAUUSD OANDA:XAUUSD TVC:GOLD

The limit is 3320. Rebound and still short📰 News information:
1. Gold market liquidity at the end of the month
2. Impact of geopolitical situation
📈 Technical Analysis:
Currently, gold has rebounded to around 3295, reaching our ideal trading area. I have given the short-selling trading idea in the previous post. At present, in the short term, we still maintain the short-selling trading idea before effectively breaking through the upper resistance. Focus on the 3325 line of resistance
🎯 Trading Points:
SELL 3295-3310-3320
TP 3285-3270
In addition to investment, life also includes poetry, distant places, and Allen. Facing the market is actually facing yourself, correcting your shortcomings, confronting your mistakes, and strictly disciplining yourself. I hope my analysis can help you🌐.
OANDA:XAUUSD FOREXCOM:XAUUSD FX:XAUUSD PEPPERSTONE:XAUUSD FXOPEN:XAUUSD TVC:GOLD

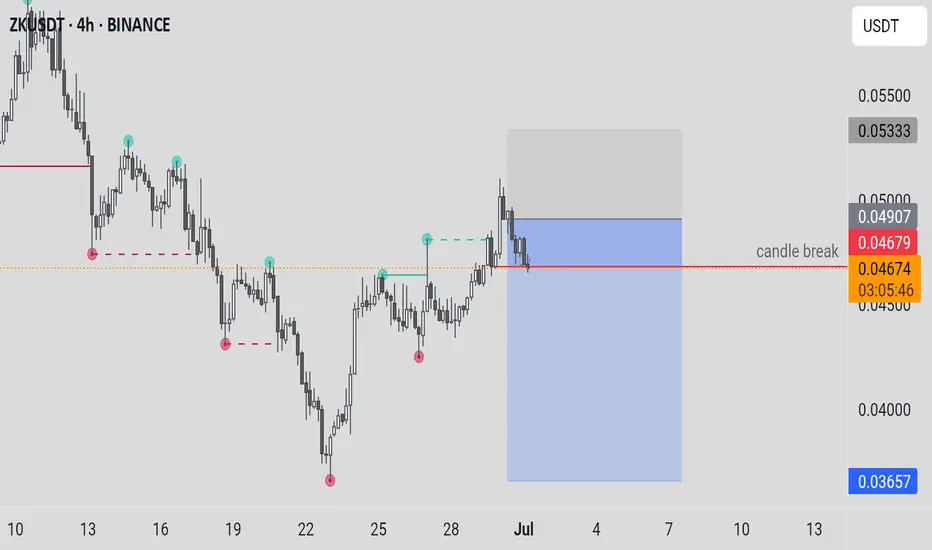
ZKUSDTCryptocurrency Futures Market Disclaimer 🚨🚨🚨
Trading cryptocurrency futures involves high risks and is not suitable for all investors.
Cryptocurrency prices are highly volatile, which can lead to significant gains or losses in a short period.
Before engaging in crypto futures trading, consider your risk tolerance, experience, and financial situation.
Risk of Loss: You may lose more than your initial capital due to the leveraged nature of futures. You are fully responsible for any losses incurred.
Market Volatility: Crypto prices can fluctuate significantly due to factors such as market sentiment, regulations, or unforeseen events.
Leverage Risk: The use of leverage can amplify profits but also increases the risk of total loss.
Regulatory Uncertainty: Regulations related to cryptocurrencies vary by jurisdiction and may change, affecting the value or legality of trading.
Technical Risks: Platform disruptions, hacking, or technical issues may result in losses.
This information is not financial, investment, or trading advice. Consult a professional financial advisor before making decisions. We are not liable for any losses or damages arising from cryptocurrency futures trading.
Note: Ensure compliance with local regulations regarding cryptocurrency trading in your region.
thanks for like and follow @ydnldn
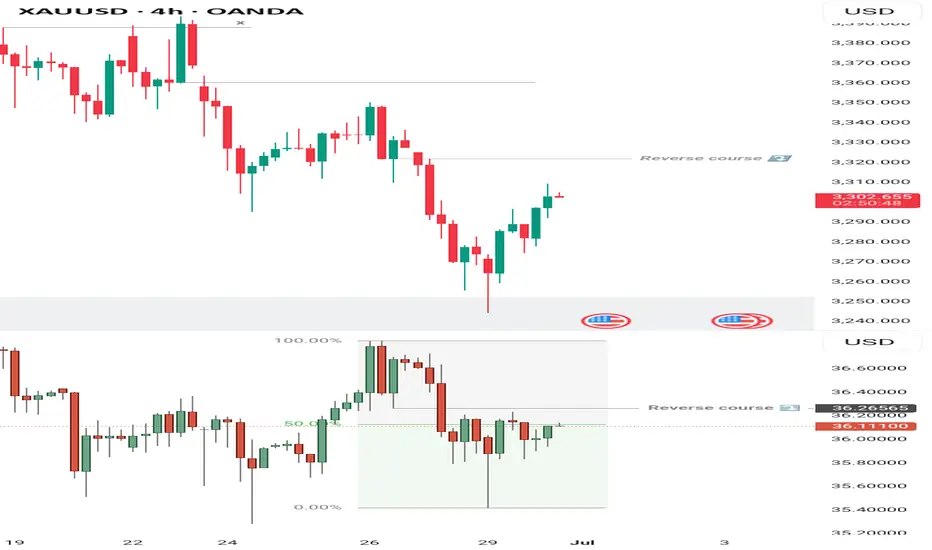
Gold (XAUUSD) 4H Technical Outlook
In line with my previous projection, price dropped from the 3330 region toward the key level around 3224, bottoming out at 3245 after sweeping liquidity—forming what now appears to be a potential double bottom.
However, the rally from 3245 looks more like a liquidity build-up than a true reversal. This suspicion is strengthened by Silver’s behavior, as it failed to confirm any bullish structure shift last week and isn’t participating in the rally as expected.
Currently, Silver is trading back into a premium zone around 36.27. With that in view, it would be ideal for Gold to revisit the 3322 region, offering a cleaner and more logical sell opportunity with defined risk. That said, overnight volatility during the Asian session could still lead to unexpected movements and early reversals.
USDJPY SHORT Market structure bearish on HTFs 3
Entry at Daily AOi
Weekly Rejection at AOi
Daily Rejection at AOi
Daily EMA retest
Previous Structure point Daily
Around Psychological Level 145.000
H4 EMA retest
H4 Candlestick rejection
H4 Head and Shoulder Pattern, Retest of the neckline
Levels 3.56
Entry 95%
DUE TO H4 I WILL BE GOING 1/2 A % RISK TO SEE IF MY EDGE WILL WORK
REMEMBER : Trading is a Game Of Probability
: Manage Your Risk
: Be Patient
: Every Moment Is Unique
: Rinse, Wash, Repeat!
: Christ is King.

NZDCAD LONGMarket structure bullish on HTFs DW
Entry at Daily and Weekly AOi
Weekly Rejection at AOi
Weekly EMA retest
Previous Weekly Structure Point
Daily Rejection At AOi
Previous Daily Structure Point
Around Psychological Level 0.82500
H4 Candlestick rejection
Levels 4.08
Entry 105%
REMEMBER : Trading is a Game Of Probability
: Manage Your Risk
: Be Patient
: Every Moment Is Unique
: Rinse, Wash, Repeat!
: Christ is King.

Short BTC, it is about to retrace and test 100000 again!As BTC gradually fell back, the rebound did not stand above 110,000 in the short term, proving that there is strong selling pressure above, and the trend line formed by the technical high point 111,000 and the second high point 110,000 formed an important resistance area, which limited the rebound space of BTC and strengthened the demand for BTC's short-term retracement.
According to the current trend, the short-term oscillation bottom area of 106,000 may be broken at any time. Once it falls below the oscillation area, it may arouse a certain degree of profit-taking chips and stimulate BTC to accelerate its decline. I think BTC will at least test the 105,000-104,000 area again during the retracement, and may even test the 100,000 integer mark again.
Therefore, shorting BTC is still the preferred option for current short-term trading.
Consider shorting BTC in the 108,000-109,000 area, and the target area in the short term is 104,500-103,500. After breaking this area, the target can be extended to 101,000-100,000.
BINANCE:BTCUSDT BINANCE:BTCUSDT BITSTAMP:BTCUSD

Short gold, it will fall again when encountering resistanceIn the short term, gold retreated to around 3274 and then rebounded again, and it is only one step away from 3300. Will gold regain its bullish trend again?
I think it is difficult for gold to break through in the short term. Although gold retreated to around 3274 and successfully built a double bottom structure with the second low point and the low point of 3245, it only increased the rebound space; it is not enough for gold to regain its bullish trend. Since gold fell and broke through, the confidence of bulls has been hit hard. The previous support at the technical level has formed a strong resistance area after the top and bottom conversion, and to a certain extent helped the short force. In the short term, gold faces resistance in the 3310-3320 area. Before gold breaks through this area, the short energy still has the upper hand.
Therefore, shorting gold is still the first choice for short-term trading.
It is appropriate to consider shorting gold in batches in the 3300-3320 area, and look at the target: 3385-3375-3365

Go long on dips and short on rallies📰 News information:
1. Gold market liquidity at the end of the month
2. Impact of geopolitical situation
📈 Technical Analysis:
Last week we predicted that gold would rebound. Today, after gold rebounded as expected, we gave a short trading strategy. Gold fell precisely at the point we gave, 3295, and successfully hit our TP3280-3270. The result confirmed the correctness of our trading strategy. Next, we will focus on the long trading opportunities below 3270-3260.
🎯 Trading Points:
BUY 3270-3260
TP 3290-3300
SELL 3295-3300-3310
TP 3280-3270
In addition to investment, life also includes poetry, distant places, and Allen. Facing the market is actually facing yourself, correcting your shortcomings, confronting your mistakes, and strictly disciplining yourself. I hope my analysis can help you🌐.
TVC:GOLD FXOPEN:XAUUSD PEPPERSTONE:XAUUSD FX:XAUUSD FOREXCOM:XAUUSD OANDA:XAUUSD

Analysis and layout of BTC trend in the third quarter📰 News information:
1. Pay attention to the movement of the cryptocurrency market
2. The impact of DAA, etc.
📈 Technical Analysis:
As demand weakens and supply pressure rises, BTC's network valuation exceeds the speed of activity. Exchange inflows and negative DAA divergences indicate that despite price stability, the risk of selling remains. Currently, BTC is experiencing a retracement after a rebound. In the short term, it is still possible to retrace to 106,500 and then rise after stabilizing.
🎯 Trading Points:
SELL 108000-107500
TP 107000-106500
BUY 106500-106000
TP 107500-108000
In addition to investment, life also includes poetry, distant places, and Allen. Facing the market is actually facing yourself, correcting your shortcomings, confronting your mistakes, and strictly disciplining yourself. I hope my analysis can help you🌐.

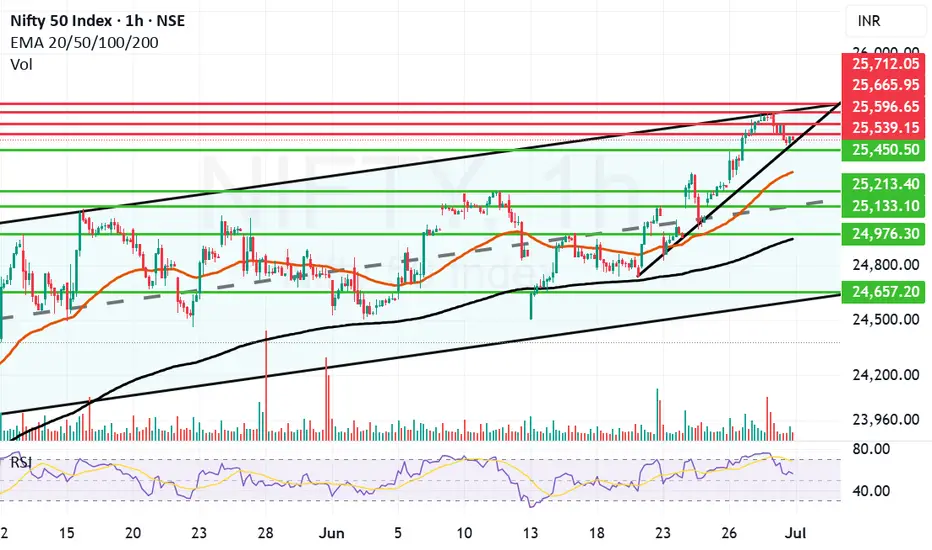
Nifty goes into consolidation mode to end the month at 25500.Today Nifty went into consolidation mode searching for the supports nearby after a massive upward run in the last week. Even though we saw Nift climbing down 120 points today the closing above 25500 is a good sign. It was a volatile day where Nifty made a high of 25669 and a low of 25473 moving 200 points down. But recovered a bit to close at 25517.
The Supports for Nifty remain at: 25450, 25321 (Mother line Support), 25133 (Mid-channel support). If that is broken the Nifty may fall further towards 24976 or 24956 (Which is the Father line support). Channel bottom seems to be at 24657. If we get a closing below this zone we will comment about further supports on the down side.
The Resistance for Nifty remain at: 24539, 24596, 25665 and finally 25712. (25712 seems to be the channel and trend top. Once Nifty closes above this zone we will be able to comment about further levels on the upside.
Disclaimer: The above information is provided for educational purpose, analysis and paper trading only. Please don't treat this as a buy or sell recommendation for the stock or index. The Techno-Funda analysis is based on data that is more than 3 months old. Supports and Resistances are determined by historic past peaks and Valley in the chart. Many other indicators and patterns like EMA, RSI, MACD, Volumes, Fibonacci, parallel channel etc. use historic data which is 3 months or older cyclical points. There is no guarantee they will work in future as markets are highly volatile and swings in prices are also due to macro and micro factors based on actions taken by the company as well as region and global events. Equity investment is subject to risks. I or my clients or family members might have positions in the stocks that we mention in our educational posts. We will not be responsible for any Profit or loss that may occur due to any financial decision taken based on any data provided in this message. Do consult your investment advisor before taking any financial decisions. Stop losses should be an important part of any investment in equity.
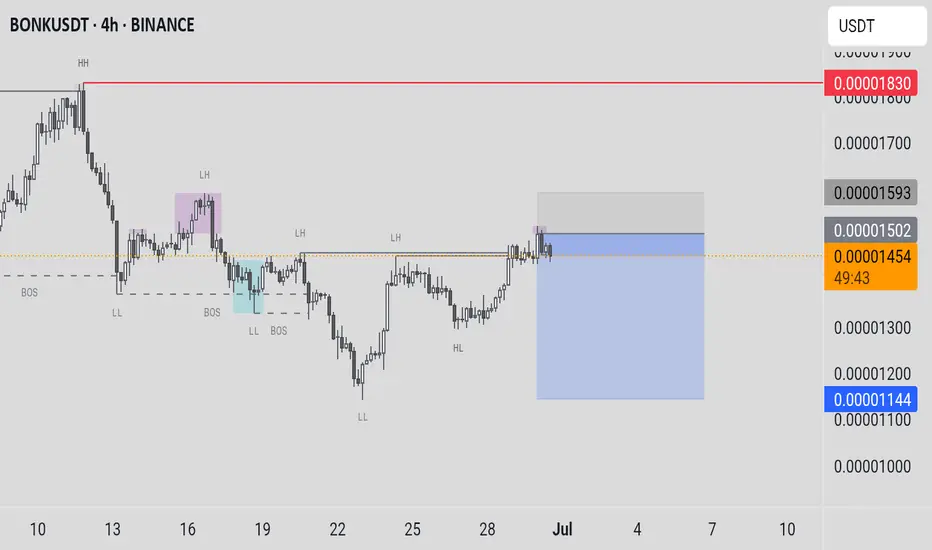
BONKUSDTCryptocurrency Futures Market Disclaimer 🚨🚨🚨
Trading cryptocurrency futures involves high risks and is not suitable for all investors.
Cryptocurrency prices are highly volatile, which can lead to significant gains or losses in a short period.
Before engaging in crypto futures trading, consider your risk tolerance, experience, and financial situation.
Risk of Loss: You may lose more than your initial capital due to the leveraged nature of futures. You are fully responsible for any losses incurred.
Market Volatility: Crypto prices can fluctuate significantly due to factors such as market sentiment, regulations, or unforeseen events.
Leverage Risk: The use of leverage can amplify profits but also increases the risk of total loss.
Regulatory Uncertainty: Regulations related to cryptocurrencies vary by jurisdiction and may change, affecting the value or legality of trading.
Technical Risks: Platform disruptions, hacking, or technical issues may result in losses.
This information is not financial, investment, or trading advice. Consult a professional financial advisor before making decisions. We are not liable for any losses or damages arising from cryptocurrency futures trading.
Note: Ensure compliance with local regulations regarding cryptocurrency trading in your region.
thanks for like and follow @ydnldn
Analysis and layout of gold trend at the end of the month📰 News information:
1. Gold market liquidity at the end of the month
2. Impact of geopolitical situation
📈 Technical Analysis:
From the beginning of the decline of gold near 3338 on Friday to today's lowest point near 3244, gold has fallen by nearly $94. At present, gold has rebounded as expected. In the short term, I think we have two key areas to pay attention to. The first is the position of 3290-3295, which is a 50% rebound, and the second is the upper top range limit range of 3300-3320. Of course, if it breaks through 3280 and then retreats, it can also be long twice, but the current price rebounds, considering the position of the temporary low long position, there is not much trading opportunity. First look at the key areas given to find opportunities for shorting, and pay attention to the opportunity of retreating to 3280-3270 below.
🎯 Trading Points:
SELL 3290-3295
TP 3380-3370
SELL 3300-3310-3320
TP 3290-3280-3270
BUY 3270-3260
TP 3290-3300
In addition to investment, life also includes poetry, distant places, and Allen. Facing the market is actually facing yourself, correcting your shortcomings, confronting your mistakes, and strictly disciplining yourself. I hope my analysis can help you🌐.
OANDA:XAUUSD FOREXCOM:XAUUSD FX:XAUUSD PEPPERSTONE:XAUUSD FXOPEN:XAUUSD TVC:GOLD

NATURAL GAS (NATGASUSD): Bullish Outlook Explained
Natural Gas is trading in a mid-term bullish trend on a daily.
The price updates higher highs and higher lows after each
test of a rising support line.
Its last test made the market form a strong rejection first
and a bullish engulfing candle then.
The market may continue growing and reach at least 3.7 resistance soon.
❤️Please, support my work with like, thank you!❤️

See you in 2029!Maybe this is my last analysis after my long journey in Bitcoin.
Thank you and see you in 2029, I will be back after 20th Bitcoin journey.

