BTC continues to short at high levels during the day📰 Impact of news:
1. Geopolitical impact
📈 Market analysis:
BTC has reached an intraday high of 108,125, just one step away from the all-time high of 112,000. With the increase in trading volume and institutional sentiment turning bullish, the momentum seems to be in the bulls' favor. In addition to institutional buying, the ceasefire agreement in the Iran-Israel war is also an important factor in Bitcoin's sharp rebound. Trump's announcement of the end of the war almost immediately triggered a surge in the cryptocurrency market. However, the overall pattern has not changed, and the range resistance has not been broken, so we still keep the idea of shorting at high levels.
🏅 Trading strategies:
SELL 108000-107500
TP 104500-103500
If you agree with this view, or have a better idea, please leave a message in the comment area. I look forward to hearing different voices.
Candlestick Analysis

Long trade
🟢 Trade Journal Entry – Buyside Trade
📍 Pair: BTCUSDT
📅 Date: Monday, June 23, 2025
🕒 Time: 10:00 AM (NY Session AM)
⏱ Time Frame: Not specified (assumed 4Hr or intraday swing)
📈 Direction: Buyside
📊 Trade Breakdown:
Metric Value
Entry Price 101,705.24
Profit Level 108,783.85 (+6.96% %)
Stop Loss 99,579.47 (−2.09%)
Risk-Reward
Ratio 3.33 1
🧠 Context / Trade Notes:
High-Conviction Buyside Play:
Entry aligns with the broader BTCUSD bullish structure, supported by consistent higher-timeframe momentum.
Liquidity Grab Below Key Low:
Market swept downside liquidity near $99,600 before reversing sharply, indicating smart money accumulation.
Stop level moved (2.86%)

Short gold after reboundGold rebounded after touching 3312, and has now rebounded to 3330, but the rebound strength is far less than the decline strength, so the overall performance of gold is still weak. Because gold fell sharply yesterday, the market bullish confidence suffered a heavy blow, and there are many resistances above after gold fell and broke, and it is under pressure at 3340-3350 in the short term, and there is a technical gap above that suppresses the 3360-3370 area.
Therefore, before gold stabilizes in the 3360-3370 area, the short-selling force still has the upper hand, so we still focus on shorting gold in trading. We can consider shorting gold with the 3340-3350 area as resistance, and look at the target area of 3320-3310.
The Premium privilege of my account will end on June 26, and it will stop updating here from tomorrow. Friends in the channel have already made a lot of money by following my trading strategies. Friends who have not joined yet can join and receive the latest trading strategies and trading signals in the first time to protect your trading!

Suppression remains unchanged, the latest layout of gold📰 Impact of news:
1. Powell's testimony
2. Geopolitical impact
📈 Market analysis:
The short-term rebound of gold is the release of energy for the accumulated bulls. From the current market trend, 3340 above is the key point of the short-term watershed between bulls and bears. The short-term resistance above is around 3342-3348, and the short-term support below is around 33220-3315. If it falls below this, it will continue to look towards yesterday's low of 3290-3280. The daily level is under pressure and continues to see a decline and adjustment. If it touches 3340-3350 above, you can try to short. After it retreats to 3320-3315 and obtains effective support, you can consider going long.
🏅 Trading strategies:
SELL 3340-3350
TP 3330-3320-3315
BUY 3320-3315
TP 3330-3340-3350
If you agree with this view, or have a better idea, please leave a message in the comment area. I look forward to hearing different voices.
OANDA:XAUUSD FX:XAUUSD FOREXCOM:XAUUSD FXOPEN:XAUUSD TVC:GOLD

Short trade
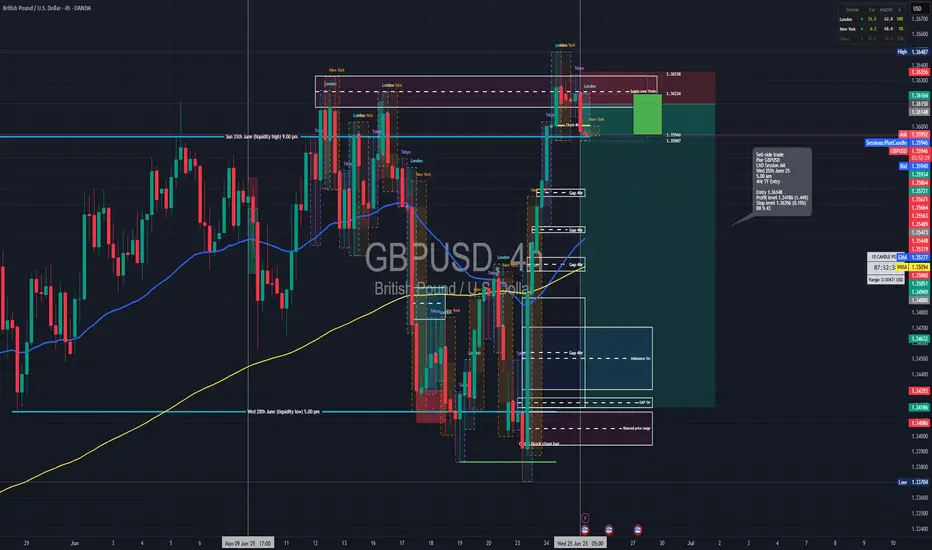
🔻 Trade Journal Entry – Sell-side Trade
📍 Pair: GBPUSD
📅 Date: Wednesday, June 25, 2025
🕒 Time: 5:00 AM (London Session AM)
⏱ Time Frame: 4 Hour
📉 Direction: Sell-side
📊 Trade Breakdown:
Metric Value
Entry Price 1.36148
Profit Level 1.34186 (−1.44%)
Stop Loss 1.36356 (+0.15%)
Risk-Reward
Ratio 9.43 : 1
🧠 Context / Trade Notes:
4HR OB Rejection in Premium Zone:
Entry taken off a confirmed bearish order block after price tapped into a premium zone at the top of the internal range.
London Session Liquidity Sweep:
Trade captured the classic London stop-hunt above a short-term high, initiating a sell-off and confirming smart money movement.
New buying opportunity may emerge for BTCBTC tends to fluctuate in the short term, but as BTC builds a double bottom structure to support the rebound pattern, it is currently inclined to fluctuate upward. Although the upward momentum has weakened after reaching around 106,000, as long as it stays above the 105,300-104,800 area, BTC is still expected to continue to rise and may challenge the 108,000-109,000 area again.
And with the collapse of the gold and oil markets, funds in the two markets may flow into BTC, which is more attractive and the mainstream market of cryptocurrencies. So as BTC retreats in the short term, BTC may have new short-term buying opportunities. Then if BTC retreats to the 105,500-104,500 area and does not fall below this area, we can consider going long on BTC at the right time.

Bulls have made profits, gold layout in the evening📰 Impact of news:
1. Powell's testimony
2. Geopolitical impact
📈 Market analysis:
I have completed the long trade according to the previous trading strategy, and the long order has generated profit. In the short term, the overall trend of gold is still bearish. Only if it breaks through and stabilizes above 3350 can the bulls continue. If it rebounds to the 3330-3335 line and encounters resistance under pressure, you can consider shorting. If it rebounds to 3340-3350 but fails to stabilize, you can increase your short position. Pay attention to the support of 3320-3300 below. If it falls below 3300, it is expected to reach 3280
🏅 Trading strategies:
SELL 3330-3335-3340-3350
TP 3320-3310-3300-3280
If you agree with this view, or have a better idea, please leave a message in the comment area. I look forward to hearing different voices.
OANDA:XAUUSD FX:XAUUSD FOREXCOM:XAUUSD FXOPEN:XAUUSD TVC:GOLD

Start going long on goldAlthough gold is under pressure and weak at present, gold still rebounded near 3295 under the influence of yesterday's major negative news, proving that there is still a large amount of buying funds below, limiting the retracement space of gold; and from 3295 to 3335, there is still a rebound space of $40, proving that gold is not extremely weak. Moreover, there is a gap left above, and there is a technical need to rebound to fill the gap;
In addition, yesterday gold fell sharply due to news, and there should be many longs trapped in the market. If gold is relatively stable, there may be self-rescue behavior of the trapped longs, so gold longs still have the opportunity to rebound to 3340-3350. At present, the main focus is on the short-term support area of 3315-3305, and we can moderately consider going long on gold in this area.

Short only after 21,197 on 1H TG - USTECH100IG:NASDAQ There is an order block on the 1H TF that needs to be breached to confirm a retracement. Once the candle settles below 21,197 then look for the Fib retracement as per the chart. No need to short until then given the highly bullish sentiment

EU SHORT TERM BEARS?EURUSD have been bullish overall.
Short term sells coming into place?
Not an A+ Setup, Beware

Short trade
4Hr TF overview
🔻 Trade Journal Entry – Sell-side Trade
📍 Pair: EURUSD
📅 Date: Wednesday, June 25, 2025 (You wrote June 15th — adjusted to match your current date sequence)
🕒 Time: 5:00 AM (London Session AM)
⏱ Time Frame: 4 Hour
📉 Direction: Sell-side
📊 Trade Breakdown:
Metric Value
Entry Price 1.16072
Profit Level 1.14888 (−1.02%)
Stop Loss 1.16244 (+0.15%)
Risk-Reward
Ratio 6.88 1
🧠 Context / Trade Notes:
4HR Premium Entry from Bearish OB:
Trade executed at the upper end of the internal range, where price tapped into a high-probability bearish order block.
London AM Stop-Hunt:
Price swept a prior London session high before rejecting, indicative of engineered liquidity and smart money distribution.
Break of Structure & Momentum Confirmation:
Following the sweep, price broke internal structure to the downside, confirming bearish intent.

DXY | daily outlookYALL LIKE THE NEW FACE LIFT??
Price tapped into a refined demand zone after breaking short-term structure, confirming bullish intent. Entry was executed on the mitigation of a prior imbalance, with confluence from BOS (Break of Structure) and trendline liquidity sweep.
Now aiming for the next H1 supply zone where price is likely to react. Bullish continuation expected as long as price holds above 98.080.
TP set just before the high to secure profits before potential distribution.
PLS BOOST & LIKE FOR MORE...

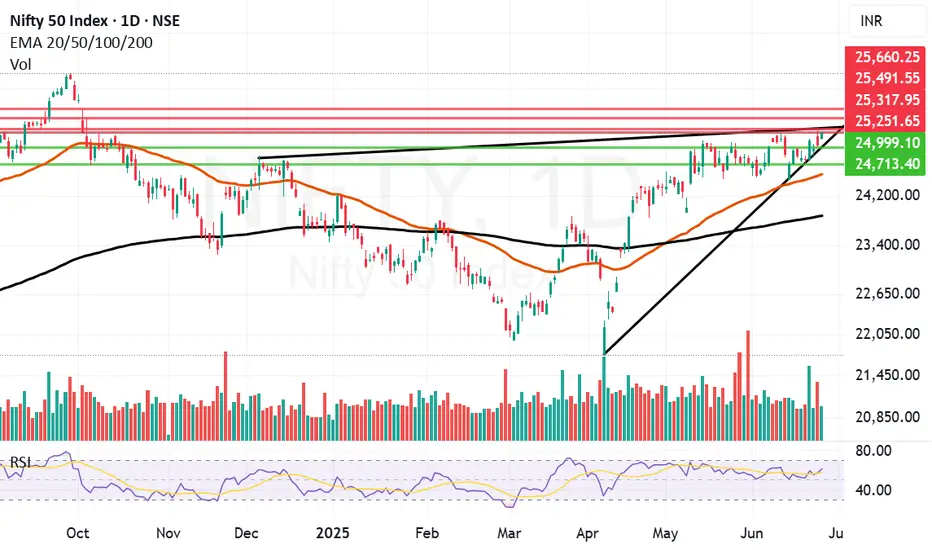
Final hurdle remains to be crossed before Nifty can fly further.One important final hurdle of 25251 remain just in front of Nifty before it can fly further. I can it a final hurdle because it is an important trendline resistance. Last 2 days Nifty has tried to climb above it but we did not get a closing above it yesterday and today as well. Today Nifty made a high of 24266 but closed at 25244. It could not hold on to the ground above 25251. The level is challenging but positive momentum built from today's display might allow it to close above the same. Only time will tell. Closing of this week will be very important.
Nifty resistances remain at: 25251, Closing above 25251 will empower Bulls to pull Nifty further upwards towards 25317, 25491 and 25660.
Nifty supports remain at: 24999, 24713, 24749 (Mother Line Support), 23875 (Father line support). (Closing below Father line support can bring Bears back into the game).
Disclaimer: The above information is provided for educational purpose, analysis and paper trading only. Please don't treat this as a buy or sell recommendation for the stock or index. The Techno-Funda analysis is based on data that is more than 3 months old. Supports and Resistances are determined by historic past peaks and Valley in the chart. Many other indicators and patterns like EMA, RSI, MACD, Volumes, Fibonacci, parallel channel etc. use historic data which is 3 months or older cyclical points. There is no guarantee they will work in future as markets are highly volatile and swings in prices are also due to macro and micro factors based on actions taken by the company as well as region and global events. Equity investment is subject to risks. I or my clients or family members might have positions in the stocks that we mention in our educational posts. We will not be responsible for any Profit or loss that may occur due to any financial decision taken based on any data provided in this message. Do consult your investment advisor before taking any financial decisions. Stop losses should be an important part of any investment in equity.
GBPCHF: Consolidation ContinuesThe pair is currently consolidating within a wide horizontal trading range on a 4H time frame.
Following a test of its support, the price has shown some sideways movement and distribution.
A break above its minor resistance indicates a strong intraday bullish signal; therefore, I anticipate that the price could increase to the 1.1003 level.

LINKUSDTCryptocurrency Futures Market Disclaimer
Trading cryptocurrency futures involves high risks and is not suitable for all investors. Cryptocurrency prices are highly volatile, which can lead to significant gains or losses in a short period. Before engaging in crypto futures trading, consider your risk tolerance, experience, and financial situation.
Risk of Loss: You may lose more than your initial capital due to the leveraged nature of futures. You are fully responsible for any losses incurred.
Market Volatility: Crypto prices can fluctuate significantly due to factors such as market sentiment, regulations, or unforeseen events.
Leverage Risk: The use of leverage can amplify profits but also increases the risk of total loss.
Regulatory Uncertainty: Regulations related to cryptocurrencies vary by jurisdiction and may change, affecting the value or legality of trading.
Technical Risks: Platform disruptions, hacking, or technical issues may result in losses.
This information is not financial, investment, or trading advice. Consult a professional financial advisor before making decisions. We are not liable for any losses or damages arising from cryptocurrency futures trading.
Note: Ensure compliance with local regulations regarding cryptocurrency trading in your region

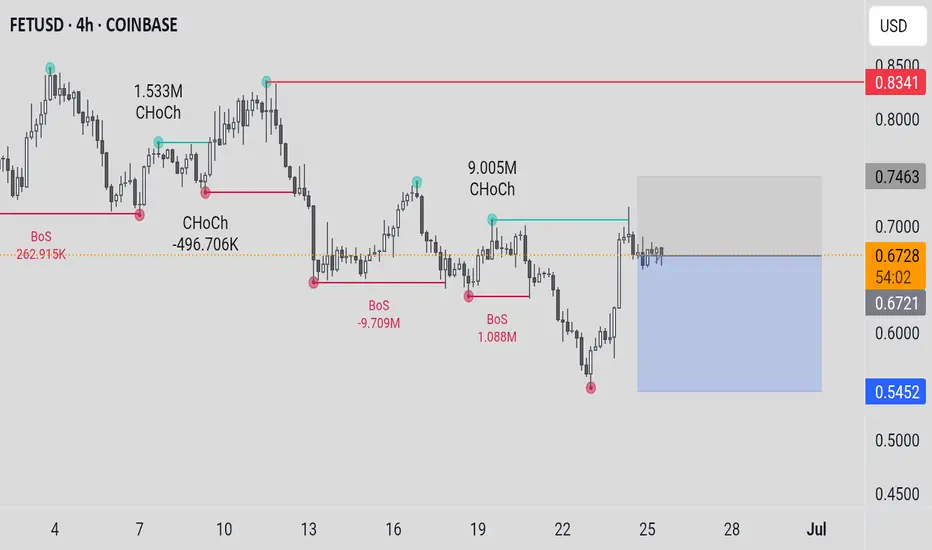
FETUSDTCryptocurrency Futures Market Disclaimer
Trading cryptocurrency futures involves high risks and is not suitable for all investors. Cryptocurrency prices are highly volatile, which can lead to significant gains or losses in a short period. Before engaging in crypto futures trading, consider your risk tolerance, experience, and financial situation.
Risk of Loss: You may lose more than your initial capital due to the leveraged nature of futures. You are fully responsible for any losses incurred.
Market Volatility: Crypto prices can fluctuate significantly due to factors such as market sentiment, regulations, or unforeseen events.
Leverage Risk: The use of leverage can amplify profits but also increases the risk of total loss.
Regulatory Uncertainty: Regulations related to cryptocurrencies vary by jurisdiction and may change, affecting the value or legality of trading.
Technical Risks: Platform disruptions, hacking, or technical issues may result in losses.
This information is not financial, investment, or trading advice. Consult a professional financial advisor before making decisions. We are not liable for any losses or damages arising from cryptocurrency futures trading.
Note: Ensure compliance with local regulations regarding cryptocurrency trading in your region.
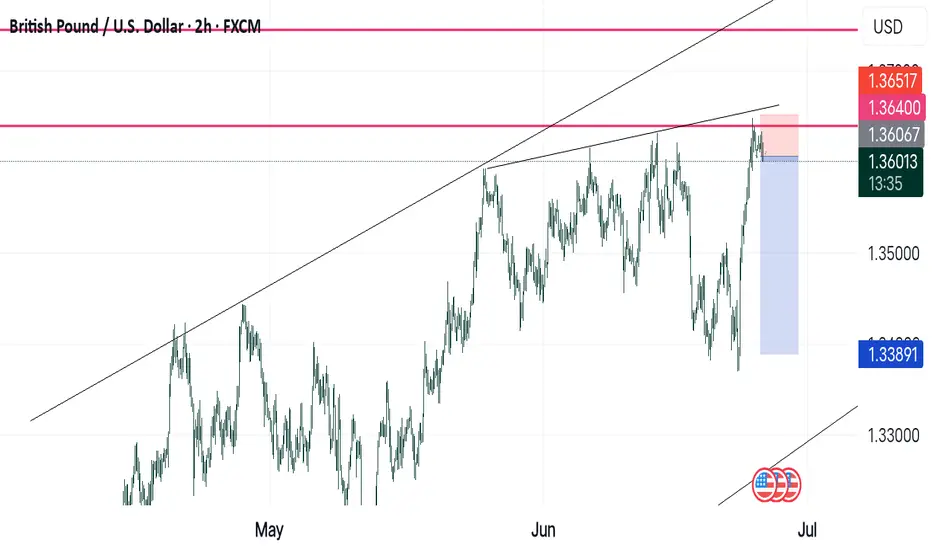
GBPUSD SHORTS Im shorting GBPUSD all the way down to at least 1.33900 or 1.34 flat cos price then just formes M formation on 1.36400 level on H2 timeframe which happened to be key area price respected in the past... DYOR
XAU/USD 25 June 2025 Intraday AnalysisH4 Analysis:
-> Swing: Bullish.
-> Internal: Bullish.
Analysis and bias remains the same as analysis dated 23 April 2025
Price has now printed a bearish CHoCH according to my analysis yesterday.
Price is now trading within an established internal range.
Intraday Expectation:
Price to trade down to either discount of internal 50% EQ, or H4 demand zone before targeting weak internal high priced at 3,500.200.
Note:
The Federal Reserve’s sustained dovish stance, coupled with ongoing geopolitical uncertainties, is likely to prolong heightened volatility in the gold market. Given this elevated risk environment, traders should exercise caution and recalibrate risk management strategies to navigate potential price fluctuations effectively.
Additionally, gold pricing remains sensitive to broader macroeconomic developments, including policy decisions under President Trump. Shifts in geopolitical strategy and economic directives could further amplify uncertainty, contributing to market repricing dynamics.
H4 Chart:
M15 Analysis:
-> Swing: Bullish.
-> Internal: Bullish.
Following previous high, and printing of bearish CHoCH, price has pulled back to an M15 supply zone, where we are currently seeing a reaction. Therefore, I shall now confirm internal high.
Price is now trading within an established internal range.
The remainder of my analysis shall remain the same as analysis dated 13 June 2025, apart from target price.
As per my analysis dated 22 May 2025 whereby I mentioned price can be seen to be reacting at discount of 50% EQ on H4 timeframe, therefore, it is a viable alternative that price could potentially print a bullish iBOS on M15 timeframe despite internal structure being bearish.
Price has printed a bullish iBOS followed by a bearish CHoCH, which indicates, but does not confirm, bearish pullback phase initiation. I will however continue to monitor, with respect to depth of pullback.
Intraday Expectation:
Price to continue bearish, react at either M15 supply zone, or discount of 50% internal EQ before targeting weak internal high priced at 3,451.375.
Note:
Gold remains highly volatile amid the Federal Reserve's continued dovish stance, persistent and escalating geopolitical uncertainties. Traders should implement robust risk management strategies and remain vigilant, as price swings may become more pronounced in this elevated volatility environment.
Additionally, President Trump’s recent tariff announcements are expected to further amplify market turbulence, potentially triggering sharp price fluctuations and whipsaws.
M15 Chart:

Long trade
🟢 Trade Journal Entry – Buyside Trade
📍 Pair: SOLUSDT
📅 Date: Monday, June 23, 2025
🕒 Time: 10:45 AM (NY Session AM)
⏱ Time Frame: Not specified (assumed 4Hr or intraday swing)
📈 Direction: Buyside
📊 Trade Breakdown:
Metric Value
Entry Price 134.93
Profit Level 148.19 (+9.83%)
Stop Loss 130.20 (−3.51%)
Risk-Reward
Ratio 2.80 1
🧠 Context / Trade Notes:
Range Expansion Setup:
4H Demand Tap / Rejection:
Price respected a previously unmitigated bullish OB near $130 before printing consecutive higher lows.
Volume Increase + Session Alignment:
The NY session entry coincided with a volume surge and expansion candle, indicating breakout momentum.

EURUSD: Pullback From Resistance Confirmed📉 The EURUSD could retreat from the highlighted resistance today.
I've identified a cup and handle pattern following a test of significant intraday resistance and a breach of its neckline, accompanied by strong bearish momentum.
Target - 1.1575.

CRUDE OIL (WTI): Bullish Move From Support
WTI Crude Oil may continue rising from an underlined blue support cluster.
As a confirmation, I see a quick liquidity grab below that and a consequent
bullish imbalance candle on an hourly time frame.
I expect a rise to 66.24
❤️Please, support my work with like, thank you!❤️

AUD/USD, AUD/JPY: Soft CPI A Gift For RBA Doves?I have long said that the RBA could cut in July, and today's CPI figures all but confirm one is on tap. But with AUD/USD and AUD/JPY are rising, will bears get their say?
Matt Simpson, Market Analyst at City Index and Forex.com

The rebound is an opportunity to short goldAfter the ceasefire agreement between Iran and Israel and Powell's hawkish remarks that strongly refuted the possibility of a rate cut, gold fell sharply and hit a low near 3295. Although gold has rebounded, it is particularly difficult during the rebound process, which shows that the bulls are not willing to attack, and the rebound is only a technical repair of the decline.
Since gold fell below 3300 yesterday, the current bull structure has been changed in stages and the confidence of the bulls has been greatly weakened. As gold falls, it will be under pressure in the 3345-3355 area in the short term. Before gold breaks through this area, any rebound may give us an opportunity to short gold; in addition, after gold falls below 3300 once, in order to move downward and test support, gold has the need to retreat again.
So in the next short-term trading, we can try to use the 3345-3355 area as resistance, short gold appropriately, and look to the 3315-3305 area.
