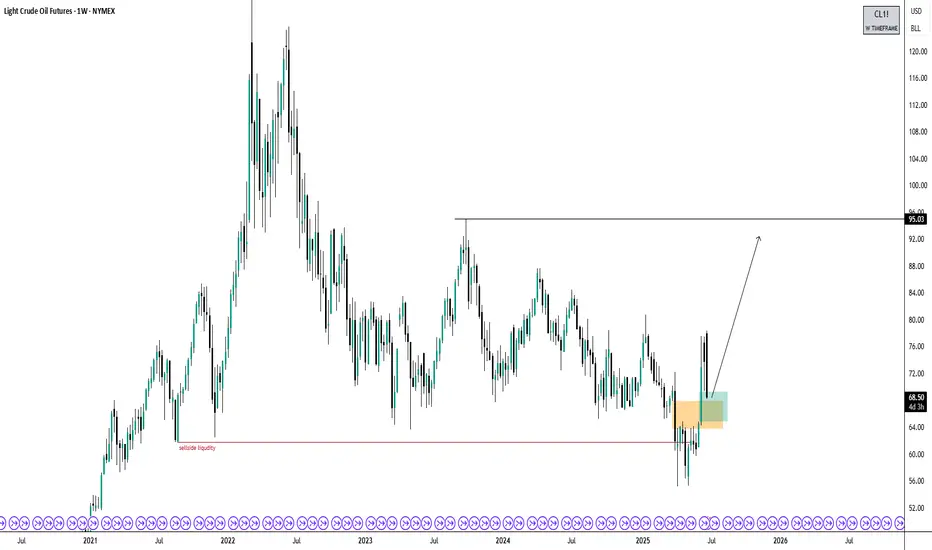
Crude Oil Bullish BiasThree years ago, I predicted that oil would trade below $61 when the price was around $118. Price traded to $55 and is now up to $68. I now believe price has exhausted sell-side liquidity and will trade higher, possibly seeing $95 and beyond.
*Not financial advice
Candlestick Analysis
Conflict breaks out, risk aversion rises, can 3400 be broken?Bowman's dovish comments in the afternoon eased the market, by which time risk aversion was deepening as sudden geopolitical conflicts continued to deepen. Will the USA make a corresponding response to this matter? This series of events has once again put gold into a complicated situation. Can gold hit the 3,400 mark today?
Free trading strategies are updated daily🌐. All trading strategies released since this month have been verified and can serve as a good reference📈.👇 I sincerely hope that these strategies can be helpful to you👇.
OANDA:XAUUSD FX:XAUUSD FOREXCOM:XAUUSD FXOPEN:XAUUSD TVC:GOLD

GBPCHF: Pullback From Support 🇬🇧🇨🇭
GBPCHF is going to pull back from a wide daily support cluster.
I see a strong intraday bullish confirmation and a bullish
imbalance candle after the news.
Goal - 1.0986
❤️Please, support my work with like, thank you!❤️
I am part of Trade Nation's Influencer program and receive a monthly fee for using their TradingView charts in my analysis.

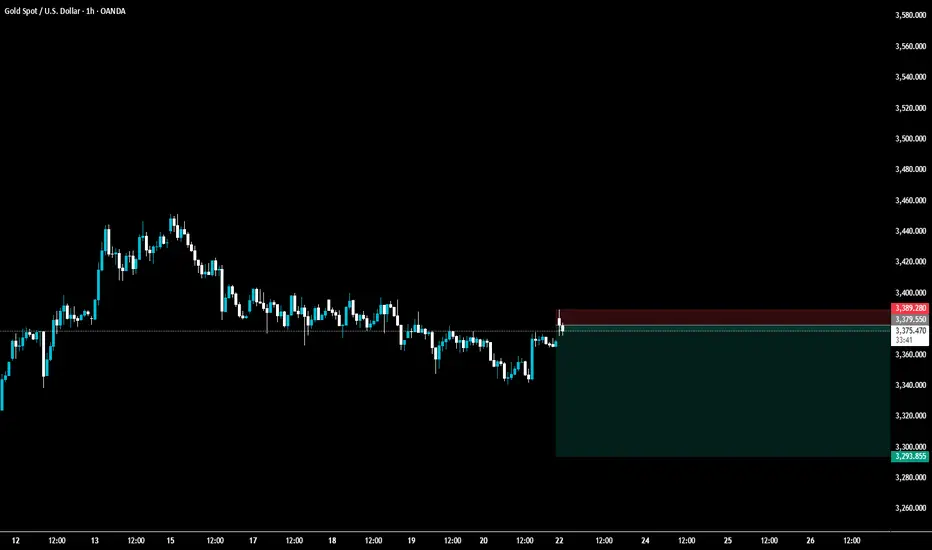
Short gold, gold still has at least one chance to pullback!At present, gold has rebounded to the 3370-3380 area again, which largely confirms that 3350-3340 is the bottom area at this stage. However, what we still cannot underestimate is that even with the support of safe-haven, gold has still failed to effectively break through the resistance of 3385-3395-3405 area, and even fell under pressure several times. To a certain extent, it weakened the willingness and confidence of bulls, so it aggravated the trend of wide fluctuations in the short term. During this period, we must pay attention to the rhythm change of gold.
According to the current bullish strength of gold, I think gold does not have the conditions to directly break through the heavy resistance of 3385-3395-3405 area for the time being, so gold still needs at least one retracement expectation, so I think we can still try to short gold in the 3375-3385 area, but the retracement expectation should not be too large, 3365-3355 is enough!

Gold opens high and moves lower, focus on 3340 support📰 Impact of news:
1. Federal Reserve Board member Bowman speaks on monetary policy and the banking industry
2. The United States intervenes in the Iran-Israel conflict and pays attention to the geopolitical situation
📈 Market analysis:
In the early Asian session, gold prices surged but failed to break through the key watershed of 3405. The current risk aversion conflict failed to break through the key resistance level, so the short-term trend is still weak and bearish. On the hourly chart, gold continues to retreat. As the current short-selling momentum continues to gain momentum, we will first look at whether the double bottom support of 3340 is effective. If it fails to break through while retreating, we can consider a short-term upward rebound in the support and consider going long. Looking at the second decline point at 3370-3375, unless the news stimulates the gold trend, you can still consider placing short orders if it touches the 3370-3380 line! On the whole, pay attention to the resistance line of 3370-3380 above and the support line of 3345-3335 below.
🏅 Trading strategies:
BUY 3350-3345-3335
TP 3360-3370-3380
SELL 3370-3380
TP 3360-3350-3345
If you agree with this view, or have a better idea, please leave a message in the comment area. I look forward to hearing different voices.
OANDA:XAUUSD FX:XAUUSD FOREXCOM:XAUUSD FXOPEN:XAUUSD TVC:GOLD

Nifty Analysis EOD – June 23, 2025 – Monday🟢 Nifty Analysis EOD – June 23, 2025 – Monday 🔴
👊 Tug of War Between Optimism and Pessimism
Nifty opened with a sharp 140-point gap-down, weighed by geopolitical tensions and negative news cues. The mood was clearly pessimistic — yet, from the deep low of 24,824.85, bulls made a bold comeback.
What followed was a classic textbook reversal:Price clawed back up, cutting through multiple key resistances — S1, VWAP, CDH, CPR BC, and Central CPR — before kissing the CPR TC, where it marked the day high at 25,057. This level acted as a supply zone and pushed Nifty back down toward the CPR BC, where it managed to close above the open — a quiet victory for the bulls, even in a red session overall.
The level 24,825 has now proven itself once again — the market’s respect for this support zone grows stronger with every bounce.
Today’s candle was a spinning top-style doji and also formed an inside bar, with all movement inside Friday’s wide-range candle (352 pts). Despite a smaller 232-point range today, this still requires caution — inside bars after large-range candles often result in false breakouts, especially amid macro noise.
📌 When the world looks bearish, and the chart looks bullish — trust your system.And that’s exactly what I did today — sticking to the Gladiator Strategy, a simple, disciplined intraday price action-based option buying framework.
🕯 5 Min Time Frame Chart with Intraday Levels
🕯 Daily Time Frame Chart with Intraday Levels
🕯 Daily Candle Breakdown
Open: 24,939.75
High: 25,057.00
Low: 24,824.85
Close: 24,971.90
Change: −140.50 (−0.56%)
📊 Candle Structure Breakdown
Real Body: 32.15 pts (small green body)
Upper Wick: 85.10 pts
Lower Wick: 114.90 pts
🔍 Interpretation
Despite a lower close than Friday, it was a green-bodied candle (close > open).
Long lower wick shows strong buying near 24,825.
Long upper wick signals resistance near 25,050–25,060.
🕯 Candle Type
📍 Spinning Top with Long Wicks — Sign of indecision, but slight bullish bias due to buying off the lows.
📌 Key Insight
Support at 24,825 holds strong.
Upper rejection near 25,050 indicates tight overhead pressure.
Watch closely:
Break above 25,060 → May trigger bullish continuation.
Break below 24,820 → Could open downside to 24,735–24,660 zone.
🛡 5 Min Intraday Chart
⚔️ Gladiator Strategy Update
ATR: 254.95
IB Range: 163.25 → Medium IB
Market Structure: ⚖️ Balanced
Trades Triggered:
🟢 10:14 AM – Long Trade → ✅ Target Achieved (Trailing Exit, R:R 1:4.51)
🔴 2:16 PM – Short Signal → ❌ Discarded (RR not favorable)
📌 Support & Resistance Zones
Resistance Levels
24,980 ~ 25,000
25,060 ~ 25,080
25,125 ~ 25,150
25,180 ~ 25,212
25,285
Support Levels
24,965
24,894 ~ 24,882
24,825
24,800 ~ 24,768
24,735 ~ 24,725
💭 Final Thoughts
Markets are currently walking a tightrope — with bearish headlines on one side and bullish price action on the other.The Gladiator approach today helped sidestep the noise and focus on what matters: price structure and clean levels.
📌 Trade the chart, not the news. And when in doubt — zoom out.
🧠 “Uncertainty is the playground of the disciplined.”
✏️ Disclaimer
This is just my personal viewpoint. Always consult your financial advisor before taking any action.

USDCAD is Nearing The Daily TrendHey Traders, in today's trading session we are monitoring USDCAD for a selling opportunity around 1.38500 zone, USDCAD is trading in a downtrend and currently is in a correction phase in which it is approaching the trend at 1.38500 support and resistance area.
Trade safe, Joe.

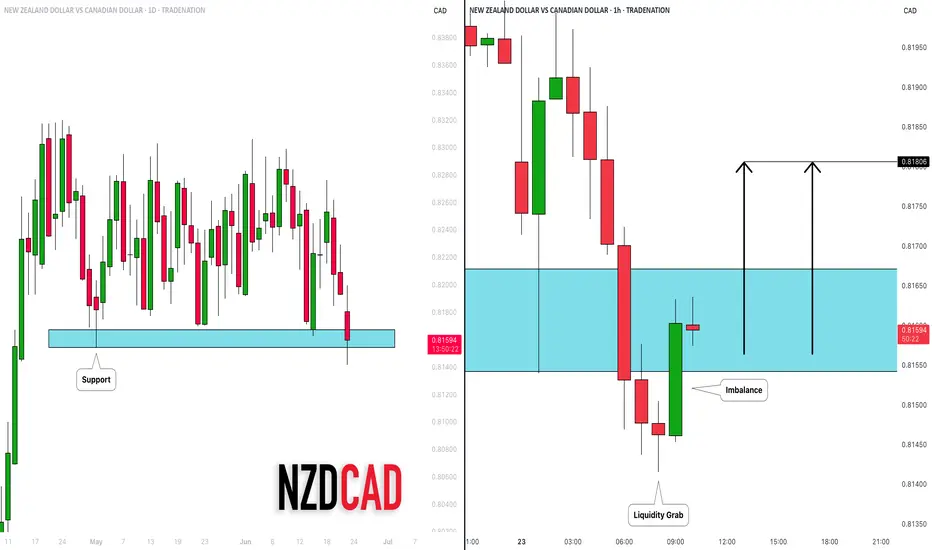
NZDCAD: Confirmed Bearish Trap?! 🇳🇿🇨🇦
There is a high chance that NZDCAD will bounce
after a false violation of a significant daily support cluster.
A formation of a bullish imbalance candle on an hourly time frame
leaves a strong bullish clue.
Goal - 0.818
❤️Please, support my work with like, thank you!❤️
I am part of Trade Nation's Influencer program and receive a monthly fee for using their TradingView charts in my analysis.
BTC is expected to continue its decline to 100,000BTC has encountered resistance and fallen back several times near 110,000, forming an absolute suppression in the short term. It is difficult for BTC to overcome this resistance area in the short term. As BTC has been unable to break through for a long time, some profit-taking and panic selling will cause BTC to gradually collapse. At present, BTC has fallen back to around 104,000. During the retracement, it has built a short-term resistance area of 105,500-106,000, which limits the rebound space in the short term and will further strengthen the bearish sentiment in the market. BTC will completely open up the downward space.
At present, the 103,000-102,500 area still has a certain support effect on BTC. As BTC shows a volatile downward trend, this support area will be broken again and continue to fall to the area near 100,000. Therefore, in short-term trading, we can consider shorting BTC in the 105,000-105,500 area.
BINANCE:BTCUSDT BITSTAMP:BTCUSD BINANCE:BTCUSDT COINBASE:BTCUSD

EURUSD Advanced Price Action PatternEURUSD is forming a price action pattern on the 5 minute timeframe, this pattern usually results in a breakout. I am thinking this breakout will be bullish and result in creating a top wick for the daily candle.

EURUSD -> Bullish Idea 22/06/2025(ICT x Volume Profile)OANDA:EURUSD 🎯 Bias: Bullish
🕒 Timeframe: H1 primary, H15 confirmation
Happy sunday traders!
Following President Trump’s strikes on Iran, I expect an initial bearish reaction in the Asian and London Sessions, then a bullish reaction in the NY sessions as sellers push the USD lower. However, the prevailing trend context remains bullish: the hourly chart has shifted structure (MSS) and broke structure to the upside. I anticipate a liquidity sweep below the recent lows, before a retracement into the 15-minute fair value gap (FVG) which aligns with the volume profile, then continuation higher to target the weak high and into the swing highs marked.

GOLD: A Week After Israel Bombs Iranmy view on where gold is going and how i caught the buy on friday after much accumulation

sell to buystructure narrative.
order flow; weak swings and failed zones.
liquidity; sweeps and inducements.
point of interests: order blocks(+/-)

EURAUD Analysis Expecting price preparing to sell off.
I believe price will ultimately attempt another minor bullish push and meet resistance at the supply zone (shaded blue area).
A bearish divergence is currently present, however, I believe it will be confirmed after the failed bullish push.
Looking to short from the supply zone to the 4H zone (pink shaded area)

ETHUSDT – Trade Recap & Daily Bias for June 21Trade Recap (June 20):
I. First thing I did was mark out a DOL on the daily — price was hovering near a swing low, and I started noticing trend-side liquidity building up on the lower timeframes.
So my directional bias for today was short.
II. I marked the daily open.
III. With a short bias in mind, I waited for a Turtle Soup setup right above the daily open.
IV. The equal highs above were clean and obvious — textbook liquidity.
V. Once that liquidity was swept, I dropped to the M15 to watch how price reacted — waited for a clean displacement away from that zone before getting involved.
Daily Bias (June 21):
Still leaning short. We’re pretty close to a weekly FVG, which might act as a magnet.
If price forms liquidity during the day and takes it out in-session, I’ll look to short again.
Bread and Butter & Turtle Soup

Long trade
1min TF entry
🟢 Trade Journal Entry – Buyside Trade
📍 Pair: BTCUSDT
📅 Date: Saturday, June 21, 2025
🕒 Time: 11:45 AM (NY Session AM)
⏱ Time Frame: 1 Minute
📈 Direction: Buyside
📊 Trade Breakdown:
Entry Price 103,468.8
Profit Level 103,639.8 (+0.17%)
Stop Loss 103,420.3 (−0.05%)
Risk-Reward
Ratio 3.53: 1
🧠 Context / Trade Notes:
1-Minute TF Scalping Setup:
Trade executed on ultra-low time frame during late NY AM volatility window — ideal for short bursts of movement and precision entries.
Liquidity Sweep Below Minor Low:
Entry taken after price dipped below a small intra-session low, triggering a liquidity grab before a quick reversal.

Long trade
15
min overview
🟢 Trade Journal Entry – Buyside Trade
📍 Pair: ETHUSDT
📅 Date: Saturday, June 21, 2025
🕒 Time: 2:00 AM (Asian Session AM)
⏱ Time Frame: 15 Minutes
📈 Direction: Buyside
📊 Trade Breakdown:
Entry Price 2422.81
Profit Level 2474.60 (+2.14%)
Stop Loss 2415.04 (−0.32%)
Risk-Reward
Ratio 6.67 1
🧠 Context / Trade Notes:
BOS 5th June – 4HR Low Wick:
Break of structure observed on June 5th from a 4-hour low wick.
Observing the current NY session sweep of the liquidity from the London low wick signalled Sellside exhaustion.
Order Block & Retest:
A bullish OB formed on a prior swing, with a clean mitigation of price (Fri, 20th price range) and BOS, confirming buy-side interest.
5min TF Observation - entry:
Narrative:
Utilising DRT levels (coined by Ali Khan) to navigate the range and unfolding price action.
Target imbalance zone 1Hr.

Great recovery by Nifty to end the week. Nifty has shown a great recovery to end the week at 25112 despite persisting global uncertainties. This again shows imminent strength of Indian markets and confidence on the local factors by Bulls.
Nifty however is now entering a tough resistance zone which starts exactly from 25113 and extends till 25251. Once we get a closing above 25251 the Bulls will try to control the market with more strength. Till that happens it can still go in any direction. The supports for Nifty remain at 24869, 24713, 24480 (Mother line support), 24175 and finally 23838 (Father line support).
If any major further global escalation happens during the weekend and we get a closing below 23838 then Bears can become more powerful and they might have potential to push market further down towards 23047 or below.
Things hang in balance despite a strong closing on Friday as the shadow of the candle is still neutral.
Disclaimer: The above information is provided for educational purpose, analysis and paper trading only. Please don't treat this as a buy or sell recommendation for the stock or index. The Techno-Funda analysis is based on data that is more than 3 months old. Supports and Resistances are determined by historic past peaks and Valley in the chart. Many other indicators and patterns like EMA, RSI, MACD, Volumes, Fibonacci, parallel channel etc. use historic data which is 3 months or older cyclical points. There is no guarantee they will work in future as markets are highly volatile and swings in prices are also due to macro and micro factors based on actions taken by the company as well as region and global events. Equity investment is subject to risks. I or my clients or family members might have positions in the stocks that we mention in our educational posts. We will not be responsible for any Profit or loss that may occur due to any financial decision taken based on any data provided in this message. Do consult your investment advisor before taking any financial decisions. Stop losses should be an important part of any investment in equity.

NASDAQ Bread and Butter & Turtle Soup Example XIIaight, so im gonna break down a trade i took on nasdaq today using a setup i picked out myself from the ict concepts. just my own flavor of it, ya know
before i knock out at night, i open up the charts real quick — just tryna see if there's any clean liquidity chillin’ nearby. if there aint, i shut it down and catch some solid sleep. but if there is... bingo baby
this basically means i might just wake up rich tomorrow, bro. on the daily, im seeing two strong green days back to back, and right above that boom some equal highs just sitting there, begging to get run. they are even cleaner on the 1h. bias locked in. im waking up tomorrow and hunting longs, simple as that.
i mark up the daily open first thing. if im lookin for longs, i wanna see some turtle soup under the open. if im hunting shorts, i need that setup above the open. thats just how i roll.
if there is a swing low, trend liquidity, or some equal lows carryin over from yesterday, im locked in on those levels for turtle soup. if not, im just chillin, waitin for price to build some fresh liquidity during the day and then snatch it.
in this setup, i got some leftover liquidity from yesterday plus a clean 4h fvg sittin there like a neon sign.
next, i check the time. liquidity grabs usually hit during one of the killzones depends on the pair, but im watchin asia, london, or new york sessions.
then i scope out if there is any news droppin around that time, especially stuff that could move the pair. no point in getting blindsided.
and yeah, i always peep correlated pairs too sometimes they snitch before your chart even says a word.
when all the stars and planets line up just right, that is when I drop down to the 15m and wait for a clean csd to show up. but here is the thing i dont jump in the second i see it. i wanna see price actually leave the liquidity zone.
yeah, it might lower my rr a bit, but the win rate goes way up. It keeps me outta those fake-ass turtle soups that look good at first but just wanna wreck your stop.
once im in the trade, i usually try to close out half the position the same day take profits where the chance of price reversing is damn near zero. then i let the other half ride toward my target liquidity. just lettin it breathe, do its thing.
thats it, peace out

ETHUSD Potential long ideaThe market made an all time high at 4095.4 following the November bull run. Street money flooded premium prices trying to buy above all time highs. Once price inevitably dropped from that premium level all of the bulls who bought above premium provided not only exit liquidity for longer term traders, but also "resistance" or "supply" levels that are easily recognizable for anyone who wants to double down on their position once the market forms what appears to be a short term low. Seeing this kind of trading occur in the way that it is occurring and at the prices that it is occurring at gives me insight that the market is now going to enter ranging conditions pairing liquidity from both sides of the range.
the market goes right to 01.23.24 low at 2165 and sweeps that level eventually making its way right back to 4097.4 only $2 higher than the all time high. These 3 levels being used in this way to send the market to both sides of a trapped range is done to allow for time to pass and orders to build up.
Since the overall trend of the crypto markets and ETH in general is upward, I am assigning this behavior to institutional accumulation of discount prices. Under this assumption I will look to see a new short term low set in the market. I will see that signature begin when a short term high leads to taking out a htf discount level with an aggressive displacement lower.
I can expect to see these sweeps just above or just below key lows
Key prices to watch
- Sunday 05.18.25 low; 2325
- Friday 05.09.25 H4 +ob; 2350.9
- Daily dealing range C.E; 2271.5
- Daily + Breaker open 2081.5
- M0A_. 1732.5

The rebound is weak, is it expected to continue to decline? 📰 Impact of news:
1. Geopolitical situation
2. Pay attention to the impact of short-term trends of the US dollar and silver on gold
📈 Market analysis:
The weekly level large range sweep is still going on, with a focus on the space defense dividing line area of the 10-day moving average and the 3315-3310 area. After falling back to the lifeline in four hours, it continued to bend downward under pressure. During the sweeping decline, the suppression became more obvious. Whether there will be a wave of large-volume market, the pattern is expected to further open and guide the direction. In this process, note that the lifeline 3375 is also the resistance point determined by the last rebound last night. Use this as suppression to sweep the range below. On the whole, for the future gold, if it can maintain the rhythm of defending highs and breaking lows, and successfully closes at a low level today, then next week it is expected to further switch downwards to sweep space. Therefore, we will continue to focus on two support areas, one is 3345-3335, and the other is 3315-3310 after breaking
🏅 Trading strategies:
BUY 3345-3335
TP 3355-3365
SELL 3365-3375
TP 3345-3335-3315
If you agree with this view, or have a better idea, please leave a message in the comment area. I look forward to hearing different voices.
TVC:GOLD FXOPEN:XAUUSD FOREXCOM:XAUUSD FX:XAUUSD OANDA:XAUUSD

HYPE/USDT: Analyzing Major Buying Levels & Current RetracementPrice Action and Trend:
Since late 2024, HYPE/USDT has exhibited a volatile but generally upward-biased trend, particularly from April 2025 onwards. The initial period in late 2024 and early 2025 showed significant volatility with rapid pumps and dumps, characteristic of a nascent or highly speculative asset. A notable downtrend occurred from late February to mid-April 2025, reaching a low around the $12-$13 range. Following this, there's been a strong uptrend, with price breaking out of previous resistance levels and establishing new highs in May and June 2025, peaking near $40-$42. Currently, the price is undergoing a significant retracement from its recent highs.
Major Buying Levels (Yellow Zones):
The yellow zones on the chart clearly delineate significant demand (buying) levels:
Lowest Zone ($14.658 - $16.849) : This zone served as a strong accumulation area in late April and early May 2025. Price found substantial support here after the preceding downtrend, indicating a strong influx of buyers. This zone represents a foundational demand level where strong buying interest emerged, leading to the subsequent upward impulse.
Middle Zone ($22.303 - $25.927) : After the initial rally from the lowest zone, price consolidated and then retested this middle zone in late May 2025. The swift bounce from this area confirms its role as a significant demand zone, where buyers stepped in to prevent further declines and propel the price higher. This zone likely represents a point where early buyers took profits, and new demand entered, or previous buyers added to their positions.
Highest Zone ($30.596 - $34.316) : This most recent yellow zone became active in June 2025. After breaking through earlier resistance, price retraced into this area following its peak. The current price is hovering around the upper boundary of this zone ($34.316), indicating that buyers are attempting to defend this level. This zone signifies a crucial area where previous resistance may have flipped into support, attracting new buying interest. Its ability to hold will be critical for the continuation of the uptrend.
Supply Zones:
While not explicitly highlighted in yellow, several supply zones are evident where selling pressure intensified:
Around $27-$28 (Late 2024/Early 2025): Multiple wicks and rejections around this price range in late 2024 and early 2025 suggest a strong supply area. Price struggled to sustain above this level on several occasions, leading to pullbacks.
Around $30-$31 (Early 2025): Similar to the above, this area acted as resistance, causing price to reverse downwards after attempts to break higher.
The recent peak around $40-$42 (June 2025): This is the most significant recent supply zone. The sharp rejection from this area, marked by the long upper wick and subsequent bearish candles, indicates strong selling pressure at these elevated prices. This suggests profit-taking by earlier buyers and/or new shorting interest.
Current Price Position:
The current price of HYPE/USDT is approximately $34.345, which is at the upper boundary of the highest major buying level (yellow zone: $30.596 - $34.316). This indicates that the price has retraced significantly from its recent peak and is currently testing a crucial demand zone. The reaction at this level will be paramount in determining the immediate future direction.
Potential Future Scenarios:
Bullish Scenario: If the highest yellow zone ($30.596 - $34.316) holds as strong support, and buying pressure re-emerges, HYPE/USDT could consolidate within this zone before attempting another rally towards the recent highs ($40-$42) and potentially breaking above them. A strong bounce from this level would confirm renewed buyer confidence.
Bearish Scenario: If the current demand zone ($30.596 - $34.316) fails to hold, indicating a lack of buying interest at these levels, HYPE/USDT could see further downside. The next potential support levels would then be the middle yellow zone ($22.303 - $25.927). A break below the current zone would signal a shift in market sentiment and potentially the beginning of a deeper correction.
Key Observations:
Clear Demand Zone Effectiveness: The yellow zones have historically served as effective demand zones, leading to significant bounces and upward movements. This reinforces their importance as areas where institutional or significant retail buying has occurred.
Volatility and Wicks: The presence of long wicks (both upper and lower) indicates periods of significant price discovery and battle between buyers and sellers, especially around key levels.
Breakout and Retest Pattern: The price has shown a tendency to break out of resistance, then retest those levels (which often flip to support) before continuing its move, as seen with the middle yellow zone.
Recent Pullback: The current pullback from the highs around $40-$42 suggests profit-taking and the encounter of a strong supply zone. The ability of buyers to absorb this selling pressure at the current demand level will be a key determinant of future price action.
In summary, HYPE/USDT is at a critical juncture, testing a major buying level. The market's reaction to this demand zone will dictate whether the recent bullish momentum can be sustained or if a deeper correction is on the horizon.
