UJ longUJ is making HH's / HL's and is heading towards the next weak high.
Upcoming weak has a lot of high impact news, so I would expect a deep mitigation first before the continuation towards new higher highs.
Candlestick Analysis

Nasdaq longThe last bullish structure never did a deep mitigation, reach an demand and trade up to higher highs. Price is in a HTF consolidation, bears and bulls are pushing price between a large range at the moment.
Upcoming week will show a lot of high impact news events, I'm expecting price to continue bullish. It's a matter of time.

Stick to shorting gold and holding itAlthough gold has risen sharply to around 3375 in the short term due to the dovish remarks of Fed officials, it has not made an effective breakthrough. Therefore, gold has not reversed its trend due to the short-term rebound. Gold is still in an obvious short trend. In the short term, gold is obviously under pressure in the 3365-3375 area. If gold fails to break through this resistance area, then after gold consumes a certain amount of long energy, gold shorts will counterattack again and are expected to retreat to the 3350-3340 area again.
In the case that good news cannot support the continued rebound of gold, the market's bullish confidence will be hit again, and the short confidence will be further strengthened, stimulating gold to accelerate its decline, and it is even expected to fall below the 3350-3340 area. Therefore, in short-term trading, I still advocate shorting gold, and I am currently holding a short position in gold, and I look forward to the accelerated decline of gold as expected!

Long trade
🟢 Trade Journal Entry – Buyside Trade
📍 Pair: NZDUSD
📅 Date: Tuesday, June 17, 2025
🕒 Time: 3:00 PM (NY Session PM)
⏱ Time Frame: 1 Hour
📈 Direction: Buyside
📊 Trade Breakdown:
Entry Price 0.60143
Profit Level 0.60749 (+1.01%)
Stop Loss 0.60052 (−0.15%)
Risk-Reward
Ratio 6:66 1
🧠 Context / Trade Notes:
1HR OB Entry Zone:
Long trade taken off a bullish order block zone following prior mitigation and consolidation buildup.
Sweep of Internal Liquidity:
Entry positioned after a sweep of a short-term low and rejection off internal demand.

Perhaps 3300 or even 3280 is foreseeable!Obviously, gold is currently fluctuating downward, and in the short term, there is a certain support in the 3340-3330 area, so gold will not fall below this support area in one fell swoop, and it is still possible to rebound to the 3360-3370 area with the support of this area. If gold encounters resistance and retreats again after touching the 3360-3370 area, if there is no major good news, gold is likely to fall below the 3340-3330 area. After gold falls below this support area, the 3300 and 3280 areas are foreseeable.
So according to the above logic, I still hold a long position executed near 3345, and I am very much looking forward to gold reaching the 3360-3365 area;
If gold continues to rebound to the 3365-3375 area, I will try to short gold again; and look forward to the accelerated downward movement of gold!
The above is a preview of the performance of gold. There may be some deviations in the specific execution of transactions, because in short-term transactions, it is necessary to judge the true breakthrough and false breakthrough in advance, but I will still roughly follow the above preview process to execute the transaction! I also hope that this can provide some reference for everyone!

Nifty Analysis EOD – June 20, 2025 – Friday🟢 Nifty Analysis EOD – June 20, 2025 – Friday 🔴
🚀 Bull Run Out of the Blue 🚀 – A Masterclass in Price Action
Nifty kicked off the session with a +56-point gap-up — surprising many, especially since Gift Nifty hinted flat to negative and yesterday’s close was weak. The real jolt came when, in the very first minute, price broke above the Previous Day High (PDH) and opened directly above the CPR zone — a rare occurrence when geopolitical tensions are peaking.
As I often say:
📌 “Market rarely follows the obvious. It thrives in the unexpected.”
Today was a textbook example of that.
Luckily, we were prepped. In yesterday’s note, I mentioned the bullish trigger above 24,862 — and right from the open, Nifty respected every level, offering "hope-on" and "hope-off" trades. What seemed like a 25K test turned into a blast to 25,136, with 100 points added in the last 30 minutes, leaving even seasoned traders awestruck.
The intraday close at 25,079.75 and the adjusted close at 25,112.40 — both above the 15th May closing levels — give a bullish vibe heading into the weekend. 🤞
💬 Personal Note:
Today was special — I sat with my elder daughter, helping her understand real-time market behavior. And what a day it was! From trend reversals, cup & handle, head & shoulders, wedges, shallow pullbacks, to aggressive one-way rallies — everything aligned perfectly to make this a live-action lesson in intraday trading.
🕯 5 Min Time Frame Chart with Levels
🕯 Daily Time Frame Chart
🕯 Daily Candle Breakdown
Open: 24,787.65
High: 25,136.20
Low: 24,783.65
Close: 25,112.40
Change: +319.15 (+1.29%)
📊 Candle Structure Breakdown
Real Body: 324.75 pts → ✅ Strong Green Candle
Upper Wick: 23.80 pts
Lower Wick: 4.00 pts
🔍 Interpretation
Opened flat and never looked back.
Minimal wicks = clear directional strength.
Buyers in full control from open to close.
🕯 Candle Type
📈 Bullish Marubozu-like — One of the strongest bullish signals. A powerful sign of trend continuation or breakout momentum.
📌 Key Insight
Today’s candle reinforces bullish strength.
Holding above 25,100 is key going forward.
A move above 25,136 could invite fresh upside targets — possibly 25,180+ and beyond.
🛡 5 Min Intraday Chart
⚔️ Gladiator Strategy Update
ATR: 251.32
IB Range: 116.6 → Medium IB
Market Structure: 📈 ImBalanced
Trades Triggered:
🔹 9:41 AM – Long Trade → Target Achieved (Trailing Exit, R:R 1:4.79)
🔹 12:18 PM – Short Contra Trade → Target Achieved (R:R 1:2)
🔹 1:07 PM – Long Trade → Target Achieved (Trailing Exit, R:R 1:2.62)
📌 Support & Resistance Zones
Resistance Levels
25,125 ~ 25,150
25,180 ~ 25,212
25,285
Support Levels
25,080 ~ 25,060
25,000 ~ 24,980
24,965
24,894 ~ 24,882
💭 Final Thoughts
The market surprised today — not just in movement but in clarity.The clean break, follow-through strength, and intraday structure hint at momentum continuation — but weekends can bring surprise news.
📌 Watch 25,100 as line in the sand on Monday.
🧠 “Markets are teachers. Today’s lesson? Expect the unexpected, but prepare like it’s already here.”
✏️ Disclaimer
This is just my personal viewpoint. Always consult your financial advisor before taking any action.

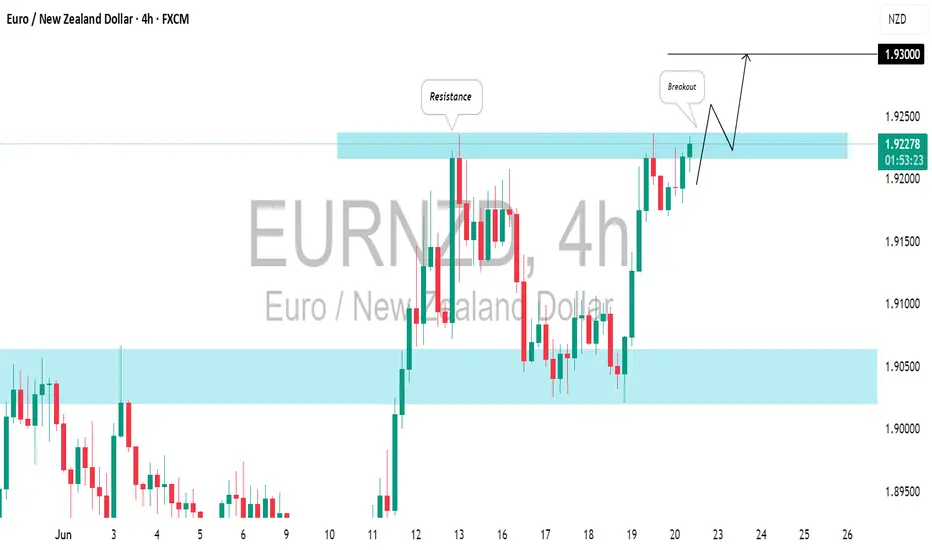
EURNZD: Waiting For Another BreakoutBased on the current trend, I believe you would concur that ⚠️EURNZD is likely to keep rising.
A bullish breakout above the highlighted blue resistance and a 4H candle closing above 1.9240 would
serve as a key confirmation, potentially driving prices up to 1.9300.
A glimmer of hope for bullish lovers!Gold is currently dominated by bears, but thanks to the support of risk aversion caused by geopolitical conflicts, gold has shown a certain degree of resistance to decline while falling. Therefore, the current market direction is very clear, with weak and volatile downward movement. But under this market situation, we cannot short gold excessively. We can only wait for it to rebound to the pressure level and then short gold, or try to go long on gold with strong support.
At present, gold has touched the 3350 area again, which has a certain support effect. If gold cannot effectively fall below 3350, then gold may still rebound to the 3370-3380 area again; but once gold effectively breaks the support near 3350, gold is expected to continue to fall to the 3340-3330 area.
In terms of short-term trading, I think it is possible to consider starting to try to go long on gold in batches in the 3350-3330 area, TP: 3365-3375

BTC/USDT Technical Analysis, 2025-06-18 09:45 UTC📘 BTC/USDT Scalping Setup – Whale-Assisted Dip Buy
This strategy is designed for high-precision, short-term long trades on BTC/USDT using the 15-minute chart. It targets oversold conditions with signs of reversal, confirmed by whale activity, volume spikes, and key support levels.
The edge comes from combining retail technicals (RSI, Stoch, MACD, candlestick patterns) with institutional confirmation (order flow, OBV, and large bids from whales).
✅ Key Strategy Components:
Oversold Technicals: RSI and Stochastic suggest price exhaustion.
Support Zone Alignment: Price is dipping near major support (pivot S1 or local low).
Reversal Candlestick: Clean bullish signals like Hammer or Engulfing show shift in sentiment.
Smart Money Confirmation:
Whale buyers (>5 BTC bids)
Bid dominance (>3%)
OBV rising = silent accumulation
Timing is Critical: Trades are only taken in the first 2 minutes of the 5-min candle with a volume burst.
🎯 Trade Management
Entry: On close of confirming candle (when all criteria align)
Take Profit: +1.2% (or ~1200 pts)
Stop Loss: -0.6% (or ~600 pts)
Risk/Reward: 1:2
📈 Why This Works
This is not just a basic RSI/Stochastic play — it’s a multi-confirmation strategy tuned for whale detection, volume acceleration, and institutional footprints. It’s ideal for high-volatility sessions and works best in range or retracement phases of a broader uptrend.
⚠️ Pro Tips
Avoid entries during extreme news volatility
Be disciplined – all filters must align (this is a precision setup)

Long trade
🟢 Trade Journal Entry – Buyside Trade
📍 Pair: AUDUSD
📅 Date: Tuesday, June 17, 2025
🕒 Time: 3:00 PM (NY Session PM)
⏱ Time Frame: 1 Hour
📈 Direction: Buyside
📊 Trade Breakdown:
Entry Price 0.64738
Profit Level 0.65380 (+0.99%)
Stop Loss 0.64639 (−0.15%)
Risk-Reward
Ratio 6.48 : 1
🧠 Context / Trade Notes:
1HR TF Execution:
Entry aligned with bullish OB on the 1hr chart following a clean mitigation and rejection candle.
Stacked Confluences:
Liquidity sweep, OB retest, and session timing aligned for a high-conviction buyside setup.

Long trade
📍 Pair: EURUSD
📅 Date: Tuesday, June 17, 2025
🕒 Time: 3:00 PM (NY Session PM)
⏱ Time Frame: 1 Hour
📈 Direction: Buyside
📊 Trade Breakdown:
Entry Price 1.14816
Profit Level 1.15696 (+0.77%)
Stop Loss 1.14640 (−0.15%)
Risk-Reward
Ratio 5:1
🧠 Context / Trade Notes:
1H Structure Entry:
Trade initiated at a key bullish order block on the 1hr timeframe, following higher-timeframe trend alignment.

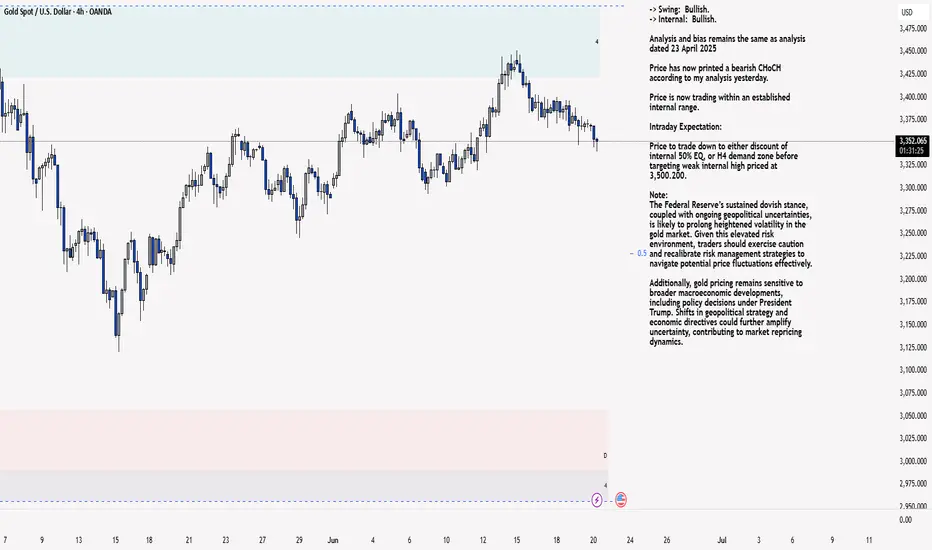
XAU/USD 20 June 2025 Intraday AnalysisH4 Analysis:
-> Swing: Bullish.
-> Internal: Bullish.
Analysis and bias remains the same as analysis dated 23 April 2025
Price has now printed a bearish CHoCH according to my analysis yesterday.
Price is now trading within an established internal range.
Intraday Expectation:
Price to trade down to either discount of internal 50% EQ, or H4 demand zone before targeting weak internal high priced at 3,500.200.
Note:
The Federal Reserve’s sustained dovish stance, coupled with ongoing geopolitical uncertainties, is likely to prolong heightened volatility in the gold market. Given this elevated risk environment, traders should exercise caution and recalibrate risk management strategies to navigate potential price fluctuations effectively.
Additionally, gold pricing remains sensitive to broader macroeconomic developments, including policy decisions under President Trump. Shifts in geopolitical strategy and economic directives could further amplify uncertainty, contributing to market repricing dynamics.
H4 Chart:
M15 Analysis:
-> Swing: Bullish.
-> Internal: Bullish.
Following previous high, and printing of bearish CHoCH, price has pulled back to an M15 supply zone, where we are currently seeing a reaction. Therefore, I shall now confirm internal high.
Price is now trading within an established internal range.
The remainder of my analysis shall remain the same as analysis dated 13 June 2025, apart from target price.
As per my analysis dated 22 May 2025 whereby I mentioned price can be seen to be reacting at discount of 50% EQ on H4 timeframe, therefore, it is a viable alternative that price could potentially print a bullish iBOS on M15 timeframe despite internal structure being bearish.
Price has printed a bullish iBOS followed by a bearish CHoCH, which indicates, but does not confirm, bearish pullback phase initiation. I will however continue to monitor, with respect to depth of pullback.
Intraday Expectation:
Price to continue bearish, react at either M15 supply zone, or discount of 50% internal EQ before targeting weak internal high priced at 3,451.375.
Note:
Gold remains highly volatile amid the Federal Reserve's continued dovish stance, persistent and escalating geopolitical uncertainties. Traders should implement robust risk management strategies and remain vigilant, as price swings may become more pronounced in this elevated volatility environment.
Additionally, President Trump’s recent tariff announcements are expected to further amplify market turbulence, potentially triggering sharp price fluctuations and whipsaws.
M15 Chart:
The bear market is over? Short at high and long at low📰 Impact of news:
1. The interest rate remains unchanged and leads to new lows in the short term
2. Geopolitical tensions provide support for risk aversion
📈 Market analysis:
Due to the early closing yesterday, the volatility of the US market was limited and the market seemed relatively flat. From a technical perspective and the current trend, 3340 is a key defensive support level. If it retreats to this level, you can consider going long. If the gold price continues to rise and reaches 3375, from the perspective of trading strategy, you can choose to place a short order here. Focus on the resistance line of 3370-3375 during the day, and pay attention to the support of 3345-3335 below.
🏅 Trading strategies:
SELL 3370-3375
TP 3360-3355-3345
BUY 3345-3335
TP 3360-3370
If you agree with this view, or have a better idea, please leave a message in the comment area. I look forward to hearing different voices.
OANDA:XAUUSD FX:XAUUSD FOREXCOM:XAUUSD FXOPEN:XAUUSD TVC:GOLD

EURUSD: Deciding Point for Bearish BiasCurrent Price at Critical Resistance : The price action is currently challenging a significant downward-sloping resistance channel (highlighted in red). This zone has historically acted as a ceiling for price movements, and the current location is explicitly labeled as a "Decider for Breakdown," indicating a pivotal point for future direction.
Implied Bearish Bias : The overall sentiment indicated by the chart's title "At deciding Level, Mostly Bearish" suggests a lean towards downside continuation, although the price is currently pushing against resistance.
Identified Support Confluence : Below the current price, a layered support structure is identified. This includes an upward-sloping "Trend Line Support" channel (green) and a prominent horizontal "POC" (Point of Control), likely derived from volume profile analysis, both residing within a broader "Support Area" (green shaded zone).
Potential Future Pathways : Two immediate potential scenarios: a bearish continuation (red dotted path) if the current resistance holds and lower support levels are broken, or a bullish reversal (green dotted path) if the price successfully breaks above the descending resistance channel.
Swing Structure Visibility : Its kind of Flag and Pole pattern on larger picture, but there is also downward trending line. Purple line indicates the overall market structure interpretation.
Disclaimer:
The information provided in this chart is for educational and informational purposes only and should not be considered as investment advice. Trading and investing involve substantial risk and are not suitable for every investor. You should carefully consider your financial situation and consult with a financial advisor before making any investment decisions. The creator of this chart does not guarantee any specific outcome or profit and is not responsible for any losses incurred as a result of using this information. Past performance is not indicative of future results. Use this information at your own risk. This chart has been created for my own improvement in Trading and Investment Analysis. Please do your own analysis before any investments.

Upon reaching PDL price
Previous Day rejected the previous day's low.
When price reaches PDL if price shows a bullish CHOCH to the upside
there could be a bullish orderflow change @ near previous day low's
Could be a good long entry towards previous day high

The market is closed today. How to arrange gold in the evening?📰 Impact of news:
1. The interest rate remains unchanged and leads to new lows in the short term
2. Geopolitical tensions provide support for risk aversion
📈 Market analysis:
The market is expected to not fluctuate much today. Generally speaking, it is difficult to stand on one foot to form a short-term bottom. There should be a second wave of bottom exploration, a secondary low point, and then the bottom is explored and pulled up to break through the previous high point. Only then can the turning point be officially established and the decline end. Moreover, the 1H moving average is spreading downward. Therefore, in the short term, we still pay attention to the 3375-3385 line of resistance and the 3360-3355 line of support below.
🏅 Trading strategies:
SELL 3375-3385
TP 3365-3360-3355
BUY 3360-3355
TP 3370-3380-3405-3420
If you agree with this view, or have a better idea, please leave a message in the comment area. I look forward to hearing different voices.
TVC:GOLD FXOPEN:XAUUSD FOREXCOM:XAUUSD FX:XAUUSD OANDA:XAUUSD

Continue to short gold after the reboundGold has currently hit a low of around 3347, and rebounded after slightly breaking through 3350. It has now rebounded to around 3370. Will gold continue to rebound and hit 3400 again?
I think it is unlikely that gold will continue to rebound and hit 3400 in the short term. From a fundamental perspective, many of the news leaked out about the situation in the Middle East are untrue, and the conflict has not escalated further, so gold has not reacted much to this; and as market expectations for interest rate cuts decrease, the impact of news supporting gold's upward trend is gradually weakening;
From the current structure, since gold fell below 3370, bears have completely taken the upper hand. Although gold has rebounded from around 3347, it is only a short-term technical repair and oversold rebound from a structural perspective, and it cannot be said that it is a restart of bulls. So I think gold still has the risk of a second decline after the rebound, and once gold falls again, it may trigger a large number of profit-taking orders and a large number of short-sellers to enter the market.
As the center of gravity of gold shifts downward, the short-term resistance area moves down to 3380-3390; the current support area below is near 3350, followed by 3335. So for short-term trading, I still prefer gold short trading, and we can continue to short gold with this short-term resistance area.

AUDNZD: Intraday Bearish Move Ahead?! 🇦🇺🇳🇿
AUDNZD nicely reacted to a key horizontal resistance level.
The price formed a bearish CHoCH on an hourly time frame
after its test.
I expect a retracement to 1.086 level.
❤️Please, support my work with like, thank you!❤️
I am part of Trade Nation's Influencer program and receive a monthly fee for using their TradingView charts in my analysis.

Nifty Analysis EOD – June 19, 2025 – Thursday🟢 Nifty Analysis EOD – June 19, 2025 – Thursday 🔴
📉 Bookish Spinning Top Doji – Another Day of Indecision on Expiry
Nifty opened with a mild +16-point gap-up and immediately dipped to test the Previous Day Low (PDL), marking the day low at 24,738.10. A quick reversal took the index 125 points higher, reaching a high of 24,863, only to settle back into theta-eating mode around VWAP.
Just as things looked ready to turn, a 13:50 breakout attempt fizzled as the price faced rejection above the CPR zone, leading to a final dip below the previous low, touching a new intraday low at 24,733.
Though the intraday close was at 24,744.70, the settlement close was 24,793.25 — a 47.65-point difference that’s not trivial, especially on expiry day.
The entire day remained a narrow-range, rollercoaster ride — clearly showing neither bulls nor bears could take charge. The total range was just 130 points, forming a textbook Spinning Top, which reflects market contraction.
📌 Now what?
Keep a close eye on the range:
🟢Bullish Breakout ➤ above 24,862 (CDH)
🔴Bearish Breakdown ➤ below 24,733 (CDL)
The squeeze is on. Expansion is near.
🕯 5 Min Time Frame Chart with Levels
🕯 Daily Time Frame Chart
🕯 Daily Candle Breakdown
Open: 24,803.25
High: 24,863.10
Low: 24,733.40
Close: 24,793.25
Change: −18.80 (−0.08%)
📊 Candle Structure Breakdown
Real Body: 10.00 pts → 🔻 Small Red Candle
Upper Wick: 59.85 pts
Lower Wick: 59.85 pts
🔍 Interpretation
Equal wicks show balanced buying and selling.
Small real body signals strong indecision.
Intraday volatility was neutral despite expiry impact.
🕯 Candle Type
⚖️ Perfect Spinning Top / Doji-like Candle – Indicates market contraction, waiting for directional resolution.
📌 Key Insight
The market continues its tight range-bound structure.
Any breakout beyond 24,865 or breakdown below 24,730 could trigger directional moves.
Till then: “Wait and watch mode.”
🛡 5 Min Intraday Chart
⚔️ Gladiator Strategy Update
ATR: 240.08
IB Range: 125.00 → Medium IB
Market Structure: ⚖️ Balanced
Trades:🚫 No Trade Triggered by System
📌 Support & Resistance Zones
Resistance Levels
24,894 ~ 24,882
24,972 ~ 25,000
25,060 ~ 25,080
25,102 ~ 25,125
Support Levels
24,825 ~ 24,847
24,725 ~ 24,735
24,660
24,590
💭 Final Thoughts
The market is compressing like a coiled spring.Spinning tops near resistance often signal upcoming volatility.Let the breakout come to you — don’t pre-empt, participate.
🧠 “When the market sleeps in narrow ranges, it dreams of big moves.”
✏️ Disclaimer
This is just my personal viewpoint. Always consult your financial advisor before taking any action.

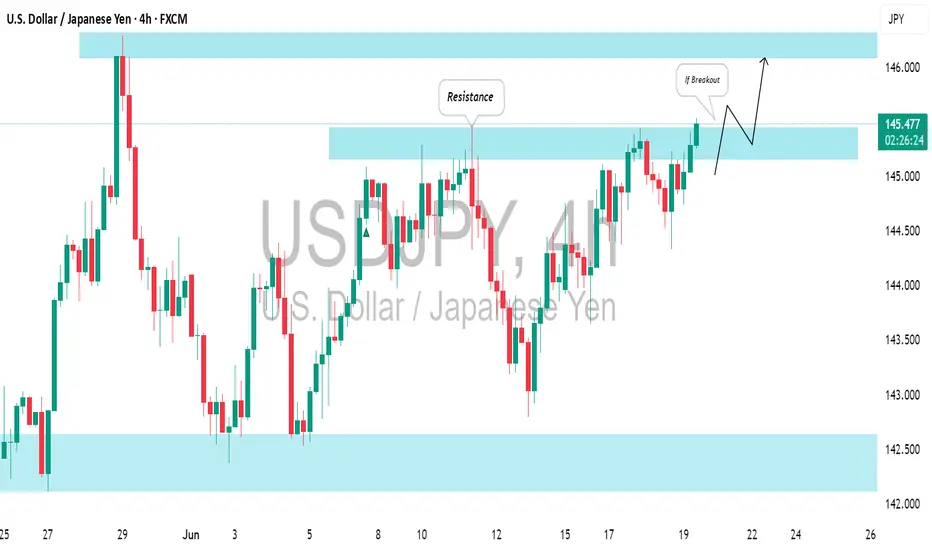
USDJPY: Waiting For a Breakout to Buy⚠️USDJPY is in a strong bullish trend on an intraday chart and is currently testing a significant horizontal resistance.
I'm looking for a breakout, specifically a 4-hour candle closing above it, to enter a buy position.
A bullish break of the highlighted blue area will provide a strong signal, potentially driving prices up to the 146.10 resistance level.
GBPCAD SHORTMarket structure bearish on HTFS DH
entry at Daily AOi
Weekly Rejection at AOi
Daily Rejection at AOi
Daily EMA retest
Previous Structure point Daily
Around Psychological Level 1.85000
H4 EMA retest
H4 Candlestick rejection
Rejection from Previous structure
Levels 3.77
Entry 95%
REMEMBER : Trading is a Game Of Probability
: Manage Your Risk
: Be Patient
: Every Moment Is Unique
: Rinse, Wash, Repeat!
: Christ is King.

GBPCHF SHORTMarket structure bearish on HTFs 3
Entry at both Weekly and Daily AOi
Weekly Rejection At AOi
Daily Rejection at AOi
Previous Structure point Daily
Around Psychological Level 1.10500
H4 EMA retest
H4 Candlestick rejection
Rejection from Previous structure
Levels 4.17
Entry 110%
REMEMBER : Trading is a Game Of Probability
: Manage Your Risk
: Be Patient
: Every Moment Is Unique
: Rinse, Wash, Repeat!
: Christ is King.

Ethereum Daily Chart = Coiled SpringSitting on the 200 EMA.
3x liquidity sweeps below — no breakdown.
Red dots stacking above = pressure cooker.
📉 Break $2.45K → dump
🚀 Break $2.7K → $3K squeeze
Big move coming. Don’t blink.
