Nifty Analysis EOD – June 17, 2025 – Tuesday🟢 Nifty Analysis EOD – June 17, 2025 – Tuesday 🔴
⚠️ Resistance Rejection at 25K – Pause or Warning Sign?
Yesterday’s note rightly anticipated today’s challenge near 25K — and that’s exactly how the session unfolded.
Nifty opened at 24,977.85, right inside the critical resistance zone of 24,972–25,000, and formed a near O=H (Open = High) structure. The index quickly lost ground, dropping 135 points within the first hour to mark a day low of 24,813.70, forming a medium-sized Initial Balance (IB) within a wide CPR — conditions known for range-bound or tricky days.
Throughout the session, Nifty hovered largely inside the CPR and IB, with a false breakdown attempt around 12:50 PM. Such setups (wide CPR + higher value + medium IB) often result in false moves or low-conviction sessions, and today was no exception.
By day’s end, Nifty closed at 24,853.40, logging a modest −93.10 point dip, forming what can be termed as a healthy pullback — but the real test remains.
If bulls want to take charge again, they must breach and close above 25,025. On the flip side, if 24,800–24,820 gives way, it could trigger a slide toward 24,725 and 24,660 in the coming sessions.
🕯 Daily Time Frame Chart
🕯 Daily Candle Breakdown
Open: 24,977.85
High: 24,982.05
Low: 24,813.70
Close: 24,853.40
Change: −93.10 (−0.37%)
📊 Candle Structure Breakdown
Real Body: 124.45 pts → 🔻 Red Candle
Upper Wick: 4.20 pts
Lower Wick: 39.70 pts
🔍 Interpretation
Opened near the day’s high but selling dominated soon after.
Small upper wick shows minimal buyer strength; recovery attempts were mild.
Lower wick indicates some support emerged at day’s low, but overall tone remained bearish.
🕯 Candle Type
🟥 Bearish Candle – strong real body, minor lower wick — reflects steady intraday selling, though not overly aggressive.
📌 Key Insight
Nifty has now rejected the 25K zone two days in a row, turning it into short-term resistance.
If 24,800 breaks, expect pressure to mount — next watch: 24,725 → 24,660.
Bulls need a close above 25,025 to regain command.
🛡 5 Min Intraday Chart
⚔️ Gladiator Strategy Update
ATR: 258.48
IB Range: 131.60 → Medium IB
Market Structure: ⚖️ Balanced
Trades:🚫 No Trade Triggered by System
📌 Support & Resistance Zones
Resistance Levels
24,894 ~ 24,882
24,972 ~ 25,000
25,060 ~ 25,080
25,102 ~ 25,125
Support Levels
24,825 ~ 24,847
24,725 ~ 24,735
24,660
24,590
💭 Final Thoughts
Today’s session didn’t break anything major — but it also didn’t conquer anything new.Stuck between major support and resistance, the index is coiling for a move. Bulls have the burden of proof now.
🧠 “Markets don’t pause forever — compression leads to expansion. Be ready when it chooses its direction.”
✏️ Disclaimer
This is just my personal viewpoint. Always consult your financial advisor before taking any action.
Candlestick Analysis

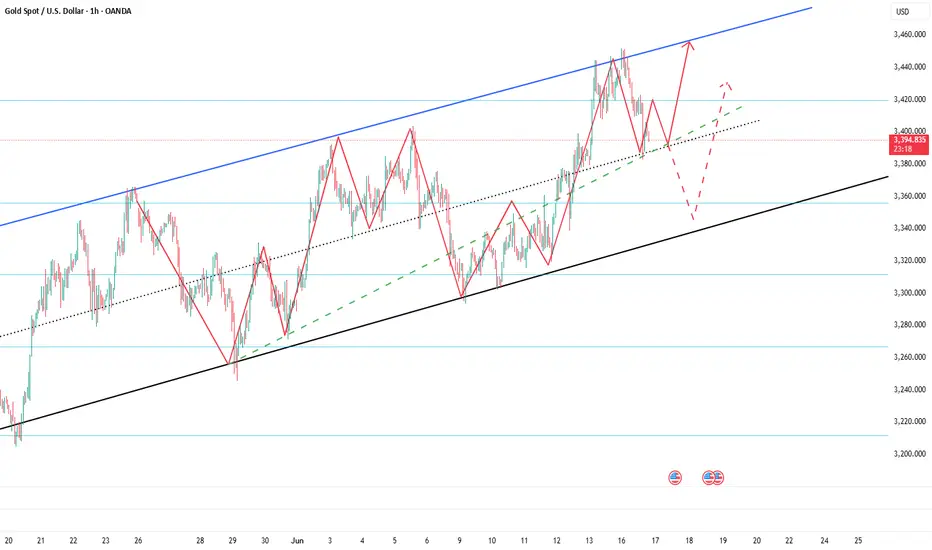
Continue to try to short gold,It's expected to touch 3355-3345 Gold has broken through 3380 twice, but recovered quickly, indicating that the bulls still have some defensive power. At present, gold has touched 3400 again; it can be seen that the bulls' potential defense is still good, but it is not enough to support the continued rebound of gold in the short term. Obviously, gold is still under pressure in the 3410-3420 area in the short term. If gold cannot break through this resistance area in the short term, gold may continue to maintain a volatile state and continue to seek strong support downward. Only after gold breaks through the 3410-3420 area, it is expected to continue to rise and touch the area near 3450 again.
When gold tested the support near 3380 several times during the day and tried to break through this area, after gold failed to break through the 3410-3420 area in the short term, I think gold will be more likely to choose a downward direction, or even continue to test the 3355-3345 area. Therefore, for short-term trading, before breaking through the 3410-3420 area, we should not chase gold too much, and we can try to short gold in this area appropriately.

GBPCHF: Bearish Movement After Breakout📉GBPCHF appears to be bearish following a breakout of a significant daily support level.
After retesting this broken structure, the pair formed an inverted cup and handle pattern, and we are now seeing the test of the broken neckline.
A downward movement towards 1.1006 is anticipated.

Resistance zones and Geo-political instability acting up.Geo-Political instability and resistance zone are acting up together to stop Nifty and not allowing it to close above 25K. As the world is looking at developments in Iran Vs Israel conflict with beated heart market today gave up some gains from yesterday. The only index looking strong is IT index right now. Avoid taking very long positions unless you are very sure of the company. Yesterday also Nifty failed to close above 25K opened briefly near 25K today and then moved downwards. Lot will be decided in the short term by the developments that happen tonight. Important G7 meet and US Federal reserve Rate Cut meet is also to happen later in the week. These 2 global factors will decide fate of the market in the short term. Local factors are all in line and nothing to worry for Indian markets on that front.
The supports for Nifty remain at: 24713 (Trend line support), 24425 (Mother line support of Daily chart), next support is near 23917, 23806 (Father line support of daily chart is in place). Closing below 23906 can lead to further down side and in such a scenario Nifty can fall further towards 23500 or 23047 levels. If we get a closing below that we will give updates regarding the same.
Resistances for Nifty remain at: 24982 (Today's high), 25112 and trend line resistance of 25251. When we get a closing above 25251 we will update you regarding the further upward resistnace levels.
Disclaimer: The above information is provided for educational purpose, analysis and paper trading only. Please don't treat this as a buy or sell recommendation for the stock or index. The Techno-Funda analysis is based on data that is more than 3 months old. Supports and Resistances are determined by historic past peaks and Valley in the chart. Many other indicators and patterns like EMA, RSI, MACD, Volumes, Fibonacci, parallel channel etc. use historic data which is 3 months or older cyclical points. There is no guarantee they will work in future as markets are highly volatile and swings in prices are also due to macro and micro factors based on actions taken by the company as well as region and global events. Equity investment is subject to risks. I or my clients or family members might have positions in the stocks that we mention in our educational posts. We will not be responsible for any Profit or loss that may occur due to any financial decision taken based on any data provided in this message. Do consult your investment advisor before taking any financial decisions. Stop losses should be an important part of any investment in equity.

USDT Dominance SHOWDOWN INCOMINGAfter a full liquidity sweep at 4.50%, USDT.D is now pressing into the EMA cluster from below…
📊 What does that mean?
➡️ Stablecoin dominance is rising = risk-off behavior creeping in
➡️ But we’re STILL under trend — and that green dot sweep could mean a fakeout bottom
🧠 If USDT.D breaks above EMAs → altcoins bleed
🔥 If USDT.D gets rejected here → altcoins pump hard
This is the pivot. Watch closely.

Forward-looking trading, focus on 3380 support📰 Impact of news:
1. Geopolitical tensions in the Middle East
2. Iran nuclear talks
3. Retail sales data
📈 Market analysis:
Gold prices are currently in a narrow range of fluctuations again, and the signal of Iran restarting nuclear negotiations has weakened risk aversion, triggering a correction in gold prices during the session, but tensions in the Middle East remain an uncertain factor. In the short term, we still need to focus on the breakthrough of the 3380 support line. If the 3380 support line is strong, we can still maintain a long trading idea in the short term and look to 3400. On the contrary, once it falls below, it is expected to look to the 3350 line. Pay attention to the breakthrough of 3400 on the upside. If the Asian and European sessions cannot effectively break through this short-term resistance, gold will continue to fluctuate.
🏅 Trading strategies:
BUY 3380-3370
TP 3390-3400-3450
SELL 3400-3390
TP 3380-3370-3350
If you agree with this view, or have a better idea, please leave a message in the comment area. I look forward to hearing different voices.
OANDA:XAUUSD FX:XAUUSD FOREXCOM:XAUUSD FXOPEN:XAUUSD TVC:GOLD

GOLD (XAUUSD): Your Trading Plan Explained⚠️GOLD is currently at a crucial daily horizontal support level.
It is consolidating within a horizontal range on the 4-hour chart, showing a positive bullish reaction and testing the range's resistance.
A breakout above this resistance with a 4-hour candle close would signal strong bullish momentum, potentially leading to further gains, with the next target at 3437.
Conversely, a bearish breakout below the support could initiate a downward movement.

USD/ CAD Trade plan ???From the chart level you can plan sell if price come to our selling area . then after 5min coch or 15 min red candle

AUDCAD: Pullback From Resistance Confirmed 🇦🇺🇨🇦
AUDCAD is going to retrace from a key intraday horizontal resistance.
A local bearish CHoCH and an imbalance on an hourly time frame
provide a strong bearish confirmation.
Goal - 0.88445
❤️Please, support my work with like, thank you!❤️
I am part of Trade Nation's Influencer program and receive a monthly fee for using their TradingView charts in my analysis.


intraday-swing buy continuationlarge specs are long chf
bullish structure
irl-erl liquidity target
POI: ob


Short gold, it needs to retreat to the area around 3350!Gold is currently testing the support near 3380 again. According to the current trend of gold, gold is likely to break through 3380, and gold has stopped near 3400 many times during the rebound process, and the rebound strength of gold is lacking. If gold really wants to rebound, then after testing near 3380 many times and getting support at 3390, it should have rebounded to the 3410-3420 area, but it is obvious that gold has not yet touched the 3410-3420 area. Therefore, gold's performance is relatively weak and its correction trend should continue for now.
In terms of fundamentals, Iran is not decisive in its retaliatory behavior, so if the conflict in the Middle East does not escalate, gold may find it difficult to continue to rise. So according to the current trend and performance of gold, we should not be stubborn in long gold trading for the time being, and adjust our trading plan reasonably according to the market and price behavior. If gold continues to retreat, the first thing we need to pay attention to below is the 3355-3345 area, followed by the area near 3330. So for the next short-term trading, we can try to short gold in the 3395-3405 area.

XAU/USD 17 June 2025 Intraday AnalysisH4 Analysis:
-> Swing: Bullish.
-> Internal: Bullish.
Analysis and bias remains the same as analysis dated 23 April 2025
Price has now printed a bearish CHoCH according to my analysis yesterday.
Price is now trading within an established internal range.
Intraday Expectation:
Price to trade down to either discount of internal 50% EQ, or H4 demand zone before targeting weak internal high priced at 3,500.200.
Note:
The Federal Reserve’s sustained dovish stance, coupled with ongoing geopolitical uncertainties, is likely to prolong heightened volatility in the gold market. Given this elevated risk environment, traders should exercise caution and recalibrate risk management strategies to navigate potential price fluctuations effectively.
Additionally, gold pricing remains sensitive to broader macroeconomic developments, including policy decisions under President Trump. Shifts in geopolitical strategy and economic directives could further amplify uncertainty, contributing to market repricing dynamics.
H4 Chart:
M15 Analysis:
-> Swing: Bullish.
-> Internal: Bullish.
Following previous high, and printing of bearish CHoCH, price has pulled back to an M15 supply zone, where we are currently seeing a reaction. Therefore, I shall now confirm internal high.
Price is now trading within an established internal range.
The remainder of my analysis shall remain the same as analysis dated 13 June 2025, apart from target price.
As per my analysis dated 22 May 2025 whereby I mentioned price can be seen to be reacting at discount of 50% EQ on H4 timeframe, therefore, it is a viable alternative that price could potentially print a bullish iBOS on M15 timeframe despite internal structure being bearish.
Price has printed a bullish iBOS followed by a bearish CHoCH, which indicates, but does not confirm, bearish pullback phase initiation. I will however continue to monitor, with respect to depth of pullback.
Intraday Expectation:
Price to continue bearish, react at either M15 supply zone, or discount of 50% internal EQ before targeting weak internal high priced at 3,451.375.
Note:
Gold remains highly volatile amid the Federal Reserve's continued dovish stance, persistent and escalating geopolitical uncertainties. Traders should implement robust risk management strategies and remain vigilant, as price swings may become more pronounced in this elevated volatility environment.
Additionally, President Trump’s recent tariff announcements are expected to further amplify market turbulence, potentially triggering sharp price fluctuations and whipsaws.
M15 Chart:

Platinum for a short?after a bullish run, the fundamentals on platinum have shifted sharply into bearish bias, aligning perfectly with a key weekly supply zone. The recent weekly rejection candle confirms seller presence and validates the zone.

Gold is expected to hit 3410-3420 againBecause of the news that Iran hopes to ease the hostile relationship with Israel, gold fell sharply in the short term, then rebounded after touching 3383, and quickly recovered above 3390. From this point of view, the buying support below is strong, and the market sentiment is still high, which limits the downside of gold, and the support of 3390-3380 area is still valid.
Although the bullish momentum of gold has weakened relatively due to the retracement in the short term, as long as gold remains above 3380, it still maintains a strong upward structure; and the retracement only exacerbates the short-term shock trend. Gold is still likely to maintain a shock upward structure and try to touch the 3410-3420 area again. Once gold breaks through 3420 strongly, it is expected to hit the area near 3450 again.
So for short-term trading, I still hold a long position in gold, and there is still a certain profit now. I have to say that if gold can reach the 3410-3420 area as expected, our profits will increase significantly!
AUD/JPY Bulls Eye 95+ After Bullish ReversalAUD/JPY bounced sharply on Thursday, snapping a 3-day losing streak with a solid bullish-range session. The rally kicked off from a bullish pinbar above 92, where the higher low reinforces support and the broader bullish case.
The 1-hour chart shows a clean breakout from an inverted head and shoulders pattern, pointing to a target around 95.50. With resistance at the April high (95.30), March high (95.75), and the 96 handle, there’s still room for bulls to run.
Dips toward 94 may offer opportunities to join the trend — but a break back below the neckline would shift the tone back to risk-off.
Matt Simpson, Market Analyst at City Index and Forex.com

EURJPY ANALYSISFrom the previous trading day we see that the pair closed bullish and the 4hr and 1hr making HH and HL, which are confirmation of a bullish trend type move.

GBPUSD ANALYSIS After seeing how the previous daily candle close bullish and the 4hr structure make a retracement to a key level of 1.35626, we could be looking for another push leg up to make a new HH on the 4hr but waiting for confirmation on the daily timeframe.

USDJPY Wave Analysis – 16 June 2025
- USDJPY reversed from the support zone
- Likely to rise to the resistance level 146.00
USDJPY currency pair recently reversed from the support zone surrounding the pivotal support level 142.50, which has been reversing the price from the start of August.
The upward reversal from the support level 142.50 created the daily Japanese candlesticks reversal pattern Piercing Line.
USDJPY currency pair can be expected to rise to the next resistance level 146.00 (top of the previous correction 2 from last month).

3400 3380 are the two points that determine the trend of gold📰 Impact of news:
1. Geopolitical risks
2. Expected Fed policy
📈 Market analysis:
This week, the Federal Reserve's policy meeting, retail sales data, initial jobless claims and geopolitical situation will be the core factors affecting global markets. In the short term, gold rebounded after hitting the 3383 line. This round of decline was relatively rapid. At the same time, there is a certain resistance at the 3405-3410 line above in the short term, which is also the main reason for our long orders to leave the market. In the short term, it is recommended to first look at the support situation at the 3380 line below, and then enter the long order after obtaining effective support above this position. On the contrary, if it falls below this short-term support, the gold price is expected to fall to the 3350 mark! For the evening layout, it is recommended to focus on the 3400 long-short watershed, pay attention to the 3410 line of resistance, and pay attention to the 3380 line of support below.
🏅 Trading strategies:
BUY 3390-3380
TP 3400-3410-3420
SELL 3400-3390
TP 3380-3360-3350
If you agree with this view, or have a better idea, please leave a message in the comment area. I look forward to hearing different voices.
TVC:GOLD FXOPEN:XAUUSD FOREXCOM:XAUUSD FX:XAUUSD OANDA:XAUUSD

Silver Swing plan trade .???if price come to this level then you can plan trade by 15 min candlestick confirm like( Engulfing, evening star, etc) or buy after 5min Coch

Gold bulls may restart at any time, buy gold!Although compared with the performance of gold during the day, gold only touched 3452 and then began to retreat, and even failed to approach the previous high of 3500, gold is not strong; but based on the current fundamentals and technical structure, gold is currently in a very strong bullish structure; so I think the gold retracement is not a sign of gold weakness, but to increase liquidity, so that gold can rise better and prepare in advance for breaking through 3500! Gold bulls are ready to restart at any time after the retracement!
So for short-term trading, I don’t think the gold retracement is a reason for weakness, nor is it a certificate for chasing short gold; on the contrary, I think the gold retracement is a good time to buy on dips; first of all, the support area we have to pay attention to is the 3410-3400 area, and the second must pay attention to the 3390-3380 area support.
So in the next transaction, we might as well use these two support areas as defense and start to go long on gold in batches!
