DOW JONES INDEX (US30): Pullback From Support
US30 shows some strength after a test of a key intraday support.
A cup and handle pattern on that and a violation of its neckline
indicate a local strength of the buyers.
I expect a pullback to 42550
❤️Please, support my work with like, thank you!❤️
I am part of Trade Nation's Influencer program and receive a monthly fee for using their TradingView charts in my analysis.
Candlestick Analysis

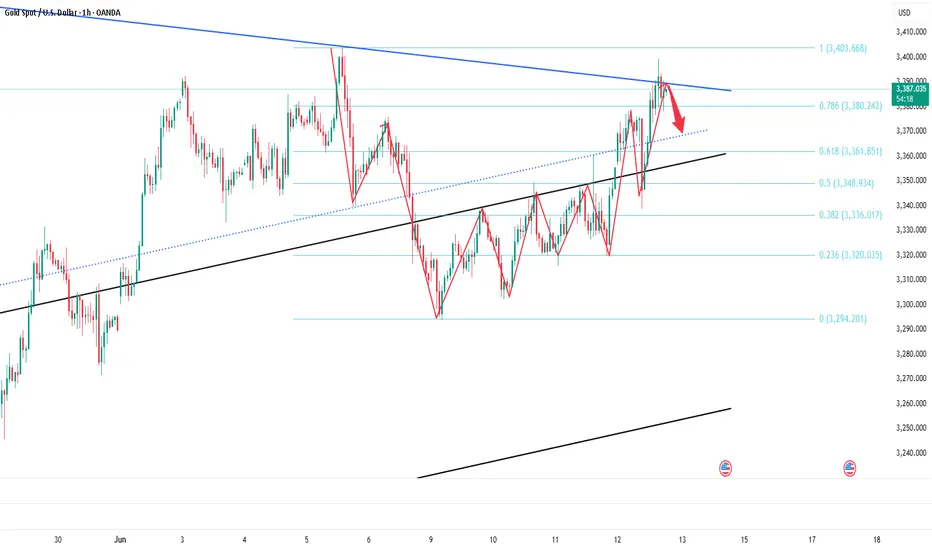
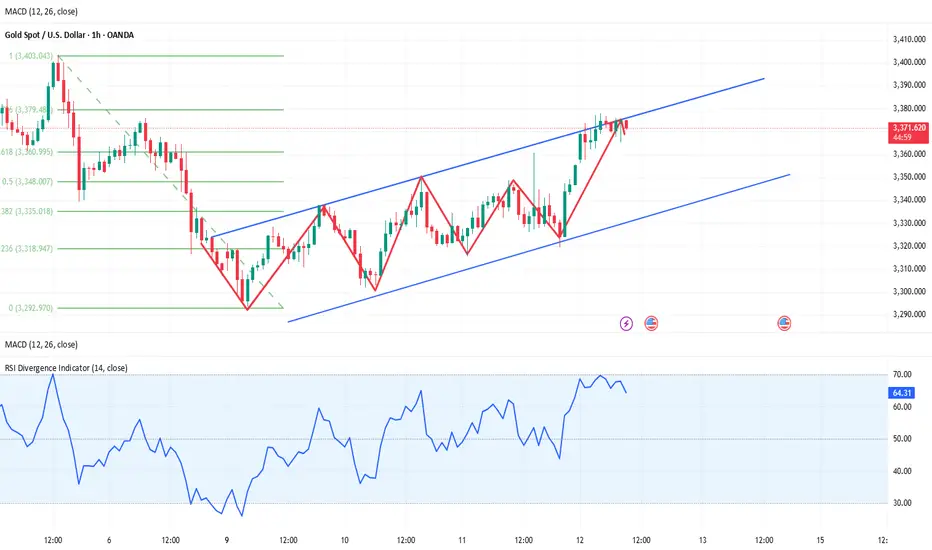
Stick to shorting gold and aim for the target area.Gold has not broken through 3400 after accelerating its rise, and the upper suppression effect still exists; currently gold is fluctuating in a narrow range below 3390, showing signs of stagflation to a certain extent. Therefore, the accelerated rise of gold is not for the short-term impact of 3400, but for a deep retracement, eliminating more scattered funds in the market by sweeping up and down.
So in the short term, I think it is difficult for gold to continue to break upward under the suppression of the resistance area near the short-term high of 3402, but to test the lower support area of 3375-3365 before breaking upward. So I have shorted gold as scheduled according to the short trading plan mentioned above, and aimed at the lower target area of 3375-3365.
At present, our short position has made a certain profit, but I still look forward to profiting from gold hitting TP! Let us look forward to gold falling back to the target area as expected!
EUR/JPY: Evening star warning as 165 holds by a threadEUR/JPY is on the cusp of confirming an evening star pattern, setting up a potential short if the price closes around current levels or lower.
165.00 remains key support. It’s already been tested today before bouncing—price behaviour we’ve seen before. It often trades through but rarely closes below with conviction, putting focus on how it trades into and out of the weekend, especially given EUR/JPY’s tendency to deliver reliable signals.
A break of Monday’s low at 164.60 would allow shorts to be initiated, with a stop above 165 for protection. Initial downside targets include the 50-day moving average, 163.00, or the 200-day moving average—depending on the risk-reward profile you're after.
Expect bids around 164, so be ready to square the trade if momentum stalls. If price rallies into the Friday close, the bearish setup would be invalidated.
Good luck!
DS

USD/JPY(20250613)Today's AnalysisMarket news:
The number of initial jobless claims in the United States for the week ending June 7 was 248,000, higher than the expected 240,000, the highest since the week of October 5, 2024. The monthly rate of the core PPI in the United States in May was 0.1%, lower than the expected 0.30%. Traders once again fully priced in the Fed's two interest rate cuts this year.
Technical analysis:
Today's buying and selling boundaries:
143.73
Support and resistance levels:
145.09
144.58
144.25
143.21
142.88
142.37
Trading strategy:
If the price breaks through 143.73, consider buying in, the first target price is 144.25
If the price breaks through 143.21, consider selling in, the first target price is 142.88

DOGS cryptocurrency analysis within the highlighted rangeAccording to the DOGS cryptocurrency chart, if the candle closes above the highlighted range, an upward trend can be expected. However, if it closes below the range, a further downward movement is likely

DOGS cryptocurrency analysis within the highlighted range.”According to the DOGS cryptocurrency chart, if the candle closes above the highlighted range, an upward trend can be expected. However, if it closes below the range, a further downward movement is likely.

PLTR – Structure Holding… For Now (4H Outlook)Palantir is compressing near ATHs, but showing early signs of exhaustion on higher timeframes. On the 4H chart, structure is still bullish — but fragile.
🔍 Key Technical Structure
• Series of Breaks of Structure (BoS) confirming the bullish trend
• Price is currently sitting above the $125 4H demand zone, near previous highs
• Invalidation for the bearish thesis sits at $140
🧭 Strategy Outlook
If $125.50 fails:
→ Next demand: $113.00–$105.00
→ Below that: strong support zone at $98.00–$89.00
If $140 breaks and holds:
→ Bearish divergence invalidated
→ Continuation toward new highs likely
📌 Summary
Price is at an inflection point. Structure remains bullish, but momentum is weakening across higher timeframes and RSI divergence is still active.
Watching $125.50 as the trigger:
Below = potential sell-off
Above = stay patient

Gold price fluctuates again, layout in the evening📰 Impact of news:
1. Initial jobless claims data favors bulls
📈 Market analysis:
The high of 3392 in the US market fell back for the first time to test the 3377 area to stop the decline and then tried again but failed to break through the 3400 integer mark. It can be seen that this position is very suppressed. The top and bottom conversion of 3377 has become the watershed for bulls to defend in the future market. 3400 is the short-term key pressure and the closing line has a long upper shadow K. If 3377 is lost, the price will fluctuate again. In the short term, focus on the 3390-3400 resistance on the upside and the 3377-3365 support on the downside.
🏅 Trading strategies:
SELL 3385-3395
TP 3370-3360
BUY 3365-3360
TP 3390-3400
If you agree with this view, or have a better idea, please leave a message in the comment area. I look forward to hearing different voices.
TVC:GOLD FXOPEN:XAUUSD FOREXCOM:XAUUSD FX:XAUUSD OANDA:XAUUSD

Buy Idea on Us Dollar Index (Dxy)Based on :
- Demand zone
- Pin bar Reversal
- Changing of correlation between dxy and zb1!
- cot report

Short gold ,it is expected to retreatToday, we accurately seized the trading opportunity of long gold at 3350 according to the trading plan, and hit TP: 3380 in the process of rebounding. We firmly grasped the profit of 300pips in the short-term long trading. At present, gold maintains the trend of continued rise! Now I definitely do not advocate chasing gold in short-term trading. On the contrary, I will actively look for good opportunities for short-term short trading to earn profits from short-term retracement.
In the short term, the suppression area I focus on is the 3390-3395 area, because the gold trend is relatively strong during the European session, and the US session should continue. If gold cannot break through this area in the short term, gold will likely usher in a wave of retracement. I think it should not be difficult to test the 3370-3360 area downward; secondly, we must pay attention to the same suppression area as the short-term high of 3402: 3405-3415; if gold touches this area and stagflation occurs, then it may form a secondary high in the short term, thereby hitting the firmness of the bulls' confidence and ushering in a retracement.
So next, I will test the gold short trade around the two areas of 3390-3395 and 3405-3415. Relatively speaking, the profit and loss ratio is still very favorable to us! But in the process of trading, we must strictly set up protection, after all, it is a counter-trend trade in the short term!
Nifty Analysis EOD – June 12, 2025 – Thursday🟢 Nifty Analysis EOD – June 12, 2025 – Thursday 🔴
📉 Range Breakout on Expiry – Bears Steal the Show
As highlighted in yesterday’s note — “Watch 25,222 on the upside and 25,080 on the downside for breakout” — Thursday’s expiry session decisively broke the range to the downside, unleashing a sharp bearish move.
Nifty opened strong at 25,164.45, briefly tested 25,196, but once again failed to challenge 25,200. The rejection triggered a slide to 25,083, and shortly after, the critical support of 25,080 gave way. This breakdown triggered long unwinding and fresh shorts, accelerating the fall all the way to 24,825.90 — a sharp 197-point drop.
Though there was a brief 90-point retracement, that too was sold into, and the index closed at 24,888.20 (adjusted), very close to the day’s low. This fall filled the Gaps created on June 6 and 9, and settled around the 0.5 Fibonacci retracement level (based on June 3 low to June 11 high).
With such a close, the market signals a strong shift in sentiment. Going ahead, 24800–24768 becomes a critical support zone. Bulls now need to reclaim and close above 25,020 to regain any strength. Until then, bias remains bearish.
🛡 5 Min Chart with Levels
🕯 Daily Time Frame Chart
🕯 Daily Candle Breakdown
Open: 25,164.45
High: 25,196.20
Low: 24,825.90
Close: 24,888.20
Net Change: −253.20 (−1.01%)
📊 Candle Structure Breakdown
Real Body: 276.25 pts → 🔴 Strong Red Candle
Upper Wick: 31.75 pts
Lower Wick: 62.30 pts
🔍 Interpretation
Bears dominated from start to finish, with hardly any resistance from the bulls.
The close near the day’s low reinforces strong bearish sentiment.
The lower wick is minimal — buying interest was absent post-selloff.
🔦 Candle Type
🔥 Bearish Marubozu–like Candle– Reflects powerful downside momentum and strong seller conviction.
📌 Key Insight
The candle wipes out 3 sessions of buildup — textbook bearish breakdown.
Support at 24,820–24,850 is critical. A breakdown from here could invite deeper correction.
Only a close above 25,020 can negate this bearish tone. Otherwise, weakness may persist.
🛡 5 Min Intraday Chart
⚔️ Gladiator Strategy Update
ATR: 252.81
IB Range: 131.4 → Medium IB
Market Structure: Balanced
Trades:✅ 11:10 AM – Short Triggered → Target Achieved, Trailing SL Hit (RR: 1:4.65)
📌 Support & Resistance Zones
Resistance Levels
24,920
24,972 ~ 25,000
25,060 ~ 25,080
25,102
25,125
25,180 ~ 25,212
Support Levels
24,820
24,800 ~ 24,768
24,735 ~ 24,725
24,660
24,640 ~ 24,625
💭 Final Thoughts
With a decisive range breakdown and expiry volatility behind us, the battle zone shifts to 24,800–25,000. Expect more pressure if bulls fail to reclaim 25,020.
🧠 “Markets don’t wait forever at the edge of range—they break, and break hard.”
✏️ Disclaimer
This is just my personal viewpoint. Always consult your financial advisor before taking any action.

Bitcoin H1 BreakdownPrice swept 110K with weak volume → no follow-through → sharp rejection.
Now testing 200 EMA near 107K.
Lose it → 105.2K / 103.7K next.
Hold it → bounce to 110.6K likely.
Classic liquidity trap + momentum unwind.

Long profit-taking,how to position gold before unemployment data📰 Impact of news:
1. Pay attention to the initial unemployment claims data
📈 Market analysis:
After being pulled down, the gold price quickly rebounded to around 3385, and the RSI showed a V-shaped reversal. It is not recommended to chase the rise at present. In the short term, pay attention to the upper resistance area of 3385-3395. If the gold price effectively breaks through this resistance area, it is expected to touch the 3400-3410 line. On the contrary, it encounters resistance and pressure at the 3385-3395 line, and may retreat to the 3370-3360 line in the short term.
🏅 Trading strategies:
SELL 3385-3395
TP 3370-3360
If you agree with this view, or have a better idea, please leave a message in the comment area. I look forward to hearing different voices.
OANDA:XAUUSD FX:XAUUSD FOREXCOM:XAUUSD FXOPEN:XAUUSD TVC:GOLD

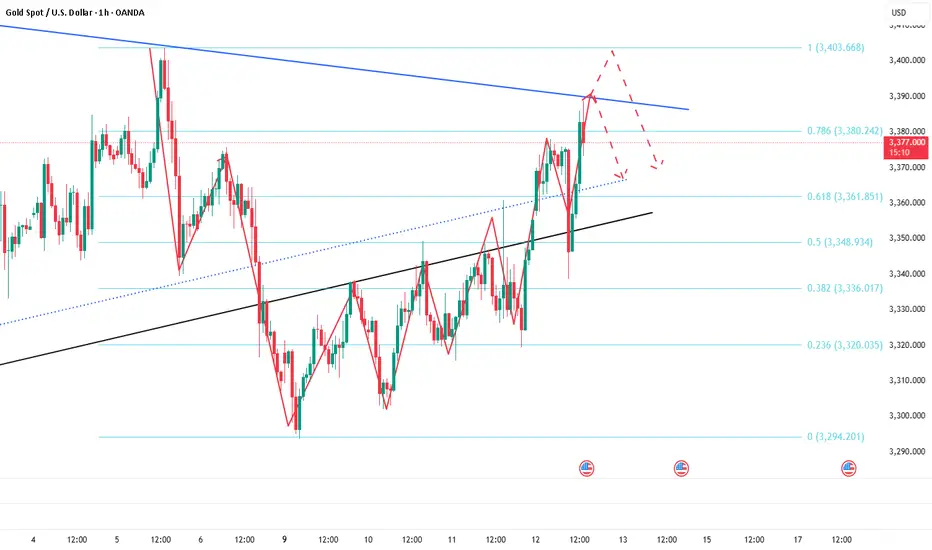
Buy gold, it is expected to continue to rise and test 3380-3390After the Asian session began, gold began to rise rapidly, and the original plan to short gold near 3355 had to be cancelled. After gold touched 3374, it fell back slightly, but after retreating to 3357, it rebounded again and broke through the short-term suppression near 3370 again. At present, gold still has the potential to rise further.
According to the current structure, gold has formed an oscillating upward structure, and the lows have been rising. After breaking through the short-term resistance area of 3360-3370, the willingness to rise has strengthened. Gold is expected to usher in a second rise and test the 3380-3390 area. If it breaks through this area, gold is even expected to continue to the 3410-3420 area. As gold rises, the gold support area rises to the 3360-3350 area.
So for short-term trading, we can try to go long on gold while controlling the risk after gold retreats to the 3360-3350 area!
CRUDE OIL (WTI): Pullback From Key Level
WTI Crude Oil looks overbought after a test of key daily horizontal resistance level.
A violation of a minor horizontal support on an hourly time frame after its test
provides a strong intraday confirmation.
I expect a retracement to 66.33 level.
❤️Please, support my work with like, thank you!❤️

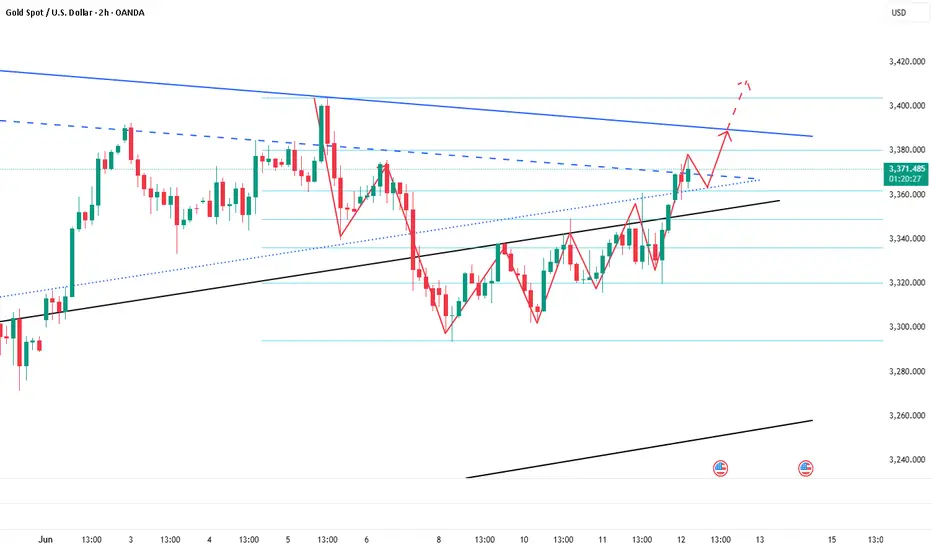
Repeated sweeps, gold trend analysis and operation layout📰 Impact of news:
1. Pay attention to the initial unemployment claims data
📈 Market analysis:
Gold price jumped higher in Asian session. The short-term upper pressure is at 3375. Once it breaks, the upward route of bulls will be opened. The RSI indicator in the 1H chart began to retreat after touching the overbought area. Last night's high of 3360 is now a breakthrough, and the previous strong suppression is at 3350. This morning's Asian session was also broken and stabilized. Then 3360-3350 has changed from a suppression position to a support position. Therefore, the next position we should pay close attention to should be around 3360-3350. If it can fall back to 3360-3350 in the future, it is possible to enter the market to do more, but at the same time, it is also necessary to defend 3345. Independent trading requires a SL.
🏅 Trading strategies:
BUY 3360-3350
TP 3370-3380-3400
If you agree with this view, or have a better idea, please leave a message in the comment area. I look forward to hearing different voices.
TVC:GOLD FXOPEN:XAUUSD FOREXCOM:XAUUSD FX:XAUUSD OANDA:XAUUSD
USD/CHF Testing June Low as Momentum Turns SouthRising geopolitical tensions and sliding U.S. Treasury yields have dragged USD/CHF sharply lower, delivering a bearish engulfing candle on the daily and pushing the pair back towards the June low at .8160. The move sets up a potential short should that level give way.
A clean break of .8160 would allow for positions to be established with a stop above for protection, targeting a retest of the April 21 swing low at .8040. Momentum signals are turning bearish, with RSI (14) breaking its uptrend and drifting further from neutral, while MACD looks set to cross the signal line below zero.
While a long setup is also a consideration should .8160 hold, recent price action and momentum shifts suggest it’s a low-probability play.
Good luck!
DS

Nasdaq Futures: Tariff Talk, Tech Fatigue Turn TideHaving surged more than 20% from the April lows, we could be nearing a turning point for Nasdaq 100 futures.
Bullish momentum is showing signs of shifting lower, while Wednesday’s inverted hammer candle—on a day when tech stocks were given every excuse to rally thanks to the soft U.S. inflation report and subsequent decline in Treasury yields—warns the rally may be running out of steam.
With Donald Trump talking about setting firm tariff rates for individual nations within the next two weeks, we’re already seeing signs of weakness in futures, bolstering the prospect for a three-candle evening star pattern being completed. Sitting in a rising wedge, directional risks seem to be skewing lower.
If the price breaks and closes beneath wedge support, it would create a setup where shorts could be established with a stop above Wednesday’s high to protect against a resumption of the bullish trend.
21436 is a minor support level that screens as an initial target, although 20800—where the price bounced strongly from on May 23—makes for a more appealing case from a risk-reward perspective.
A push and close above 21969—a minor resistance level established earlier this year—would invalidate the bearish bias.
Good luck!
DS

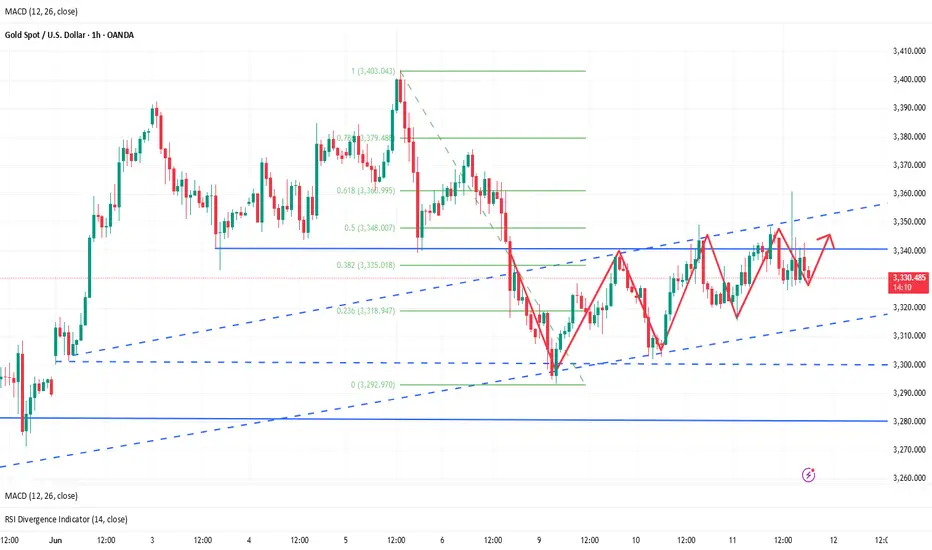
Insist on shorting gold on ralliesToday we made a total profit of 350 pips in 2 short trades. First, we shorted gold near 3345, and when gold fell to around 3330, we manually closed the order to lock in profits; the second time, gold rebounded sharply with the help of CPI data, and we seized the opportunity to short gold again near 3360, and ended the transaction by hitting TP: 3340. We accurately grasped the profit of gold shorting.
At present, gold is in a narrow range of fluctuations near the 3330 mark. Relatively speaking, gold is still in a weak position. Although gold has rebounded sharply with the help of the positive CPI data, it has shown a long upper shadow in the candle chart due to the rapid retracement, which has strengthened the resistance above and limited the rebound space of gold in the short term. In addition, the morphological structure shows signs of building a head and shoulders top structure. The resistance area in the short term is 3345-3355; followed by 3360-3370. Although gold is currently in a narrow range of fluctuations near the 3330 mark, it does not show obvious signs of support. It is easy to fall below the area near 3330 in a weak situation. The relatively strong support is in the 3320-3310 area, followed by the area near 3300-3290.
So for short-term trading, I still advocate taking the 3345-3355 area as resistance first and continue to short gold!

MES Long - HVN, Gap, FVG, Long trade for MES based on High Volume Node with refined Entry in lower timeframe.
HVN on higher timeframe (daily)
HVN on lower timeframe (m30)
Gap followed by huge FVG
Expected reaction for price to bounce to the upside.
TP2 rather a swing trade exit.
TP1 more of a intraday trade exit.

How to arrange the gold price in the evening? Go long at 3330📰 Impact of news:
1. CPI data is profitable
2. The US CPI rose slightly in May, and Trump's tariff effect has not yet fully emerged
📈 Market analysis:
The trend line position of the 4H chart coincides and resonates with the middle track of the Bollinger Band, with 3326 as the watershed reference. This is why it is difficult to break below this point after repeated tests. Once it breaks below, the short-term trend is likely to fluctuate from strong to weak. However, the current support below is still strong at 3330-3326. The repeated rise and fall of data during the day also stopped the decline at this point. If the price does not lose here, the pattern of strong fluctuations will remain unchanged, and the bulls will gradually regain lost ground. At present, it is time for space. The operation suggestion for the future market is to continue to rely on the bullish trend above 3330, and 3330-3326 can be flexibly entered. At the same time, the RSI indicator is above 50 and there is still some space from the overbought zone. The signal is given that 3360, although the long upper shadow line K is closed, is very likely not the short-term top. After the sharp rise and fall in 1H, it went sideways and waited for the next wave of strength. If the night close is above 3326, the upper area will probably be 3350-3360. If the price can break through and stabilize this level, the upward pace will most likely accelerate to reach 3370-3380.
🏅 Trading strategies:
BUY 3330-3326
TP 3350-3360
If you agree with this view, or have a better idea, please leave a message in the comment area. I look forward to hearing different voices.
OANDA:XAUUSD FX:XAUUSD FOREXCOM:XAUUSD FXOPEN:XAUUSD TVC:GOLD
Bitcoin H4 – UpdatePrice consolidating just under $110K with low sell volume. This is bullish compression, not weakness.
📍 Key support: $109K
📍 Breakout above: $110.3K → 🚀 $112K+ in sight
📍 Invalidated below: $108K
This is the calm before the next leg up.

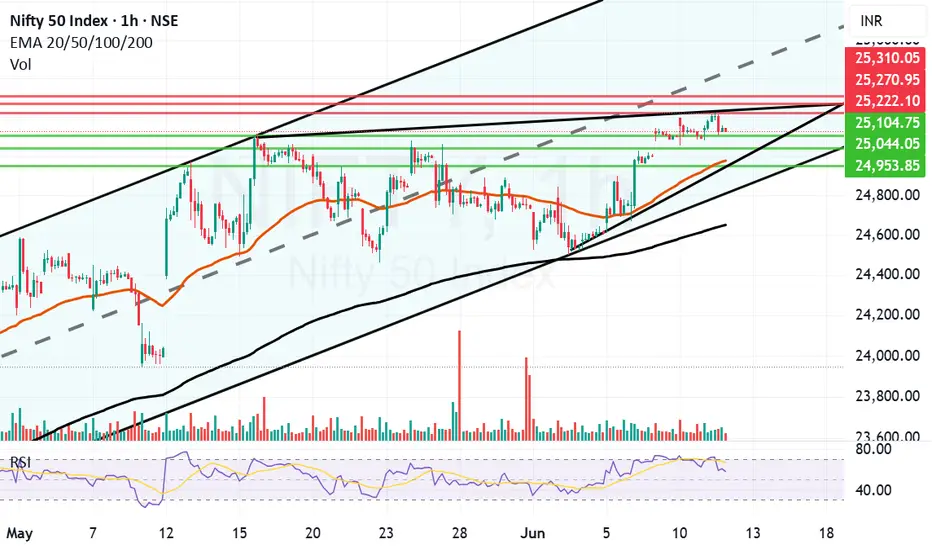
Nifty Facing resistnace above 25200 zoneToday Nifty closing above 25141 is a positive sign but it is evidently facing resistnace above 25200 zone. Nifty made a high of 25222 today but could not sustain at those levels and fell but eventually closed in the positive. The daily candle formed is an indecisive Doji.
IT Sector seems to be on the verge of a Reverse Head and Shoulder Breakout. If this breakout happens and Nifty gets support from other heavy weights we can see it growing further.
The resistances for Nifty now are at 25222, 25270 and 25310.
The supports for Nifty are at 25104, 25044, 24977 (Mother line support of Daily chart and 24953 Channel bottom. Things are in balance with shadow of the candle slightly positive.
Disclaimer: The above information is provided for educational purpose, analysis and paper trading only. Please don't treat this as a buy or sell recommendation for the stock or index. The Techno-Funda analysis is based on data that is more than 3 months old. Supports and Resistances are determined by historic past peaks and Valley in the chart. Many other indicators and patterns like EMA, RSI, MACD, Volumes, Fibonacci, parallel channel etc. use historic data which is 3 months or older cyclical points. There is no guarantee they will work in future as markets are highly volatile and swings in prices are also due to macro and micro factors based on actions taken by the company as well as region and global events. Equity investment is subject to risks. I or my clients or family members might have positions in the stocks that we mention in our educational posts. We will not be responsible for any Profit or loss that may occur due to any financial decision taken based on any data provided in this message. Do consult your investment advisor before taking any financial decisions. Stop losses should be an important part of any investment in equity.