EURGBP forex rallying as expected off weekly demand levelWeekly uptrend. Weekly demand imbalance at 0.83 is still in control and trying to play out as expected. Any swing long positions should be managed. I hope you could take advantage of long positions using the smaller timeframes for those intraday and short-term forex traders.
Candlestick Analysis

Doge Meme Coin daily demand level is playing out wellThe strong daily demand imbalance mentioned in a previous update is still in control and trying to play out as expected. Any long positions on this meme coin should be managed.

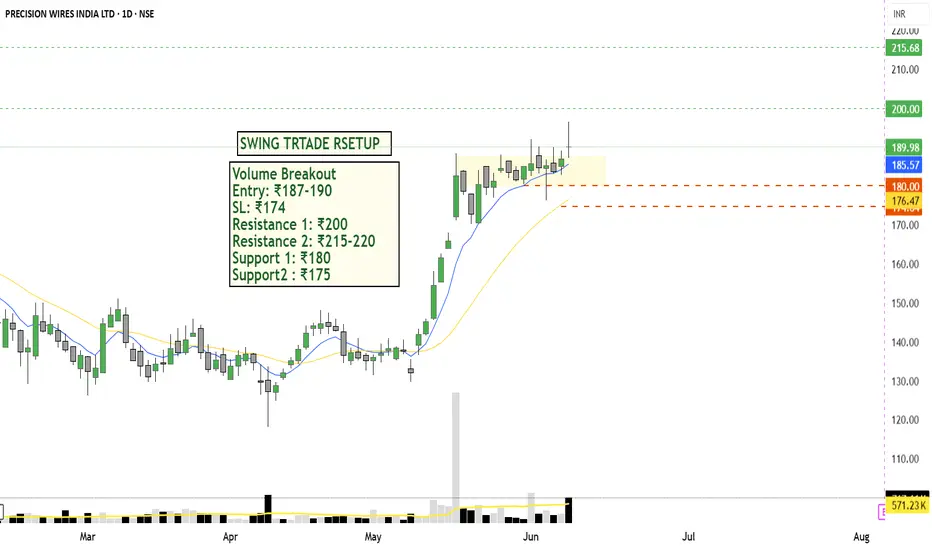
Precision Wires India Ltd: Breakout + Fundamental Bullish SetupTechnical Analysis (Daily Timeframe)
Breakout Pattern: consolidation breakout with Strong bullish DOJI candle above ₹185–₹187
Volume Confirmation: with a spike in volume (767.6K vs avg 571.2K)✅ Yes
Trend: Strong uptrend; Higher Highs & Higher Lows
Bullish momentum intact Price above 20 EMA & 50 EMA
FUNDAMENTALS ANALYSIS : Company fundamentals are fully strong, company low debt and high reserves make it fundamentally strong
PROFIT & LOSS:
Company revenue increased YOY
Company net profit good
Profit Margin improved from 3.9% to 4.2% that is the good sign.
🔼 Steady revenue growth with increasing margins shows operational efficiency and cost management.
Fundamental Summary
Parameter Verdict
Earnings Growth : Consistent YoY
Financial Health : Excellent
Promoter Holding: Stable & high
Business Model: Stable & scalable
Trade conclusion:
Strong volume Breakout from Consolidation
Earning Growth and ROCE >15%
Debt free company with high promoters confidence.
Good Sector
📢 Disclaimer: Not investment advice. Do your own research (DYOR). This idea is shared for educational and tracking purposes.
BULLISH!💰 #BTC successfully retested the broken weekly resistance with a positive outcome✅
a Morning Star bullish candlestick pattern is forming✨
BULLISH🚀

Gold rebound fails to change the trend and is still bearish?📰 Impact of news:
1. The streets of Los Angeles are full of "gunpowder smell"! Immigration protests escalate, and Trump sends troops to suppress them
2. Geopolitical situation
3. Federal Reserve political expectations
📈 Market analysis:
At the hourly level: the Bollinger Band opening is narrowing, the MACD technical indicator is running in a golden cross, and the RSI fluctuates frequently in the short term. There is a certain potential for short-term promotion. If the gold price stabilizes above 3315, it may trigger a rebound and touch 3330-3340 again. If the gold price continues to be below 3300 and the short position is strengthened, it may fall to a new low. Therefore, if it rebounds again to the 3330-3340 resistance line, short positions can still be considered.
🏅 Trading strategies:
BUY 3315-3318
TP 3330-3335
SELL 3330-3340
TP 3300-3290-3280
If you agree with this view, or have a better idea, please leave a message in the comment area. I look forward to hearing different voices.
OANDA:XAUUSD FX:XAUUSD FOREXCOM:XAUUSD FXOPEN:XAUUSD TVC:GOLD

Evening gold trend analysis and operation layout📰 Impact of news:
1. The streets of Los Angeles are full of "gunpowder smell"! Immigration protests escalate, and Trump sends troops to suppress them
2. Geopolitical situation
3. Federal Reserve political expectations
📈 Market analysis:
Gold rebounded as expected and touched the 3330 line. In the short term we need to pay attention to the 3335 line. On the one hand, it is the top and bottom, and on the other hand, the annual average line is also the pressure point of the upper track of the downward channel. Once it is suppressed below 3335, it will continue to fluctuate downward. If it unexpectedly breaks through 3335 or even 3340, then 3293 is likely to become the short-term bottom.
At present, the rise has slowed down after rising to 3330, and the technical side shows a top divergence signal, so in the short term, we still maintain the idea of shorting at a high level of fluctuation.
🏅 Trading strategies:
SELL 3335-3345-3355
TP 3310-3300
If you agree with this view, or have a better idea, please leave a message in the comment area. I look forward to hearing different voices.
TVC:GOLD FXOPEN:XAUUSD FOREXCOM:XAUUSD FX:XAUUSD OANDA:XAUUSD

Nifty Analysis EOD – June 9, 2025 – Monday🟢 Nifty Analysis EOD – June 9, 2025 – Monday 🔴
🎯 Stuck at the Top – Expansion Coming Soon?
Nifty opened with a strong Gap-Up of 127 points at 25,127, landing right at the upper resistance cap. But from the very first candle, it was clear that the market was unsure—price action showed indecision, and the index could barely add another 16 points before hitting the day’s high of 25,143.45.
From there, the index retraced about 66 points, marking a low at 25,077.15, before attempting a gradual recovery toward the high. But that breakout attempt was unsuccessful, and Nifty drifted back to the mean and closed the day at 25,103.20—essentially wrapping the entire session within a tight 65-point range.
Buyers fought hard to defend 25,100, while sellers tried to fill the morning gap. The narrow range and mean reversion hint at consolidation, setting the stage for a possible expansion in the coming sessions. Stay patient—the coil is tightening.
🛡 5 Min Chart with Levels
🕯 Daily Time Frame Chart
🕯 Daily Candle Breakdown
Open: 25,160.10
High: 25,160.10
Low: 25,077.15
Close: 25,103.20
Net Change: +100.15 (+0.40%)
📊 Candle Structure Breakdown
Real Body: 56.90 pts → 🔴 Red candle (Close < Open)
Upper Wick: 0 pts (Open = High)
Lower Wick: 26.05 pts
🔍 Interpretation
Price opened at the high and failed to push any higher – showing no strength above the open.
Despite a positive close versus the previous session, the candle is bearish intraday.
The lower wick shows some support, but not enough to flip the bias.
🔦 Candle Type
🟥 Red Inverted Hammer / Bearish Pin Bar– Typically signals weakness or potential reversal, especially when forming near resistance zones.
📌 Key Insight
The structure shows exhaustion or profit booking.
A move below 25,077 could open the door to further downside.
However, holding above 25,100–25,130 will keep bullish hopes alive.
🛡 5 Min Intraday Chart
⚔️ Gladiator Strategy Update
ATR: 262.59
IB Range: 66.3 → Small IB
Market Structure: imBalanced
Trades:❌ No Trade Triggered by the system
📌 Support & Resistance Zones
Resistance Levels
25,116 ~ 25,128
25,180 ~ 25,212
25,285
Support Levels
25,062 ~ 25,070
24,972
24,920 ~ 24,894
24,800 ~ 24,768
💭 Final Thoughts
Today was a pause, not a pullback—yet.With price compressed in a tight band, volatility expansion is likely ahead.
🧠 “Markets don't stay quiet for long. Silence often precedes a scream—watch which direction the breakout takes.”
✏️ Disclaimer
This is just my personal viewpoint. Always consult your financial advisor before taking any action.

GBPNZD: Classic Pullback Trade 🇬🇧🇳🇿
GBPNZD may pull back from the underlined horizontal support.
As a confirmation, I see a rejection from that first,
and a formation of a bullish imbalance candle on 1H time frame then.
Goal - 2.244
❤️Please, support my work with like, thank you!❤️

US 500 Index – All Time Highs Back in SightFresh optimism regarding trade negotiations between the US and China, coupled with confirmation on Friday that the US labour market is cooling down slowly and not indicating an imminent US recession, has seen the US 500 index open this morning at 4 month highs, bumping up against the psychological 6000 again, with its all time peak of 6144 (February 19th) back in sight.
Looking forward, this could be a pivotal week for the US 500, with a variety of risk events for traders to consider, all of which may have the potential to impact the direction of risk sentiment into the Friday close.
First up, later today, traders will be eagerly awaiting updates from the second round of trade talks between US and Chinese trade teams, who are tasked with defusing tensions regarding the supply of rare earth minerals and advanced technology.
Then, on Wednesday (CPI 1330 BST) and Thursday (PPI 1330 BST) the next round of US inflation updates for May are released. These could be relevant to traders who have become more sensitive to potential price rises due to the impact of President Trump's trade tariffs. Any surprise deviations from expectations in either of these releases could see an increase in US 500 index volatility.
Putting this all together with any fresh reports outlining progress on trade deals between the US and Japan or the EU, and it could be a volatile week in store. With this in mind, it can be helpful to consider the technical indicators and trends.
Technical Update: Focus on the Bollinger Mid Average
While some may have argued for a slowing in upside momentum of the recent US 500 index advance, price weakness has continued to be limited in both time and extent.
Importantly, as the chart above shows, when short term setbacks in price have recently materialised, it has been the rising Bollinger mid-average that has marked a support focus.
This maintains the potential of a more constructive picture and positive price trend, where buyers have been happy to pay a higher price each time that weakness is seen, and have been able to push the index above previous peaks in price, to new recovery highs.
Of course, there is no guarantee this pattern of higher highs and higher lows in price will extend further, but traders may well be focusing on this type of pattern as having the potential to lead to a more sustained phase of price strength.
What are the potential support and resistance levels that traders may be watching this week for clues to the direction of the next possible price move?
Potential Resistance Levels:
Further evidence that a positive trend in price could still be in place came on Friday, as a new recovery price high at 6017 was posted.
Traders may now be watching how a previous price high at 6049, which was posted on February 24th is defended, as closing breaks may see further attempts to push to higher levels. Such moves could then lead to further price strength towards 6144, the February 19th all-time high.
Potential Support Levels:
Having held and turned price activity higher over previous tests, it may well still be the rising Bollinger mid-average, which currently stands at 5916 that represents a possible support focus this week.
Closes below this level while not confirmation of a more extended phase of price weakness, may see a deeper decline to test 5842, the May 30th session low, even on to the 5742 level, which is equal to the low posted on May 23rd.
The material provided here has not been prepared in accordance with legal requirements designed to promote the independence of investment research and as such is considered to be a marketing communication. Whilst it is not subject to any prohibition on dealing ahead of the dissemination of investment research, we will not seek to take any advantage before providing it to our clients.
Pepperstone doesn’t represent that the material provided here is accurate, current or complete, and therefore shouldn’t be relied upon as such. The information, whether from a third party or not, isn’t to be considered as a recommendation; or an offer to buy or sell; or the solicitation of an offer to buy or sell any security, financial product or instrument; or to participate in any particular trading strategy. It does not take into account readers’ financial situation or investment objectives. We advise any readers of this content to seek their own advice. Without the approval of Pepperstone, reproduction or redistribution of this information isn’t permitted.

Gold weakness continues, bears continue to exert force📰 Impact of news:
1. The streets of Los Angeles are full of "gunpowder smell"! Immigration protests escalate, and Trump sends troops to suppress them
2. Geopolitical situation
3. Federal Reserve political expectations
📈 Market analysis:
At present, the hourly moving average of gold price is spreading downward. At the same time, the 4H chart has retreated from a high and lost the middle track, breaking through the rising trend line. The low point of the trend line coincides with the middle track. Today's operation uses the low point of 3330-3335 as the critical point of strength and weakness. If the market rebounds below this range, you can just go bearish. If it breaks through this dividing point, you need to be cautious. On the whole, the recommended short-term operation strategy for gold today is to mainly short on rebound. Focus on the resistance of 3330-3340 on the upper side in the short term, and focus on the support of 3290-3280 on the lower side in the short term. The market fluctuates greatly, and stop loss is strictly controlled!
🏅 Trading strategies:
SELL 3325-3335
TP 3300-3290-3280
If you agree with this view, or have a better idea, please leave a message in the comment area. I look forward to hearing different voices.
TVC:GOLD FXOPEN:XAUUSD FOREXCOM:XAUUSD FX:XAUUSD OANDA:XAUUSD

USDCAD Short Opportunity Description :
USDCAD is setting up for a potential short — I’m watching closely for an upthrust into the highlighted zone to initiate the position. Here’s my current read:
🔍 Technical Breakdown:
1. Trendline Break
Previous bullish trendline broken with conviction. Market structure now vulnerable to bearish continuation.
2. Volume Spike with Selling Pressure
Notable increase in volume on bearish candles — suggests smart money exiting or early sellers stepping in.
3. Anticipating an Upthrust
Watching for price to sweep the highs around 1.3695–1.3700, fail to sustain, and drop back inside range.
This would provide a low-risk entry with tight stops above the highs and 5r+ down to 1.3652, possibly even lower.
📌 Trade Plan:
Entry Zone: 1.3695–1.3700 (after upthrust confirmation)
Stop: Above 1.3710
TP1: 1.3652 (structure low)
TP2: 1.3600 (extended target if momentum builds)
---
🧠 Why This Setup?
This aligns with key principles I trade:
Trendline breaks often lead to retests followed by continuation.
Rising volume on the break is confirmation, not noise.
A failed breakout (upthrust) into previous supply zones is often the "last push" before price collapses.
Let me know if you're seeing something different. This is how I’m planning to attack the chart today.

XAU/USD 09 June 2025 Intraday AnalysisH4 Analysis:
-> Swing: Bullish.
-> Internal: Bullish.
Analysis and bias remains the same as analysis dated 23 April 2025
Price has now printed a bearish CHoCH according to my analysis yesterday.
Price is now trading within an established internal range.
Intraday Expectation:
Price to trade down to either discount of internal 50% EQ, or H4 demand zone before targeting weak internal high priced at 3,500.200.
Note:
The Federal Reserve’s sustained dovish stance, coupled with ongoing geopolitical uncertainties, is likely to prolong heightened volatility in the gold market. Given this elevated risk environment, traders should exercise caution and recalibrate risk management strategies to navigate potential price fluctuations effectively.
Additionally, gold pricing remains sensitive to broader macroeconomic developments, including policy decisions under President Trump. Shifts in geopolitical strategy and economic directives could further amplify uncertainty, contributing to market repricing dynamics.
H4 Chart:
M15 Analysis:
-> Swing: Bullish.
-> Internal: Bearish.
Analysis and bias remains the same as analysis dated 22 May 2025.
In my analysis from 12 May 2025, I noted that price had yet to target the weak internal high, including on the H4 timeframe. This aligns with the ongoing corrective bearish pullback across higher timeframes, so a bearish internal Break of Structure (iBOS) was a likely outcome.
As anticipated, price targeted strong internal low, confirming a bearish iBOS.
Price has remained within the internal range for an extended period and has yet to target the weak internal low. A contributing factor could be the bullish nature of the H4 timeframe's internal range, which has reacted from a discounted level at 50% of the internal equilibrium (EQ).
Intraday Expectation:
Technically price to continue bullish, react at either premium of internal 50% EQ or M15 demand zone before targeting weak internal low priced at 3,120.765.
Alternative scenario:
Price can be seen to be reacting at discount of 50% EQ on H4 timeframe, therefore, it is a viable alternative that price could potentially print a bullish iBOS on M15 timeframe.
Note:
Gold remains highly volatile amid the Federal Reserve's continued dovish stance and persistent geopolitical uncertainties. Traders should implement robust risk management strategies and remain vigilant, as price swings may become more pronounced in this elevated volatility environment.
Additionally, President Trump’s recent tariff announcements are expected to further amplify market turbulence, potentially triggering sharp price fluctuations and whipsaws.
M15 Chart:

Eur, Gbp & DXY Dynamics: We have reached fair valueWith equilibrium being established we are stuck in an internal liquidity range. We do expect the trending targets to be hit although we are seeing a preliminary shift in structure.
If there was anything I missed in this analysis please let me know. Share this with anyone who may be interested 🙏🏾

EURCHF: Pullback From Resistance Confirmed 🇪🇺🇨🇭
EURCHF may pull back from the underlined resistance today.
As a confirmation, I spotted a double top pattern after a test
of a key intraday resistance and a violation of its neckline with
a high momentum bearish candle on Friday.
Goal - 0.93585
❤️Please, support my work with like, thank you!❤️
I am part of Trade Nation's Influencer program and receive a monthly fee for using their TradingView charts in my analysis.

Gold has option to go into a steep bullish retest of broken lowsExplanation in video. Let me know if there was anything I missed in this analysis.
Share with anyone who may be interested 🫡

NASDAQ Still failing to secure meaningful closes above the rangeAll explained in video. Please let me know if there is anything I may have missed in this analysis.
Thanks and share with anyone who may be interested 🔓

EURJPY ANALYSIS After seeing the previous week close really bullish on the daily and weekly timeframes, we could expect that momentum to continue pushing but since the pair is at a HH area on the daily we could expect a pull back before the bullish move kicks in

GBPUSD ANALYSISAfter seeing the previous week close above 135.000 we could expect a retest of that area before the market continues to the upside, but in the mean time the daily and 4hr are currently showing bearish type setups which could be a sign that the retracement on the weekly could form

EURCHF H4As we can see , we had sell side Liquidity that have been taken out after that , we had MSS (market structure shift ) which creates inducement that forms SMT ( smart money technique). After SMT market goes up creating inversion fair value gap. And we took our entry at our order block.

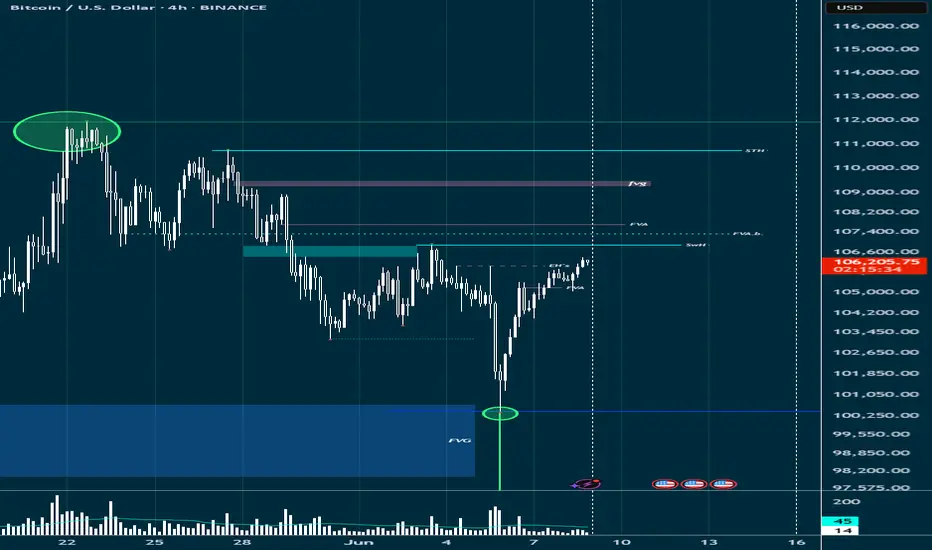
BTC - Weekly outlook - Bullish.Following on from my HTF analysis on BTC, same shit applies you little reprobates! - BTC tapped into a weekly FVG on Thursday, taking out 4 hour and daily liquidity levels in the process.
Since tapping the Weekly FVG, price has printed a strong bullish reversion, back into the 4H and Daily areas of potential resistance. Right now, is crunch time (so to speak) - BULLS NEEDS TO SEE THE DAILY PREM ARRAYS BEING DISRESPECTED.
So far, the 4H FVA has been respected, with LTF disc arrays being respected also, with that being said, the next logical targets within reach are the daily (light blue) PDA's above current price action. Asian session to run these highs? Possibly, bulls need to see strong support created in these areas if they are to realistically find levels to move higher from.
Biggest question is how much supply is residing above these levels? IF WE REACH TO THE DAILY SWING HIGH, WE NEED TO OBSERVE FOR LTF SIGNALS OF A SWEEP FORMING - ideal scenario is for price to RUN the Daily SwH to the continue towards the STH - THESE ARE OUR TARGETS FOR THIS WEEK. - Only thing that will change my bias is if the daily sweeps the SwH at 106.9K (pretty much 107K, another key level for analysts).
Happy Trading people, don't forget - trade what we SEE, not what we THINK!
GBPJPY UPDATE!!Good day traders, I am back again with an update and this time it's on GBP/JPY. On the 1st of June I posted a setup but I mentioned that I will explain it later because I will be able to make my point clearer and easy to understand.
When this setup was posted I had that daily order block in mind, only because I needed to see it revisit the order block for the last time before price could make a run for that internal liquidity resting inside an unfilled FVG(BISI). We can also use that thought as confluence when looking for short term reversals or partial exits. Just by taking a look on the chart I posted again I will put it in the description below, you can see in the sell side of the chart we have a lot of equal lows and ICT teaches us that price looks for relative lows/equal lows and old lows.
On the daily TF price is currently inside a bearish order block and what we do not wanna see is price going over the wick of that wick of a candle that was booked on the 29th of May. We are also inside the premium zone of the wick meaning we can expect to run from there to our objectives below. As always my first objective is always the internal liquidity and that is only because that internal liquidity are my LTF | Highs/Lows.
On the 4H price is inside a balanced price range again that's in my favour meaning I have to note it. ICT teaches that we always wanna trade towards the direction where all our PD arrays are lining up and in this case, it's in the sellside, I believe we are in the starting phase of ICT's sell model.
My name is Teboho Matla but you...you don't know me yet!!

Long trade
30min TF overview
📘 Trade Journal Entry — PEPEUSDT (Buyside Trade)
🗓 Date: Sunday, 8th June 2025
⏰ Time: 3:15 PM
📍 Session: NY Session PM
📈 Timeframe: 15-Minute
🎯 Target: This Week’s Open (0.00001181)
📊 Risk-Reward Ratio: 8.0
🔹 Trade Details:
Entry Price: 0.00001173
Take Profit: 0.00001181 (+0.68%)
Stop Loss: 0.00001172 (−0.09%)
15min TF overview
🔹 Technical Breakdown:
Bias: Buyside pressure observed with steady reclaim of mid-range levels.
Market Context: Entered during a slow grind upwards toward the weekly open.
Confluence Factors:
Clean 15m structure supported upward continuation.
RSI was rising with momentum, confirming higher lows.

Long trade
15min TF overview
📘 Trade Journal Entry — PEPEUSDT (Buyside Trade)
🗓 Date: Sunday, 8th June 2025
⏰ Time: 2:00 PM
📍 Session: NY Session PM
📈 Timeframe: 10-Second Chart (High-Frequency Scalping)
🧠 Confirmation Tool: RSI Indicator for directional bias
🎯 Result: ✅ Target hit successfully
🔹 Trade Details:
Entry Price: 0.00001173
Take Profit: 0.00001179 (+0.51%)
Stop Loss: 0.00001172 (−0.09%)
Risk-Reward Ratio: 5.10
10 sec TF entry
🔹 Technical Breakdown:
RSI Confirmation: RSI divergence spotted on microstructure, indicating short-term oversold conditions. Entry Trigger: Price action reclaimed the short-term support zone while RSI reversed upward from the 30-level—execution: Executed immediately after a bullish micro-candle and RSI confirmation crossover.
10 sec TF entry overview
