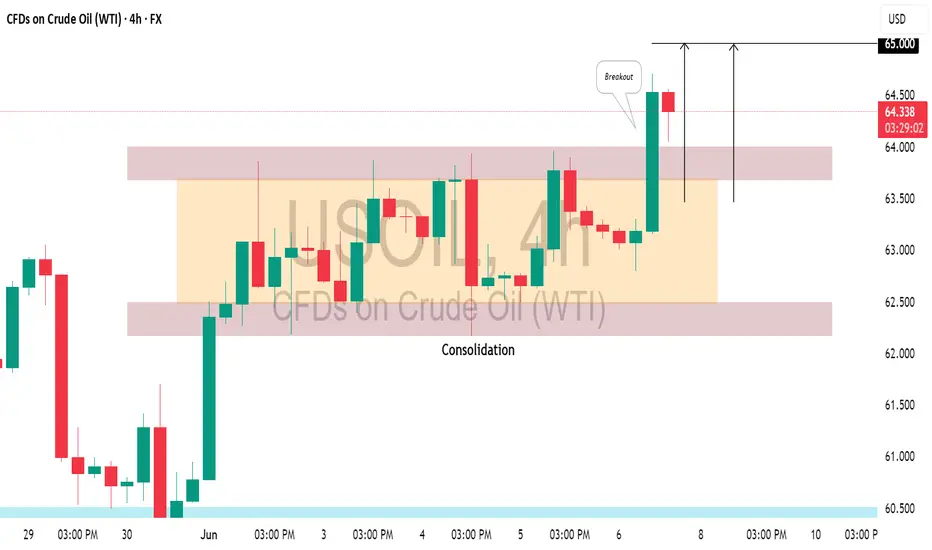
US CRUDE OIL(#WTI) : Bullish Trend Continues📈USOIL is trading in a bullish trend on a 4H time frame.
After a prolonged upward movement, it started to consolidated within a horizontal range for a while.
Recently, the resistance of this range was breached, indicating strong buyer momentum.
I believe the upward movement may persist, potentially leading the market to reach the 65.00 level soon.
Candlestick Analysis
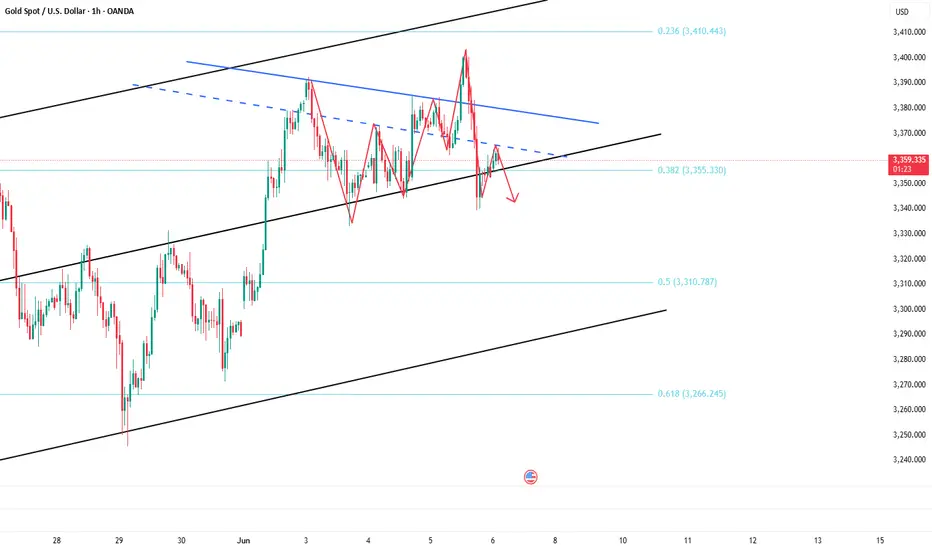
The rebound is not strong, and gold still has room to fallThere is no good entry point to participate in the transaction at present, but the highlight of today is the NFP market, so there is no need to rush to enter the market when there is no trading opportunity.
Although gold rebounded slightly after touching 3340 overnight, to be honest, the rebound strength is far less than expected, and as long as gold remains below 3365-3375, gold will remain weak in the short term, so I think gold still has room to fall. First, pay attention to the support near 3330, followed by the support near 3310. However, in trading, we must pay attention to guard against the trend of falling after rising in the NFP market.
Trading strategy:
1. Consider continuing to short gold in the 3375-3385 area, TP: 3360-3350;
2. Consider trying to go long gold in small batches in the 3325-3315 area, TP: 3340-3350

Long positions have made profits, focus on support📰 Impact of news:
1. The United States issues new sanctions on Iran
2. Trump continues to criticize the Federal Reserve
📈 Market analysis:
At present, the gold price has touched 3340. If it stabilizes here, we can arrange to go long. However, the gold price is constantly testing downwards, which is why I did not arrange to go long immediately. At the same time, we need to be vigilant about whether the gold price will fall below the important support of 3330. If it really falls below 3330, the gold price may test the support of the integer mark of 3300, which will also determine the future market trend.
🏅 Trading strategies:
SELL 3400-3370
TP 3340-3330-3300
BUY 3335-3330
TP 3350-3370
SELL 3325-3320
TP 3310-3300
If you agree with this view, or have a better idea, please leave a message in the comment area. I look forward to hearing different voices.
OANDA:XAUUSD FX:XAUUSD FOREXCOM:XAUUSD FXOPEN:XAUUSD TVC:GOLD

USDJPY: Pullback From Support📈USDJPY responded well to the highlighted intraday support zone on a 4H timeframe.
The price formed a double bottom pattern on that and violated its horizontal neckline.
There's a strong likelihood that the price will continue to rise and hit the 146.00 resistance level.

USDJPY Wave Analysis – 6 June 2025
- USDJPY reversed from the support area
- Likely to rise to the resistance level 146.00
USDJPY currency pair recently reversed from the support area between the support level 142.50 (which has been reversing the price from the end of April) and the lower daily Bollinger Band.
The price earlier formed multiple consecutive Japanese candlesticks reversal patterns near the support level 142.50 – Bullish Engulfing, Morning Star and Pricing Line,
Given the strength of the support level 142.50, USDJPY currency pair can be expected to rise to the next resistance level 146.00.

50 bps Repo Rate Cut boosts Nifty. Can it fly further now?The market was expecting a Repo Rate Cut From RBI. The expectation was for 25bps but what we got today from RBI was a bumper 50 bps rate cut. This propelled Nifty to close above much coveted level of 25K as Nifty managed to close at 25003. Now Nifty has entered a critical resistance zone. This zone starts from around 25037 to 25146. Closing above 25146 is mandatory for Nifty to fly further and gain further momentum. Last 4 weeks or so Nifty has been returning back from this zone. We can see this in the weekly chart of Nifty. With rate cut the chances for Nifty to fly above this most important levels has increased a lot.
The resistances for Nifty Now Remain at: 25037, 25146 (Important Trend line Resistance, Bulls will be very active above this level.), 25473, 25804 and 26277. Further levels will be given once we get a closing above 26277.
The supports for Nifty remain at: 24642, 24425, 23904, 23597 (Most important Mother Line of Weekly Candles). Below this level Nifty will become very week again and bears can drag Nifty further down towards 23201 (Important Trend Line Support). If this is broken in unlikely global or local geo-political event then Nifty can further fall to 22169 or even 21671 levels in unlikely scenario of major geo-political event unfolding.
Disclaimer: The above information is provided for educational purpose, analysis and paper trading only. Please don't treat this as a buy or sell recommendation for the stock or index. The Techno-Funda analysis is based on data that is more than 3 months old. Supports and Resistances are determined by historic past peaks and Valley in the chart. Many other indicators and patterns like EMA, RSI, MACD, Volumes, Fibonacci, parallel channel etc. use historic data which is 3 months or older cyclical points. There is no guarantee they will work in future as markets are highly volatile and swings in prices are also due to macro and micro factors based on actions taken by the company as well as region and global events. Equity investment is subject to risks. I or my clients or family members might have positions in the stocks that we mention in our educational posts. We will not be responsible for any Profit or loss that may occur due to any financial decision taken based on any data provided in this message. Do consult your investment advisor before taking any financial decisions. Stop losses should be an important part of any investment in equity.

GBPCAD SHORT Market structure bearish on HTFs DW
Entry at both Weekly and Daily AOi
Weekly Rejection at AOi
Daily Rejection At AOi
Previous Structure point Daily
Around Psychological Level 1.86000
H4 EMA retest
H4 Candlestick rejection
Rejection from Previous structure
Levels 4.78
Entry 100%
REMEMBER : Trading is a Game Of Probability
: Manage Your Risk
: Be Patient
: Every Moment Is Unique
: Rinse, Wash, Repeat!
: Christ is King.

GBPCHF SHORT Market structure bearish DW
Entry At both Weekly and Daily AOi
Weekly Rejection at AOi
Previous Weekly Structure Point
Daily Rejection At AOi
Previous Structure point Daily
Around Psychological Level 1.11500
H4 EMA retest
H4 Candlestick rejection
Levels 4.39
Entry 100%
REMEMBER : Trading is a Game Of Probability
: Manage Your Risk
: Be Patient
: Every Moment Is Unique
: Rinse, Wash, Repeat!
: Christ is King.

GBPNZD SHORTMarket structure bearish o HTFs 3
Entry at Daily AOi
Weekly Rejection At AOi
Weekly Previous Structure Point
Daily Rejection AOi
Daily Previous Structure Point
Around Psychologiical Level 2.26000
H4 EMA retest
H4 Candlestick rejection
Rejection from Previous structure
Levels 5.14
Entry 110%
REMEMBER : Trading is a Game Of Probability
: Manage Your Risk
: Be Patient
: Every Moment Is Unique
: Rinse, Wash, Repeat!
: Christ is King.

USDCHF SHORT Market structure bearish on HTFs 3
Entry at Daily AOi
Weekly Rejection at AOi
Daily Rejection at AOi
Previous Structure point Daily
Around Psychological Level 0.83000
H4 EMA retest
H4 Candlestick rejection
Rejection from Previous structure
Levels 3.99
Entry 100%
REMEMBER : Trading is a Game Of Probability
: Manage Your Risk
: Be Patient
: Every Moment Is Unique
: Rinse, Wash, Repeat!
: Christ is King.

AUDCAD SHORTMarket structure bearish on HTFs 3
Entry at Daily AOi
Weekly Rejection at AOi
Daily Rejectioon at AOi
Daily EMA retest
Previous Structure point Daily
Around Psychological Level 0.89000
H4 EMA retest
H4 Candlestick rejection
Rejection from Previous structure
Levels 4.15
Entry 105%
REMEMBER : Trading is a Game Of Probability
: Manage Your Risk
: Be Patient
: Every Moment Is Unique
: Rinse, Wash, Repeat!
: Christ is King.

XAU/USD 06 June 2025 Intraday AnalysisH4 Analysis:
-> Swing: Bullish.
-> Internal: Bullish.
Analysis and bias remains the same as analysis dated 23 April 2025
Price has now printed a bearish CHoCH according to my analysis yesterday.
Price is now trading within an established internal range.
Intraday Expectation:
Price to trade down to either discount of internal 50% EQ, or H4 demand zone before targeting weak internal high priced at 3,500.200.
Note:
The Federal Reserve’s sustained dovish stance, coupled with ongoing geopolitical uncertainties, is likely to prolong heightened volatility in the gold market. Given this elevated risk environment, traders should exercise caution and recalibrate risk management strategies to navigate potential price fluctuations effectively.
Additionally, gold pricing remains sensitive to broader macroeconomic developments, including policy decisions under President Trump. Shifts in geopolitical strategy and economic directives could further amplify uncertainty, contributing to market repricing dynamics.
M4 Chart:
M15 Analysis:
-> Swing: Bullish.
-> Internal: Bearish.
Analysis and bias remains the same as analysis dated 22 May 2025.
In my analysis from 12 May 2025, I noted that price had yet to target the weak internal high, including on the H4 timeframe. This aligns with the ongoing corrective bearish pullback across higher timeframes, so a bearish internal Break of Structure (iBOS) was a likely outcome.
As anticipated, price targeted strong internal low, confirming a bearish iBOS.
Price has remained within the internal range for an extended period and has yet to target the weak internal low. A contributing factor could be the bullish nature of the H4 timeframe's internal range, which has reacted from a discounted level at 50% of the internal equilibrium (EQ).
Intraday Expectation:
Technically price to continue bullish, react at either premium of internal 50% EQ or M15 demand zone before targeting weak internal low priced at 3,120.765.
Alternative scenario:
Price can be seen to be reacting at discount of 50% EQ on H4 timeframe, therefore, it is a viable alternative that price could potentially print a bullish iBOS on M15 timeframe.
Note:
Gold remains highly volatile amid the Federal Reserve's continued dovish stance and persistent geopolitical uncertainties. Traders should implement robust risk management strategies and remain vigilant, as price swings may become more pronounced in this elevated volatility environment.
Additionally, President Trump’s recent tariff announcements are expected to further amplify market turbulence, potentially triggering sharp price fluctuations and whipsaws.
M15 Chart:

Short gold after reboundOvernight, gold broke through the 3400 mark due to the intensification of geopolitical risks, but plunged sharply due to the reduction of the risk of Sino-US trade decoupling. Because the news swept up and down, it brought certain difficulties to the transaction. Today, we will focus on the NFP market!
After overnight gold plunged to around 3340, it is currently maintaining a small rebound state. Relatively speaking, the rebound potential is weak, and with the sharp plunge of gold in the short term, the market bulls' confidence has been hit. At present, without major good news, it is difficult to make breakthrough progress based on technical support alone. The upper side faces short-term resistance of 3365-3375 area resistance. If gold cannot break through this area in the short term, gold will be weak!
Trading strategy:
Consider shorting gold in the 3370-3380 area, TP: 3355-3345
USDJPY – Supply Zone Rejection Incoming?June 6, 2025 | Short-Term Bias: Bearish
USDJPY is currently trading around 144.16, testing a key supply zone between 144.25 – 144.45. This area has historically acted as a strong resistance, and we’re now seeing signs of exhaustion after a solid bullish run from the 142.90 demand zone.
🔍 Technical Highlights:
Price is inside a high-probability supply zone, with clear historical rejection at this level.
A strong bearish risk-reward setup is in play, with the target at 142.90 and a stop above 144.456.
The volume profile shows high activity around 144.00–144.25, hinting at possible consolidation or distribution.
Previous structure confirms this level has served as a seller’s stronghold.
📉 Bias:
Leaning bearish as long as price remains below 144.456.
A break and close above that level would invalidate this setup and shift the bias to bullish, targeting the 145.00+ area.
📌 Trade Idea (Not Financial Advice):
Entry: Current level (~144.16)
SL: Above 144.456
TP: 142.90
Let’s see if sellers step in again here, or if bulls are ready to break through. ⚔️
Drop your thoughts below! 👇

Long and short battle break out before NFP,gold operation layout📰 Impact of news:
1. NFP data released
2. Geopolitical situation worsens
3. Trump and Musk start a war of words
📈 Market analysis:
During today's U.S. trading session, we need to pay close attention to the impact of NFP on the market. Bros who trade independently must do a good job of risk control. The gold 1H chart shows that the current gold price is suppressed by the downward opening of the Bollinger Bands. Gold shorts dominate in the short term, and the MACD indicator has a tendency to form a death cross. At the same time, the 5-day moving average and the 10-day moving average form a death cross and move downward, indicating that the gold price is still facing adjustment pressure in the short term. Looking at the 4H chart, we can find that although gold is currently rising on the 4H trend line, gold has not yet fallen back to the right level. Therefore, we cannot rule out the possibility that gold will continue to fall back in the future. The key resistance level above is 3390-3400, and the support level below is 3350-3340, with a focus on the important support level of 3330. Participate in high-altitude and low-multiple in the European session today, and consider retreating to 3350-3340 to place longs
🏅 Trading strategies:
BUY 3350-3340
TP 3365-3385-3395
If you agree with this view, or have a better idea, please leave a message in the comment area. I look forward to hearing different voices.
TVC:GOLD FXOPEN:XAUUSD FOREXCOM:XAUUSD FX:XAUUSD OANDA:XAUUSD

AUDJPY: Pullback Confirmed?! 🇦🇺🇯🇵
There is a high chance that AUDJPY will pull back
from the underlined resistance cluster.
Its false violation, a formation of a bearish imbalance candle
and a breakout of a rising trend line provide strong bearish confirmation.
Goal - 93.185
❤️Please, support my work with like, thank you!❤️
I am part of Trade Nation's Influencer program and receive a monthly fee for using their TradingView charts in my analysis.

EURUSD failing to close above a key daily highThis is a quick analysis but we are at a key bearish range that may give a double top on the weekly/daily. If this Daily mother candle abides by Candle Range Theory mechanics, we will see it's low taken out.
We'll see 🎯

What Is the Hanging Man Candlestick Pattern: Meaning & Trading?What Is the Hanging Man Candlestick Pattern, and How Can You Trade It?
In the world of technical analysis, candlestick patterns play a vital role in helping traders decipher market trends and potential reversals. Among the many setups, the hanging man holds particular significance. This distinctive formation captures traders' attention as it often serves as a warning sign of a possible trend reversal. This article will go through the technical analysis of the hanging man formation and explain how traders can trade with it.
What Is a Hanging Man Pattern?
The hanging man candlestick pattern is characterised by a small body near the top of the candlestick, a long lower shadow, and little to no upper shadow. It resembles a figure hanging from its head, hence the name "Hanging Man."
Psychology Behind the Hanging Man
The psychology behind the hanging man candlestick pattern reflects a shift in market sentiment. After a sustained uptrend, the appearance of this pattern indicates that buyers are losing momentum. The long lower shadow shows that sellers were able to push prices down significantly during the trading session. Although buyers managed to drive prices back up, the close near the open price suggests weakening bullish sentiment. This pattern signals that selling pressure is increasing, potentially leading to a bearish reversal as confidence among buyers diminishes.
The hanging man is a versatile formation that can be applied across a wide range of financial instruments, including stocks, cryptocurrencies*, ETFs, indices, and forex, on different timeframes.
Identifying a Hanging Man Candlestick on Trading Charts
To spot a hanging man pattern in stocks and other financial instruments, you may follow these key steps:
Look for an existing uptrend: Start by identifying a prevailing upward price movement on the chart.
Locate a candlestick with specific characteristics: Search for a candlestick with a small body near the top, a long lower shadow, and little to no upper shadow. This formation resembles a figure hanging from its head. The colour of the candle doesn’t matter, but if it’s bearish, the signal is stronger.
Consider supporting indicators: Utilise other technical indicators or oscillators to further validate the potential reversal. These can include trendlines, moving averages, or momentum indicators that align with the bearish interpretation.
Note that there is no such thing as an inverted hanging man candlestick or a bullish hanging man candlestick pattern.
Trading the Hanging Man Pattern
Those trading the hanging man reversal pattern need to apply a systematic approach in order to increase the likelihood of successful trades. Here are a few steps traders usually follow to trade this pattern:
- Identification: Identify the setup by using the steps mentioned above.
- Look for confirmation signals: The setup alone is not sufficient for making trading decisions. Seek additional confirmation through subsequent candlestick patterns or technical indicators. This can include bearish candlestick patterns (e.g. bearish engulfing or shooting star), a breach of support levels, or the convergence of other indicators signalling a potential reversal.
- Define your entry point: An entry point can be either when the next candlestick confirms the bearish sentiment or when the price breaches a significant support level.
- Consider risk management: Assess the risk-reward ratio of the trade and ensure it aligns with your risk tolerance. For efficient risk management, you may adjust your position size accordingly. Risk management tools like position sizing, setting stop-loss orders, and diversification may help protect your capital. You may set a stop-loss order above the hanging man pattern to limit potential losses if the trade goes against you.
- Identify profit targets: The candlestick itself doesn't provide specific targets. Traders can identify profit targets by looking at previous support levels, Fibonacci retracement levels, or other technical analysis tools like moving averages or pivot points.
- Monitor the trade: Keep a close eye on your position as it progresses. Pay attention to any changes in market conditions or additional signals that may invalidate the trade.
- Learn from outcomes: Regardless of the outcome of the trade, analyse it afterwards to identify areas for improvement. Assess whether the setup provided accurate signals and identify any factors that may have affected its success. This analysis will help refine your trading strategy over time.
Live Market Example
Consider the example of a hanging man on the forex USDJPY pair. An entry is placed on the next bearish candlestick with a stop loss just above the hanging man. The take profit order is at the next level of support marked by the orange line.
Limitations of the Hanging Man Candlestick
The hanging man candlestick pattern, while useful, has certain limitations that traders need to consider:
- False Signals: The hanging man can produce false signals, especially in volatile markets where price movements are erratic.
- Market Context: The effectiveness of the pattern varies depending on the broader market context and prevailing trends.
- Timeframe Sensitivity: Its reliability can differ across various timeframes; what works on a daily chart may not be as effective on an intraday chart.
- Not Standalone: It should not be used in isolation but as part of a comprehensive trading strategy that includes other indicators and risk management tools.
Comparing the Hanging Man to Similar Candles
Understanding how the hanging man pattern differs from similar candlestick patterns helps in accurate technical analysis. Here's a brief comparison of the hanging man with related patterns.
What Is the Difference Between a Hanging Man and a Hammer?
Both have the same candle structure. However, the hanging man candlestick occurs in an uptrend and signals a potential bearish reversal, while the hammer occurs in a downtrend, indicating a potential bullish reversal. Interestingly, it is possible to see a hanging man candlestick in a downtrend, often as part of a bullish retracement. Both candles require confirmation from subsequent price movements. They should be analysed within the context of the overall market trend and other technical indicators.
What Is the Difference Between a Pin Bar and a Hanging Man?
A pin bar and a hanging man are both single-candlestick patterns with small bodies and long shadows, but they serve different purposes in technical analysis. The pin bar has a small body and a long tail, indicating a reversal, but it can appear in any market condition. Its long tail shows a strong rejection of a certain price level, with the body pointing in the direction of the anticipated reversal.
The hanging man, however, specifically occurs after an uptrend and signals a potential bearish reversal, characterised by a small body at the top and a long lower shadow, indicating selling pressure.
What Is the Difference Between a Shooting Star and a Hanging Man Candlestick?
The shooting star and the hanging man are both bearish reversal patterns, but they differ in their appearance and context. A shooting star occurs after an uptrend and features a small body at the bottom with a long upper shadow, indicating that the price was pushed up significantly but fell back down, showing strong selling pressure.
The hanging man also appears after an uptrend but has a small body at the top with a long lower shadow, suggesting that sellers dominated the session despite an initial push by buyers. Both require confirmation from subsequent candlesticks to validate the reversal.
Final Thoughts
While the hanging man alone is insufficient for making trading decisions, it serves as a warning signal that buyers may be losing control and that selling pressure could increase. Traders seek additional confirmation through subsequent candlestick patterns, support and resistance levels, and other technical indicators to validate the potential reversal.
By understanding the implications of the setup within the broader market context and employing proper risk management strategies, traders can enhance their decision-making process and improve their chances of identifying different trading opportunities.
FAQ
What Does the Hanging Man Pattern Indicate?
The hanging man trading pattern in technical analysis typically indicates a potential trend reversal in an uptrend. It suggests that the buyers, who have been driving the market higher, are losing control, and the selling pressure may increase.
The hanging man is represented by a small body near the top of the candlestick, a long lower shadow, and little to no upper shadow. It resembles a figure hanging by the neck. This visual representation conveys the potential bearish sentiment.
Can a Hanging Man Candle Be Bullish?
No, there is no such thing as a bullish hanging man candlestick pattern. The bearish hanging man pattern indicates a potential trend reversal from an uptrend to a downtrend.
Is the Hanging Man Pattern Reliable?
The reliability of the formation, like any candlestick pattern, can vary depending on several factors. While the setup is widely recognised and considered a potential bearish reversal signal, it should not be relied upon as the sole basis for trading decisions. It is crucial to consider other factors and confirmation signals to increase its reliability.
What Is the Confirmation Candle for the Hanging Man?
A confirmation candle for the hanging man is a bearish candlestick that follows the pattern, confirming the reversal. This can include a bearish engulfing candle or a candlestick closing well below the hanging man's body, indicating increased selling pressure.
Is the Hanging Man Pattern Bearish?
Yes, it is generally considered a bearish pattern in technical analysis. It is formed when the price’s open or close is near or at its high, there is a significant decline during the trading session, and it closes not far from the opening price. The pattern resembles a hanging man with his legs dangling.
*Important: At FXOpen UK, Cryptocurrency trading via CFDs is only available to our Professional clients. They are not available for trading by Retail clients. To find out more information about how this may affect you, please get in touch with our team.
This article represents the opinion of the Companies operating under the FXOpen brand only. It is not to be construed as an offer, solicitation, or recommendation with respect to products and services provided by the Companies operating under the FXOpen brand, nor is it to be considered financial advice.

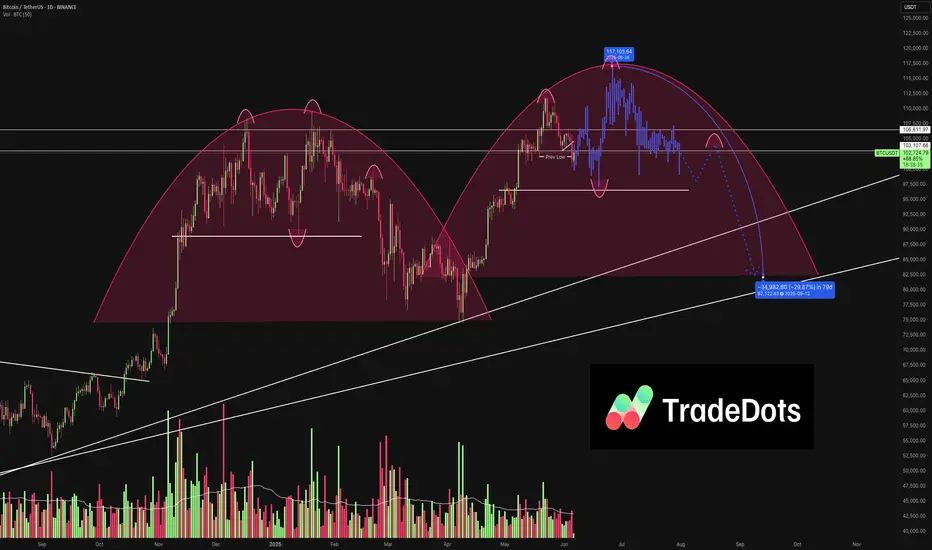
Is Bitcoin Repeating Its 2021 Price Action? | TRADEDOTSWe’ve observed that Bitcoin CME:BTC1! appears to be repeating a previous wave pattern. If it follows its historical price action yet again, here’s what we might expect:
2021 Comparison
Back in 2021, Bitcoin formed two large rounded wave structures where the second wave exceeded the first, forming two consecutive all-time highs followed by a huge drawdown. This year’s price action looks very similar to the beginning of the second 2021 waves. If it continues to unfold in the same way, we anticipate a new all-time high before the end of this year, followed by a notable pullback into early next year.
Key Support at $96,000
As long as BTC holds above $96,000, the bullish trend remains intact. This level has shown great demand and volume support, reinforcing its role as the floor for the short-term uptrend.
Upside Potential to $117,000
If buyers continue to support the market above $96,000, BTC could reach the $117,000 region, setting another all-time high. This expectation follows the earlier wave pattern seen earlier this year and completes a close parallel to the 2021 bull run.
Deeper Pullback Expected
After a potential new high, a larger correction is likely. Drawing on previous pullback price action, a 30% dip toward $82,000 could align with a higher-time-frame trendline and significant support area—mirroring the wave structure from 2021.
Final Thoughts
BTC remains structurally bullish above $96,000
A pullback to the $82,000 region could present a key buying opportunity if it occurs.
A Contrarian View On the US DollarI don't recall the last bullish headline I saw for the US dollar, bearish sentiment may be stretched, and I'm seeing plenty of clues across the US dollar index and all FX majors that we could at least be looking at a minor bounce. Whether it can turn into a larger short-covering rally is likely down to Trump's trade deals. Either way, I'm, on guard for an inflection point for the dollar.
Matt Simpson, Market Analyst at City Index and Forex.com

Is there still hope for the bull market to rise today?📰 Impact of news:
1. Progress made in talks between China and the USA
📈 Market analysis:
In view of the non-agricultural data to be released on Friday, the market is expected to maintain a volatile consolidation trend before then. From the daily level: the Bollinger Bands open gently, the gold price is running below the upper track 3414, and the MACD golden cross is running slowly, suggesting that the bullish momentum is weak. At the hourly level, the short-term short position is strong, and there is a certain rebound demand. Therefore, we pay attention to the 3343-3333 support line below, focusing on the 3300 support. After the gold price falls below the 3360 support, the 3360 position will suppress the gold price in the short term.
🏅 Trading strategies:
BUY 3343-3333
TP 3360-3370-3380
SELL 3360-3370
TP 3330-3320
If you agree with this view, or have a better idea, please leave a message in the comment area. I look forward to hearing different voices.
OANDA:XAUUSD FX:XAUUSD FOREXCOM:XAUUSD FXOPEN:XAUUSD TVC:GOLD

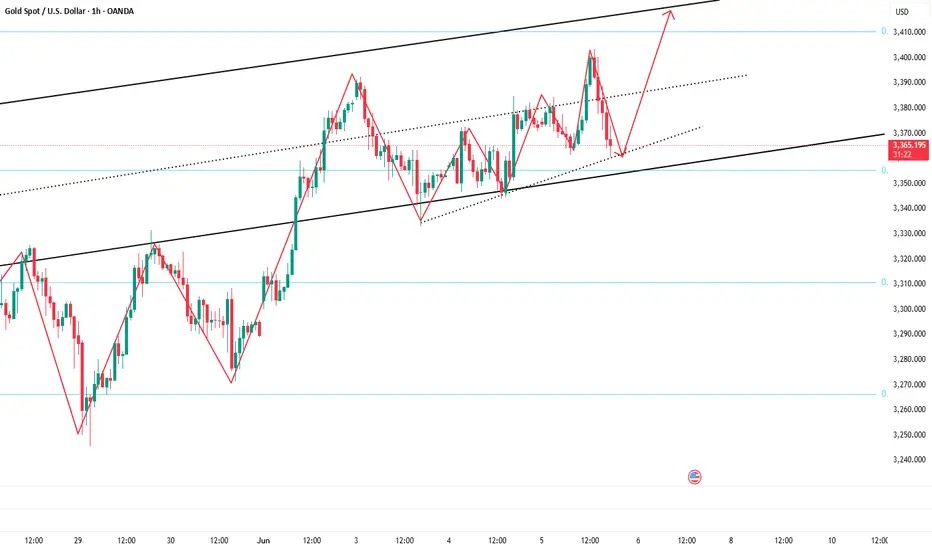
Buy gold, there is still potential to hit 3400Gold gradually fell after touching 3403, and the current lowest has fallen to 3364. Has the gold bull market ended? In fact, I think the gold retracement is a good time to buy, and I am not afraid of gold retracement.
From the overall perspective of the day, gold did not fall below the 3360 mark during today's retracement. This area has become the intraday strength and weakness dividing line. As long as gold can stay above 3360, I think gold still has the potential to continue to rebound. Moreover, the tariff issue and geopolitical conflicts have not been effectively resolved, which is still favorable for gold in terms of fundamentals. Moreover, gold has broken through 3400 twice. I think the bull market will not end easily, and there is still the potential to test 3400 again, and it may even rise to the 3410-3420 area.
Trading strategy:
Consider shorting gold in the 3365-3355 area, TP: 3390-3400
LLY Daily: Navigating Key Levels - Two Strategic OpportunitiesOVERVIEW:
LLY has recently undergone a significant correction from its highs, finding strong demand at a crucial support zone. Price action now presents two distinct, high-probability long entry scenarios based on the stock's interaction with key horizontal levels. My analysis outlines potential entry points, clear targets, and risk management.
KEY OBSERVATIONS & MARKET STRUCTURE:
Major Demand Zone Established:
Following a notable pullback in early May, LLY found substantial buying interest within the lower green horizontal zone (approximately $680 - $710). This area has acted as a robust "Support Trade" zone, preventing further downside and initiating a corrective bounce.
Corrective Rally & Intermediate Resistance:
From this strong support, LLY mounted a decent rally, completing a clear W-formation or basing pattern (highlighted by the orange and blue zig-zag lines).
Price is currently interacting with an intermediate resistance level / supply zone (the upper grey/light green horizontal zone around $755 - $775). This level represents a critical point of contention between buyers and sellers.
Two Strategic Entry Scenarios:
The current market context offers two distinct long entry approaches, each with its own risk/reward profile:
Scenario 1: Breakout Trade (Orange Ellipse / "1st Entry Above 775")
A. Condition: This strategy focuses on a decisive breakout and sustained close above the current intermediate resistance level (approx. $775). A strong daily candle closing above this zone would confirm bullish momentum.
B. Entry: Look for price action to confirm the breakout, potentially on a retest of the broken resistance now acting as support (as indicated by the orange arrow and ellipse). An entry above $775 is targeted here.
C. Risk Management: A stop-loss should be placed just below the breakout level and the recent swing low, ideally around $745.33 (bottom of the red box).
Scenario 2: Support Trade (Blue Ellipse / "2nd Entry 710")
A. Condition: This strategy anticipates a potential rejection from the current intermediate resistance, leading to a pullback to the primary demand zone (approx. $710).
B. Entry: Look for strong bullish reversal signals (e.g., bullish engulfing candle, hammer, demand zone rejection) if price retraces to the lower demand zone around $710 (indicated by the blue arrow and ellipse). This offers a potentially lower risk entry with a better risk-to-reward ratio for the same targets.
C. Risk Management: A stop-loss would be positioned just below the main support zone, around $675.70 (bottom of the larger red box).
POTENTIAL TARGETS:
Regardless of the entry scenario, our upside targets remain consistent based on prior price structure and supply zones:
• 1st Target: $860 (Green Zone): This is a significant resistance level from earlier price action, representing the first major hurdle for buyers.
• 2nd Target: $920 (Upper Green Zone): This represents the ultimate upside target, aligning with the previous all-time highs and a major supply zone.
INVALIDATION:
• For "Breakout Trade" (1st Entry): A sustained daily close below $745.33 would invalidate this specific trade idea.
• For "Support Trade" (2nd Entry): A sustained daily close below $675.70 would invalidate the entire bullish bias derived from the primary demand zone and suggest further downside is likely.
CONCLUSION:
LLY is presenting clear technical setups after finding substantial support. Traders can opt for an aggressive Breakout Trade if momentum sustains through intermediate resistance, or a more conservative Support Trade if price retraces to the established demand zone. Both strategies aim for significant upside potential towards $860 and $920, with clearly defined risk management levels.
Risk Management is Paramount : Always adhere to your stop-loss and position sizing to protect your capital. This is not financial advice; do your own research.
Disclaimer:
The information provided in this chart is for educational and informational purposes only and should not be considered as investment advice. Trading and investing involve substantial risk and are not suitable for every investor. You should carefully consider your financial situation and consult with a financial advisor before making any investment decisions. The creator of this chart does not guarantee any specific outcome or profit and is not responsible for any losses incurred as a result of using this information. Past performance is not indicative of future results. Use this information at your own risk. This chart has been created for my own improvement in Trading and Investment Analysis. Please do your own analysis before any investments.
