Gold trend analysis and layout before ADP data release📰 Impact of news:
1. May ADP data
2. The geopolitical situation worsens
📈 Market analysis:
Today, the gold price in the Asian session hit the 3370 line and then began to fall. Before the release of the ADP data, the gold price is likely to fall into a volatile pattern. The upper short-term resistance is 3370-3380. Pay attention to whether it can break through 3392, which will determine whether the short-term gold price can reach 3400. Pay attention to the support below 3350-3345, and focus on the 3330 line support. Once it falls below 3330, the gold price may reach 3317. If the ADP data is released and stabilizes near 3317, and then quickly closes the long lower shadow. Then you can rely on the 3317 to enter the market and do more. As long as it rebounds to above 3330 again, then the high point near 3390 above will definitely not be maintained. On the contrary, if gold falls below the 3330 and 3317 levels during the US trading session, don't go long easily. Participate in the high-altitude and low-multiple cycle during the European session. If it retreats to 3355-3345, consider going long with a light position and look at 3360-3370. If it touches 3375-3390 and is under pressure, consider shorting. Focus on ADP data!!
🏅 Trading strategies:
BUY 3355-3345
TP 3360-3370
SELL 3375-3390
TP 3350-3340
If you agree with this view, or have a better idea, please leave a message in the comment area. I look forward to hearing different voices.
OANDA:XAUUSD FX:XAUUSD FOREXCOM:XAUUSD FXOPEN:XAUUSD TVC:GOLD
Candlestick Analysis

EURUSD: Pullback From Support Confirmed 🇪🇺🇺🇸
Update for our yesterday's setup on EURUSD.
It feels like the pair has successfully completed a retracement,
respecting an intraday horizontal support.
A double bottom formation on that and a formation of a bullish
imbalance candle provide a strong bullish confirmation.
I think the pair may rise at least to 1.144 support soon.
❤️Please, support my work with like, thank you!❤️
I am part of Trade Nation's Influencer program and receive a monthly fee for using their TradingView charts in my analysis.

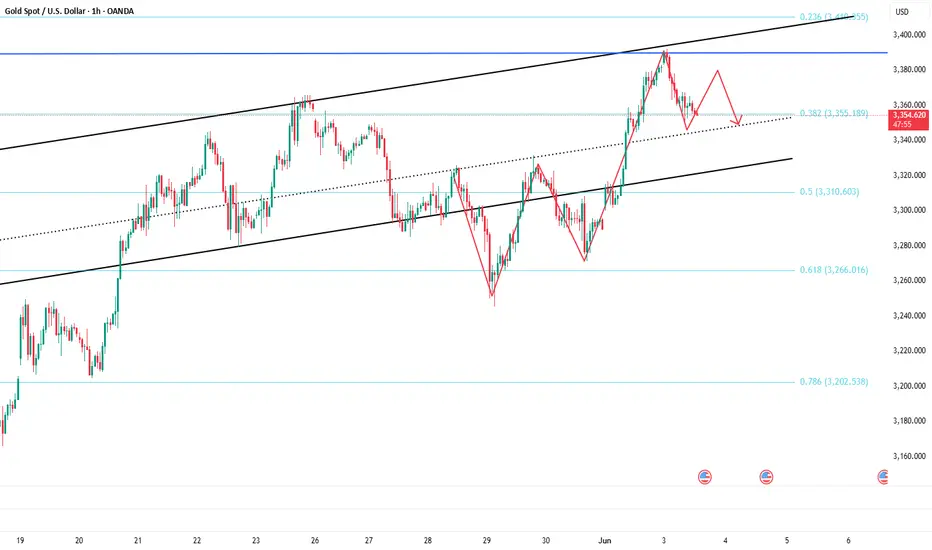
Continue to short gold after the reboundTechnical analysis:
Gold rebounded after hitting 3333 overnight. So far, it has reached 3361. However, it can be clearly seen from the rebound process that the rebound is not strong, so I think the rebound space may not be too high. In the short term, it faces resistance in the 3365-3375 area. The strong resistance above the 3390-3400 area still exists, so it may be difficult for bulls to make a major breakthrough in the short term; and the support area below in the short term is in the 3340-3330 area, and the important support is in the area around 3320;
Trading strategy:
Consider shorting gold in the 3365-3375 area, TP: 3350-3340
Australian Dollar Setups: AUD/USD, EUR/AUD, AUD/NZD, AUD/JPYAn update to the prior Aussie dollar video, where I reassess the setups and decide which ones I prefer.
Matt Simpson, Market Analyst at City Index and Forex.com.

USD/CHF: Squeeze Risk Builds After Bullish ReversalRisk of a countertrend squeeze in USD/CHF is building after it printed a bullish engulfing candle on Tuesday, breaking out of the falling wedge it had been trading in over recent weeks.
While the price signal alone is bullish, to get excited about the prospect of a meaningful squeeze higher, USD/CHF needs to clear minor resistance overhead at .8246. If it can get a foothold above this level, it would generate a setup where longs could be established with a stop beneath for protection. .8333 looms as a potential target—a known resistance level that also has the key 50-day moving average sitting just above it.
Momentum indicators remain bearish but are starting to turn higher, suggesting the bearish flows that pushed USD/CHF to multi-week lows on Monday may be starting to ebb.
Good luck!
DS

Buy gold, TP: 3355-3365Technical aspect:
Gold stopped falling and rebounded after touching 3333. The highest price has only rebounded to 3353. It seems that the bullish potential is weak and the rebound is weak. However, the gold candlestick chart closed with a long lower shadow after touching 3333, proving that there is a certain degree of buying support below; if gold can maintain above 3340-3330 in the short term, gold bulls still have the opportunity to rebound to 3355-3365;
From the perspective of morphological structure, as long as gold remains above 3330, the gold bull structure has not been effectively destroyed, and bulls still have the opportunity to counterattack. It also proves that the buying support below is effective, and the bottoming and rebounding structure is established in the short term, so we can still consider continuing to go long on gold in short-term trading.
Trading strategy:
Consider the 3345-3335 area as support, and try to go long on gold in small batches;TP:3355-3365

NZDCAD SHORTMarket structure bearish on HTFs DH
Entry at both Daily and Weekly AOi
Weekly Rejection at AOi
Daily rejection at AOi
Previous Structure point Daily
Around Psychological Level 0.82500
H4 EMA retest
H4 Candlestick rejection
Rejection from Previous structure
Levels 3.72
Entry 100%
REMEMBER : Trading is a Game Of Probability
: Manage Your Risk
: Be Patient
: Every Moment Is Unique
: Rinse, Wash, Repeat!
: Christ is King.

Long orders have made profits, gold layout in the evening📰 Impact of news:
1. Economist: The Federal Reserve may cut interest rates sharply in December
2. Lee Jae-myung, candidate of the Democratic Party of Korea, was elected president of South Korea
📈 Market analysis:
Currently, the gold price is in a consolidation pattern, showing an overall volatile pattern during the day. The hourly Bollinger Bands are opening downward, and the MACD indicator is running in a dead cross. In the short term, the bears have a certain advantage. However, observing the 4H level, it can be found that the RSI indicator crosses when entering the overbought area, suggesting that the risk of a correction in the short term has increased. For evening operations, it is recommended to wait for the gold price to stabilize before entering the market, focusing on the important support of 3335-3325. If it obtains effective support and stabilizes in this range, the gold price may resume its upward trend. If it falls below 3325, the bullish momentum will be weakened. Therefore, it is recommended to wait for a pullback to 3335-3325 to go long in the US market, and look to 3350-3370 in the short term.
🏅 Trading strategies:
BUY 3335-3325
TP 3350-3370-3400
If you agree with this view, or have a better idea, please leave a message in the comment area. I look forward to hearing different voices.
TVC:GOLD FXOPEN:XAUUSD FOREXCOM:XAUUSD FX:XAUUSD OANDA:XAUUSD

The latest trend analysis and operation layout of Europeanmarket📰 Impact of news:
1. Speech by the Federal Reserve during the US trading session
2. Geopolitical and tariff issues
📈 Market analysis:
Recently, the escalation of the Russia-Ukraine conflict and global trade tensions has pushed international gold prices to rise strongly. Although Russia and Ukraine reached a consensus on prisoner exchange in the second round of negotiations on Monday, the ceasefire agreement remained deadlocked. Coupled with the US announcement of additional steel tariffs, geopolitical risks and economic uncertainties stimulated risk aversion sentiment.
From a technical perspective, the upward trend of gold since 3120 is clear. After breaking through 3340 on Monday, it accelerated to test the 61.8% Fibonacci resistance level of 3396, but the pressure at the 3400 integer mark is significant. At the same time, 3330 below is still the current key support level. The current decline in gold prices is more like a technical correction to yesterday's rise. Yesterday, we reminded everyone to pay attention to the 3355 level. The intraday operation suggestion for the European session is 3355-3345. You can try to go long and look at the 3370-3380 line. If it breaks through effectively, it will test the 3396 or even 3400 line; if it fails to break through the upper resistance, it will fall into a range of fluctuations.
🏅 Trading strategies:
BUY 3355-3345
TP 3370-3380-3390
SELL 3370-3380
TP 3350-3340-3330
If you agree with this view, or have a better idea, please leave a message in the comment area. I look forward to hearing different voices.
OANDA:XAUUSD FX:XAUUSD FOREXCOM:XAUUSD FXOPEN:XAUUSD TVC:GOLD

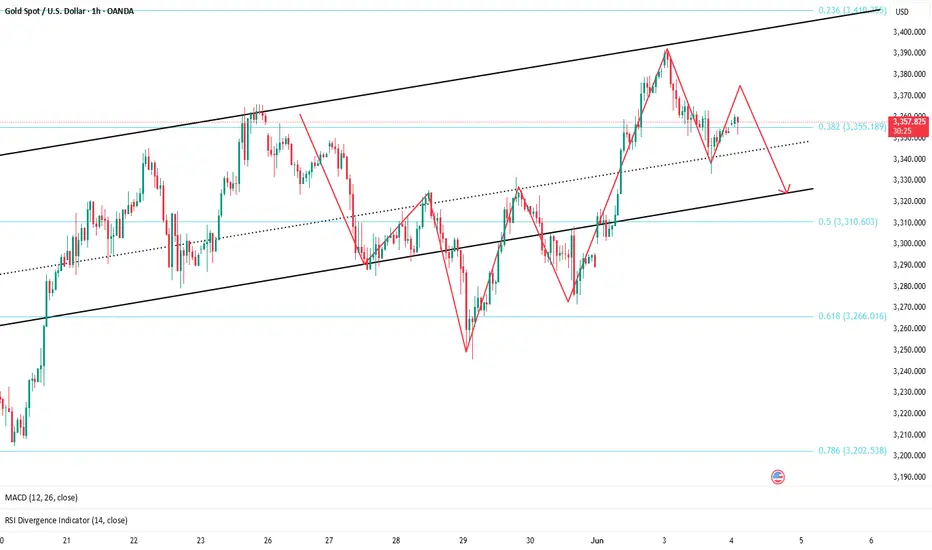
Under pressure in the short term, short gold after rebound!In the short term, gold has risen sharply under the simultaneous stimulation of tariffs and geopolitical conflicts, but it has gradually fallen back after reaching around 3392, and has not broken through the 3400 mark in one fell swoop, indicating that the bullish momentum does not have the potential to continue to rise for the time being, so it may still need a certain degree of technical support, so gold has a need to retrace in the short term;
In addition, if gold continues to retrace, then there may be a structural form at the technical level that offsets the short-term double bottom structure support, so gold may also form a double top structure in the short term. The first thing we need to pay attention to is the resistance near 3370, followed by the resistance near 3390; and below we must first pay attention to the support near 3345, followed by the 3330-3320 support area.
Trading strategy:
1. Consider continuing to short gold in the 3370-3380 area, TP: 3355-3345;
2. If gold first retreats to the 3345-3335 area and does not fall below this area, consider going long on gold; TP: 3360-3370
Safe Haven Demand Places Gold Front and CentreYou could have been mistaken into thinking that the down move in Gold at the back end of last week, which saw it trade to a low of 3271 on Friday and then close the week only slightly higher at 3288, was the type of price action that reflected tired long positioning and may have led to further tests of deeper support levels between 3245 (May 28th low) and 3204 (May 20th low).
However, that has not been the case, with traders rushing back to Gold as an important safe haven asset, as a rise in trade tensions between the US and China and an escalation in geo-political risks after Ukraine carried out long range drone strikes deep into Russia on Sunday, while Russia carried out attacks on Kyiv, threw the outcome of crucial peace talks between the two nations into doubt.
Yesterday, this fresh demand for Gold saw prices surge 2.8% to a high of 3383 and then continue that move up to a high of 3392 this morning in early Asia trading before some profit taking led prices back lower towards 3350 area again.
Looking forward across the rest of today, and the remainder of the week, Gold could remain in focus for several reasons, the first as traders await the outcomes of key data updates on the health of the US economy provided by the ISM Services PMI survey released tomorrow at 1500 BST, then by the Non-farm Payrolls release which comes out on Friday at 1330 BST.
The second reason may well be as traders await fresh news regarding the progress of trade negotiations between the US and China, which includes an update on whether President Trump and Xi will speak directly to each other at some stage this week. Yesterday the White House stated again that a call between the leaders of the world's two biggest economies was likely, however there has been no comment from the Chinese side so far.
The third, could be linked to how Russia and Ukraine move forward this week after peace talks concluded yesterday in Istanbul with very limited progress on a ceasefire or peace deal. Traders may well remain sensitive to news of any fresh attacks, the potential of further peace talks or comments from President Trump on the current stalemate.
Technical Outlook: Back to Potential Resistance?
It has been an impressive rally in the price of Gold since the 3120 May 15th session low, as both geo-political and trade tensions have increased again. This activity might be leading some to ask if this price strength may open a more sustainable phase of price strength, or represent a limited price recovery, before selling pressure materialises again.
Much will clearly depend on future market sentiment and news updates to help us gauge the answer to these potential questions, but does technical analysis offer clues to possible future price trends?
Potential Resistance Levels:
As impressive as latest price strength appears, traders may well now be asking, has this advance broken important resistance levels which could suggest possibilities of a push to higher levels? So far at least, it might be argued that it hasn’t yet.
From a technical perspective, evidence of selling pressure developing at a lower level each time a price recovery is seen, might be an indication that sellers are happy to be active earlier. This may be construed as a potentially negative sentiment, which may in time lead to further price declines.
So far this morning on June 3rd, at the time of writing, the latest recovery high has been 3392, which is lower than the upside extreme posted at 3435, on May 6th.
Traders may be focusing on this 3435 failure high as a resistance level and an important point that may need to be broken to suggest the pattern of lower price highs is ending.
A successful break of these 3435 highs if seen, might then suggest a more extended phase of price strength back towards the 3500 April 22nd all-time Gold high.
Potential Support Levels:
To the downside, price weakness appears to have recently been supported by 3289, which is equal to the 38.2% Fibonacci retracement of May 15th to June 3rd strength, and if the pattern of lower highs and lower price lows is to extend, it might be closing breaks under 3289 that skew risks to the downside.
Such downside breaks while not a guarantee of further price weakness, might lead to further price weakness towards 3225, which is the lower 61.8% Fibonacci retracement, and even on to 3120, which is the May 15th session price low.
The material provided here has not been prepared in accordance with legal requirements designed to promote the independence of investment research and as such is considered to be a marketing communication. Whilst it is not subject to any prohibition on dealing ahead of the dissemination of investment research, we will not seek to take any advantage before providing it to our clients.
Pepperstone doesn’t represent that the material provided here is accurate, current or complete, and therefore shouldn’t be relied upon as such. The information, whether from a third party or not, isn’t to be considered as a recommendation; or an offer to buy or sell; or the solicitation of an offer to buy or sell any security, financial product or instrument; or to participate in any particular trading strategy. It does not take into account readers’ financial situation or investment objectives. We advise any readers of this content to seek their own advice. Without the approval of Pepperstone, reproduction or redistribution of this information isn’t permitted.

Nifty Analysis EOD – June 3, 2025 – Tuesday🟢 Nifty Analysis EOD – June 3, 2025 – Tuesday 🔴
Opening Sentiment vs. Reality: A Day of Dual Personality
Nifty opened with a 70-point gap-up above the previous day’s high, carrying a positive vibe. In just one minute, it surged another 57 points, marking the day’s high at 24,845. However, that bullish momentum didn’t last. The index faced strong resistance, leading to a sharp 243-point drop within 15 minutes, breaching CPR and the previous swing low to hit the first Current Day Low (CDL) at 24,601.30.
Despite the jolt, Nifty showed resilience—bounced back from the 24,625–24,640 zone, recovered to VWAP, and even retested the PDH. Yet again, it failed to hold above 24,700, echoing the morning's rejection. A second wave of selling took Nifty to a fresh low of 24,502.15 mid-session.
The closing wasn’t any better. Nifty quietly slid again, retested the breakout zone, and closed at 24,542.50, nearly at the intraday low—a day that started with hope ended on a pessimistic note.
Interestingly, India VIX also dropped, despite the downward market move—signalling premium crush and a double whammy for option buyers who got the direction right but profits wrong.
🛡 5 Min Chart with Levels
📊 Daily Summary Highlights
✅ Gap-up Start but sharp reversal
📉 Both PDH and PDL tested intraday
📉 Marubozu Engulfing Candle
⚠️ Closed below Higher Swing Low – a potential trend-shift signal
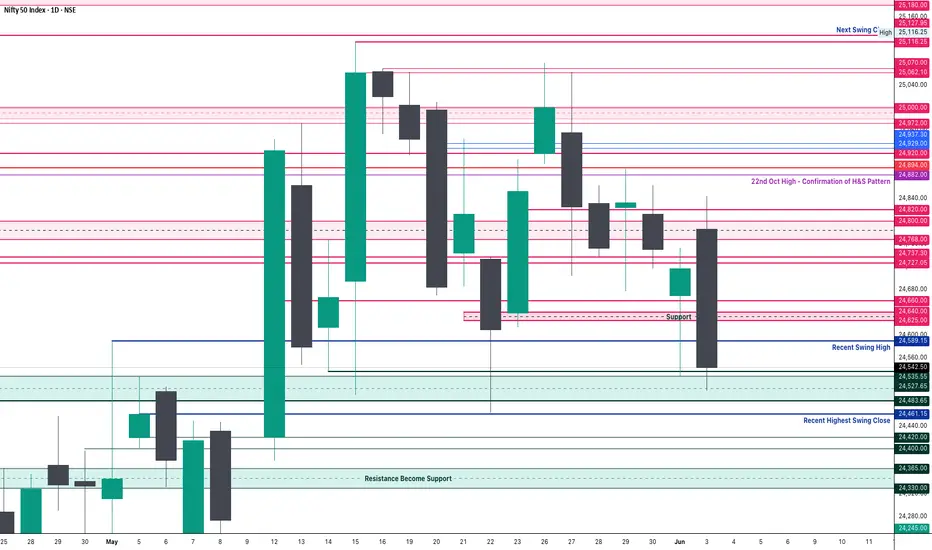
🕯 Daily Time Frame Chart
🕯 Daily Time Frame Chart
🕯 Daily Candle Breakdown
Open: 24,786.30
High: 24,845.10
Low: 24,502.15
Close: 24,542.50
Net Change: −174.10 (−0.70%)
🕯 Candle Structure
Real Body: 243.80 pts (Big red candle)
Upper Wick: 58.80 pts
Lower Wick: 40.35 pts
Interpretation
A classic bearish reversal day. Price opened higher, reached a new high, but was aggressively sold off, closing near the day’s low. This large-bodied red candle with small wicks shows clear control by the bears.
Candle Type
🟥 Bearish Marubozu-like Candle
Strong rejection at highs
Bearish dominance confirmed
Lower close signals momentum continuation to the downside
Key Insight
24,845 now acts as a firm resistance.
Break below 24,500 could accelerate correction.
Bulls need to defend 24,500–24,520 zone decisively to avoid further weakness.
🛡 5 Min Intraday Chart
⚔️ Gladiator Strategy Update
ATR: 279.13
IB Range: 243.80 → Medium IB
Market Structure: Balanced
Trades:
🔻 12:50 PM – Short Triggered → 📍 1:1 Target Achieved, but timeout
📌 Support & Resistance Zones
Resistance Levels
24,600
24,625 ~ 24,640
24,660
24,727 ~ 24,737
24,768 ~ 24,800
24,820
24,882
24,894 (Strong Resistance)
Support Levels
24,530 ~ 24,480
24,460
24,420 ~ 24,400
24,365 ~ 24,330
24,245 ~ 24,240
💭 Final Thoughts
The market showcased a classic reversal and punished emotional entries. Despite the gap-up euphoria, technical levels reigned supreme. The break below swing low could signal caution for bulls in the coming sessions.
📌 "Respect the levels, not the emotions. Every bounce is not a bottom; every fall isn’t a crash."
✏️ Disclaimer
This is just my personal viewpoint. Always consult your financial advisor before taking any action.
What is a Bearish Breakaway and How To Spot One!This Educational Idea consists of:
- What a Bearish Breakaway Candlestick Pattern is
- How its Formed
- Added Confirmations
The example comes to us from EURGBP over the evening hours!
Since I was late to turn it into a Trade Idea, perfect opportunity for a Learning Curve!
Hope you enjoy and find value!

Bull Rally Losing steam as international factors weigh in. The Bull rally that we saw in Nifty in the last one month or so is losing a little steam as international factors related to escalating Russia and Ukraine war and International Tariff war start to weigh in. This made it difficult for Nifty to hold on to levels above 25000 after making a high of 25116 in the current rally. After making a high it is any substantial rally would try to consolidate and find a reasonable bottom from where it can launch again. Verifying a solid support is necessary for rally to move forward.
The supports for Nifty currently are at: 24515, 24185 (Mother line important support), 23945, 23689 (Father line important support). If 23689 is broken the bears will be very active again and can potentially drag down nifty to 23214, 22902 or even 22666. So 24185 and 23689 are important levels for Nifty to hold.
The Resistances for Nifty currently are at: 24838, 25116 (Important Resistance level, recent high). Sustaining above 25116 and Nifty closing above it can enable next leg of the rally which can take us in future to next resistance levels of 25438, 25641, 25845 and 26K+ levels.
The market might be speculating Russian response to Ukraine Drone attack. The scale of Russian attack if it happens will determine the movement of market. The local factors are mostly in favour of Indian markets. So long term investors should not worry. Traders and short term investors should avoid taking unnecessary risk as situation on international front. Geo-Political risk in the subcontinent, at Israel front and Between Russia and other EU nations should be on the hindsight of any decision making. Additionally there are rising number of COVID cases in India which can also become a factor which can effect market sentiment.
Disclaimer: The above information is provided for educational purpose, analysis and paper trading only. Please don't treat this as a buy or sell recommendation for the stock or index. The Techno-Funda analysis is based on data that is more than 3 months old. Supports and Resistances are determined by historic past peaks and Valley in the chart. Many other indicators and patterns like EMA, RSI, MACD, Volumes, Fibonacci, parallel channel etc. use historic data which is 3 months or older cyclical points. There is no guarantee they will work in future as markets are highly volatile and swings in prices are also due to macro and micro factors based on actions taken by the company as well as region and global events. Equity investment is subject to risks. I or my clients or family members might have positions in the stocks that we mention in our educational posts. We will not be responsible for any Profit or loss that may occur due to any financial decision taken based on any data provided in this message. Do consult your investment advisor before taking any financial decisions. Stop losses should be an important part of any investment in equity.

Below the current price, several demand zones have been marked!Gold Analysis (1H Timeframe):
On the 1-hour chart, Gold has previously formed a bearish engulfing candlestick pattern, which signaled a potential reversal and has since led to a downward move in the market. At present, another bearish engulfing pattern has formed, suggesting renewed selling pressure. If the price retraces back to this level, there is a high probability that it may continue to decline from there.
Below the current price, several demand zones have been marked. These zones correspond to areas where bullish engulfing patterns have previously formed or are likely to form. These zones have been carefully filtered for quality and relevance.
The recommended approach is to patiently wait for the price to enter these demand zones. If the market provides a valid bullish confirmation signal (such as bullish candlestick formations, divergence, or volume confirmation) within these zones, it could present a high-probability buying opportunity.
> ⚠️ Disclaimer: This analysis is for educational purposes only. Always conduct your own research (DYOR) before making any trading decisions. This is not financial advice.

Long trade
4Hr TF overview
Trade Journal Entry — PEPEUSDT (Buyside Trade)
🗓 Date: Sunday 1st June 2025
⏰ Time: 12:00 PM
📍 Session: London PM
📈 Timeframe: 4-Hour (Swing Setup)
📊 Market Structure Tool: Higher Low Formation + FVG Entry
🧠 Confirmation Tool: Break of Structure + Discounted Entry Zone
15min TF overview
🔹 Trade Details:
Entry Price: 0.00001188
Take Profit: 0.00001356 (+14.14%)
Stop Loss: 0.00001138 (−4.21%)
Risk-Reward Ratio: 3.36
🔹 Technical Breakdown:
Market Structure:
Price formed a higher low in line with bullish trend continuation.

BTC - High Level Analysis (DAILY TF)Just a DAILY tf view of the High Level Analysis.
> It shows where the price may range in the next few days, weeks or months.
Key points:
We need a monthly candle above the yearly high(2024) in order for BTC
to continue its bullish momentum.
Otherwise, we expect it to range on the 92kish to 111kish area (with possible low time frame wicks on both top or bottom)

Long trade
BTCUSDT (Buyside Trade)
🗓 Date: Sunday, 1st June 2025
⏰ Time: 5:30 PM
📍 Session: New York PM
📈 Timeframe: 15-Minute (Intraday Setup)
📊 Market Structure Tool: Break of Structure + FVG (Fair Value Gap) Retest
🧠 Confirmation Tool: RSI overbought
🔹 Trade Details:
Entry Price: 103,982.44
Take Profit: 105,989.05 (+1.93%)
Stop Loss: 103,730.44 (−0.24%)
Risk-Reward Ratio: 7.96
🔹 Technical Breakdown:
Market Structure:
The price broke out of its recent range and confirmed a higher high.
Entry taken on retest into a bullish FVG within the discount zone.
Order Flow / Liquidity:
The liquidity grab below the short-term low provided a clean spring setup.
Quick absorption followed by a bullish engulfing candle confirmed entry.

BTC - High Level Analysis (monthly)High level analysis of BITCOIN for the next few days, weeks or months

USDCHF: Important Breakout 🇺🇸🇨🇭
USDCHF broke and closed below a neckline of a huge
head and shoulders pattern on a daily time frame.
It turned into a strong resistance cluster now.
I believe that the price will drop to that at least to 0.81 support.
❤️Please, support my work with like, thank you!❤️
I am part of Trade Nation's Influencer program and receive a monthly fee for using their TradingView charts in my analysis.

Evening gold analysis and trading point layout📰 Impact of news:
1. Fed's Goolsbee: Despite the unresolved tariff issue, it is still believed that interest rates are expected to fall in the next 12 to 18 months
2. May PMI data is positive
3. Russian media: Russia lists the full withdrawal of Ukrainian troops from Russian territory as one of the ceasefire options
📈 Market analysis:
Judging from the 4H chart, gold is currently fluctuating around the 3370 line, and the bulls are still relatively strong. We should pay attention to the short-term support at 3365-3355 below, and the short-term suppression at 3385-3395 above. If it breaks through the upper suppression, we will pay attention to the 3400 line suppression position. The recent market fluctuations have been relatively large, so bros must set take-profit and stop-loss when trading independently!
🏅 Trading strategies:
BUY 3365-3355
TP 3370-3380-3400
If you agree with this view, or have a better idea, please leave a message in the comment area. I look forward to hearing different voices.
TVC:GOLD FXOPEN:XAUUSD FOREXCOM:XAUUSD FX:XAUUSD OANDA:XAUUSD

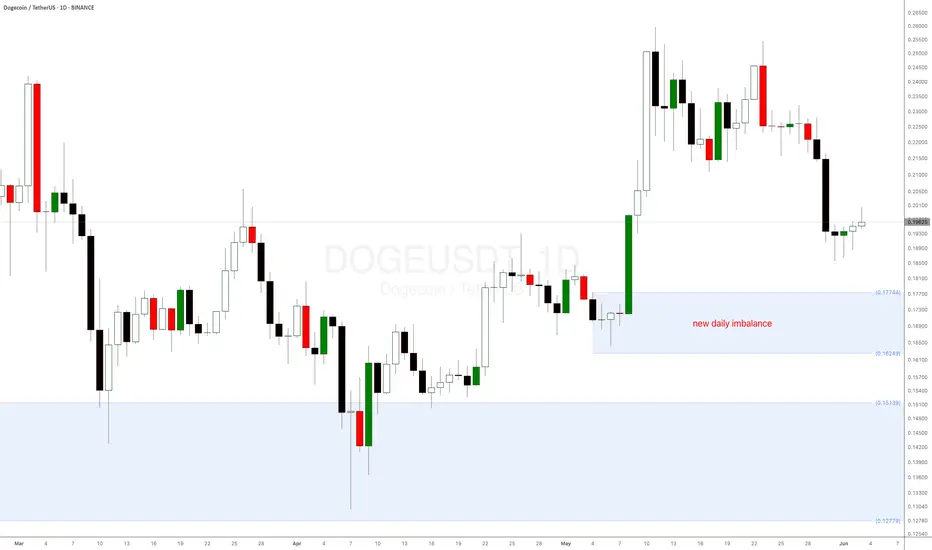
How to Spot the Perfect Dogecoin Buy Signal!Dogecoin (DOGE) is showing another major bullish signal!
After bouncing from the key weekly demand level at $0.151 mentioned in a previous supply and demand crypto analysis, DOGE coin is now approaching a new daily demand imbalance at $0.18035—a level where buyers have historically stepped in aggressively.
Why This Matters:
Strong Reaction Expected: Similar imbalances on other altcoins have led to sharp upward moves.
Long-term weekly imbalance: The weekly demand level is playing out very well.
Dogecoin (DOGE), the world’s favourite meme cryptocurrency, is trying to reach a critical weekly demand level at $0.151—its strongest daily demand zone in a long time! This presents a prime buying opportunity, especially for crypto beginners looking to enter the market.
Check the previous DOGE analysis from a few weeks ago.
EURUSD: Important Bullish Breakout The EURUSD broken above an important resistance zone on the daily chart.
We see its retest now.
I anticipate that the price will continue to rise from this point, aiming for a minimum target of 1.1515.
