USDCAD: Will It Drop Lower? 🇺🇸🇨🇦
I successfully predicted a bearish move on USDCAD on Friday.
Because the trend is bearish, I think that the pair may drop
even below a current structure low.
Next strong support that I see is 1.3652.
It might be the next goal for the bears.
❤️Please, support my work with like, thank you!❤️
I am part of Trade Nation's Influencer program and receive a monthly fee for using their TradingView charts in my analysis.
Candlestick Analysis

Nifty Analysis EOD – June 2, 2025 – Monday🟢 Nifty Analysis EOD – June 2, 2025 – Monday 🔴
“Relaxed day... if you forget the first and last 20 minutes!”
Nifty opened flat with a slightly negative tone and, within the first 20 minutes, collapsed over 200 points, hitting an intraday low of 24,526. However, the day had other plans. A slow and steady recovery followed, with Nifty reclaiming almost all its losses by mid-session. But just when things looked stable, the index shed 88 points in the final 20 minutes, eventually closing at 24,716.60, just 34 points lower than the previous close.
If you ignore the volatility of the first and last few minutes, the day felt calm—almost deceptive. Small and mid-cap stocks, along with Bank Nifty, saw a positive day, showcasing broad market strength despite Nifty’s indecisiveness.
🛡 5 Min Chart with Levels
📌 Diamond Pattern BreakoutAs discussed in yesterday’s note, the diamond pattern on the daily and 5-min chart finally saw a breakout today—and yes, the target was achieved. But let’s be real: with all the action packed into the opening move, most traders (including me) missed the train. A frustratingly textbook pattern—but a tricky execution.
🕯 Daily Time Frame Chart
📊 Daily Candle Breakdown
Open: 24,669.70
High: 24,754.40
Low: 24,526.15
Close: 24,716.60
Change: −34.10 (−0.14%)
Candle Structure:
🟩 Green Candle: Close > Open (46.90 pts body)
🔻 Lower Wick: 143.55 pts – Strong buying at the dip
🔺 Upper Wick: 37.80 pts – Limited rejection from top
Interpretation:Despite closing slightly lower, the candle reflects strong intraday buying after a deep dip. The long lower shadow shows support around 24,520–24,550 is active. Close near the top half signals buyers held their ground after early weakness.
Candle Type:🔨 Hammer-like: Bullish sentiment hidden in the chaos.
Key Insight:
Holding above 24,755 can trigger a fresh bullish leg.
Breach of 24,520 may invite more selling pressure.
🛡 5 Min Intraday Chart
⚔️ Gladiator Strategy Update
ATR: 272.03
IB Range: 191.40 → 🔴 Wide IB
Market Structure: ImBalanced
Total Trades: 0
12:35 – Long signal came, but entry didn’t trigger. No trades taken.
🧭 Support & Resistance Levels
📈 Resistance Zones:
24,727 ~ 24,737
24,768 ~ 24,800
24,820
24,882
24,894
24,920
24,972 ~ 25,000
25,062 ~ 25,070 (5th rejection!)
25,116 ~ 25,128
25,180 ~ 25,212
25,285 ~ 25,399
📉 Support Zones:
24,700
24,660
24,640 ~ 24,625
24,590
24,530 ~ 24,480
24,460
🧠 Final Thoughts
"Structure se hi samjho... market bhale chhup jaye, lekin footprint chhod deta hai."Diamond breakout ho gaya, lekin execution ne dhoka diya. Lesson? Stay ready—patterns repeat, but you only profit if you’re prepared.
✏️ DisclaimerThis is just my personal viewpoint. Always consult your financial advisor before taking any action.

Don't chase long positions easily during high-level adjustments📰 Impact of news:
1. The conflict between Russia and Ukraine breaks out again, exacerbating the uncertainty of the situation
2. The tension in the Middle East continues, Iran claims to be ready to defend its airspace at any time, and the Houthi armed forces attack Israeli airports
3. May PMI data released
📈 Market analysis:
In the short term, the double high points above the gold price are suppressed at the 3365 line. The MACD indicators at the 4H and daily levels tend to form a golden cross, releasing bullish signals. In the short term, if you want to confirm a unilateral upward trend, you need to break through the 3365 line. Despite the strong bullish signals, as I just reminded you, the current technical indicators are close to overbought areas, and I still think there is a certain risk of a correction. In the European session, I will consider trying to short at the 3355-3365 line, and pay attention to the short-term support at 3340-3330 line below. Later, after the price gets some support at the support level, we can consider long trades.
🏅 Trading strategies:
SELL 3355-3365
TP 3340-3330-3320
If you agree with this view, or have a better idea, please leave a message in the comment area. I look forward to hearing different voices.
OANDA:XAUUSD FX:XAUUSD FOREXCOM:XAUUSD FXOPEN:XAUUSD TVC:GOLD

$USDT.D is going to hit the 4.9% level right at the 200 EMACRYPTOCAP:USDT.D is going to hit the 4.9% level right at the 200 EMA — expecting a rejection here.
📉 Targeting pullback to 4.5–4.3%, even 4.0%.
This move = bullish for crypto. Just a corrective wave, not full risk-off.
Watch for rejection confirmation — next rally could be loading.

Nasdaq giving hints of bearishness failing to close above rangePlease review what I think I'm seeing. If you have any comments in regard to these potential levels they are always welcome.
I believe we may be actually bearish from here but without a daily close below the highest block, my decided choice must be neutral. Purely mechanical analysis will save your portfolio 💎
Don't forget to subscribe & share this with someone who is learning 🙏🏾

Capture SwingPrice broke head & shoulders neckline and retested it.
Price formed new lower low and lower high all bearish market structure.
Strong rejection with shooting star at the neckline.

EURUSD Short June 2, 2025EURUSD Sell – June 2, 2025
Bearish narrative across the board. HTF aligned with daily OB + D trend, plus clear liquidity sitting at previous weekly and daily highs.
On LTF, we had clean 15m bearish structure forming during Asia, and price tapped into the HTF OB during London open, rejecting from session high.
Entry was based on tap (0.5% Risk) and will reenter with another 0.5% after 1m BOS.
Partials taken at 1:3 RR, with final TP set at Asia low for full move.

GBPUSD: Important Breakout📈GBPUSD has surpassed and closed above a crucial intraday horizontal resistance level.
The highlighted blue region represents the neckline of a cup and handle pattern.
This breakout suggests further upward movement.
The next resistance level is at 1.3580.

Bitcoin needs to hold the major support at 104,5 k on 2 WeekBitcoin needs to close above the previous 2 week candles to confirm the next major upside move. A close below would most likely lead to a drop in next week. 9th of June we will know for sure what the future has for us.
BITSTAMP:BTCUSD
COINBASE:BTCUSD
NASDAQ:MSTR
CME:BTC1!
CRYPTOCAP:OTHERS
COINBASE:ETHUSD
BINANCE:SOLUSD

DXY Update..PWL takenGood day traders I’m back yet again with another update but this this it’s DXY(dollarindex)).
Price has taken previous week’s low, and for me that’s the manipulation phase in the power of 3 because my bias is bullish on the dollar and bearish on foreign currencies. Price has taken the PWL in a zone/area where we saw price react higher in that BPR zone/area. For the rest of the week I personally believe we can expect higher prices on DXY, Atleast till the midpoint of that gap above price. ICT teaches more on the importance of that halfway/midpoint of gaps and other PD arrays.
Since we are in a discount zone we can expect price to move higher into the premium range of the daily TF dealing range and our first liquidity (internal) is also inside the premium zone.

Clean Long Setup After Liquidity SweepThe EUR/USD trend is still bullish and is likely to continue at least toward the liquidity beyond the equal highs. We'll consider entering if a bullish setup forms.
🔍 My Trading Approach:
My trading and analysis are primarily based on market liquidity and how price tends to move toward areas where liquidity is pooled.
I use two main concepts in my strategy:
Fair Value Gaps (FVGs) to identify setups and entry zones
Measured Moves (MMs) to define target levels
🎯 Profit-Taking Rule:
I usually secure profits once price has moved at least 1.5 times the initial stop-loss distance in my favor.

Potential Short Setup Within a Bullish Context
It seems that EURUSD has formed nested setups, indicating potential short-term bearish movement. Signs point to a possible short setup targeting the 4H order block. However, since this move would go against the prevailing higher-timeframe trend, the probability of it playing out might be lower.
🔍 My Trading Approach:
My trading approach is built around price imbalances and liquidity. I focus on aligning entries with session timings, identifying daily bias and key liquidity levels, and using tools like FVGs for precise execution.
🎯 Profit-Taking Rule:
I usually secure profits once price has moved at least 1.5× the stop-loss distance in my favor

Is the positive news fading? The latest analysis of gold📰 Impact of news:
1. The conflict between Russia and Ukraine breaks out again, exacerbating the uncertainty of the situation
2. The tension in the Middle East continues, Iran claims to be ready to defend its airspace at any time, and the Houthi armed forces attack Israeli airports
3. May PMI data released
📈 Market analysis:
As geopolitical conflicts between Russia and Ukraine and the Middle East broke out again over the weekend, gold jumped higher today. From a technical perspective, the 1H chart shows a bullish arrangement, but the gold price is in a downward channel at the daily level. The gold price is currently near the middle track of the Bollinger Band and is obviously suppressed by the downward channel. The 4H level Bollinger Bands narrowed, the moving averages adhered, the long and short positions were in a stalemate, and the MACD indicator hovered around the 0 axis. 3330 - 3335 above is the key resistance area. If it breaks through 3340, it is expected to continue to see new highs. At the same time, there is short-term support in the 3285-3280 range below. 3270 - 3265 becomes the key important support. If it falls below, it may fall to 3245. For short-term operations in the Asian and European sessions today, if the resistance area of 3325-3335 cannot be effectively broken through, you can consider shorting and look towards 3310-3290 in the short term.
🏅 Trading strategies:
SELL 3325-3335
TP 3310-3290
If you agree with this view, or have a better idea, please leave a message in the comment area. I look forward to hearing different voices.
TVC:GOLD FXOPEN:XAUUSD FOREXCOM:XAUUSD FX:XAUUSD OANDA:XAUUSD

EURUSD Forms Rising Wedge + Evening Star_ Bearish SetupAs I expected in the previous idea , the EURUSD ( FX:EURUSD ) started to rise after breaking the upper line of the descending channel and hit the Long Position target with Risk-To-Reward: 1.46 .
The EURUSD is trading near the Resistance zone($1.149-$1.142) .
From a Classic Technical perspective, EURUSD appears to be completing a Rising Wedge Reversal Pattern . Also, a good sign for a EURUSD reversal is the formation of an Evening Star Candlestick Pattern near the upper line of the rising wedge pattern.
Also, we can see the Regular Divergence(RD-) between Consecutive Peaks .
In terms of Elliott Wave theory , I think the EURUSD corrective waves are NOT over yet, and it seems that EURUSD has completed the main wave X inside the rising wedge pattern.
I expect EURUSD to decline to at least $1.126 AFTER breaking the lower line of the wedge pattern.
Note: If EURUSD touches $1.14903 , we can expect more pump.
Please respect each other's ideas and express them politely if you agree or disagree.
Euro/U.S. Dollar Analyze (EURUSD), 4-hour time frame.
Be sure to follow the updated ideas.
Do not forget to put a Stop loss for your positions (For every position you want to open).
Please follow your strategy and updates; this is just my Idea, and I will gladly see your ideas in this post.
Please do not forget the ✅' like '✅ button 🙏😊 & Share it with your friends; thanks, and Trade safe.

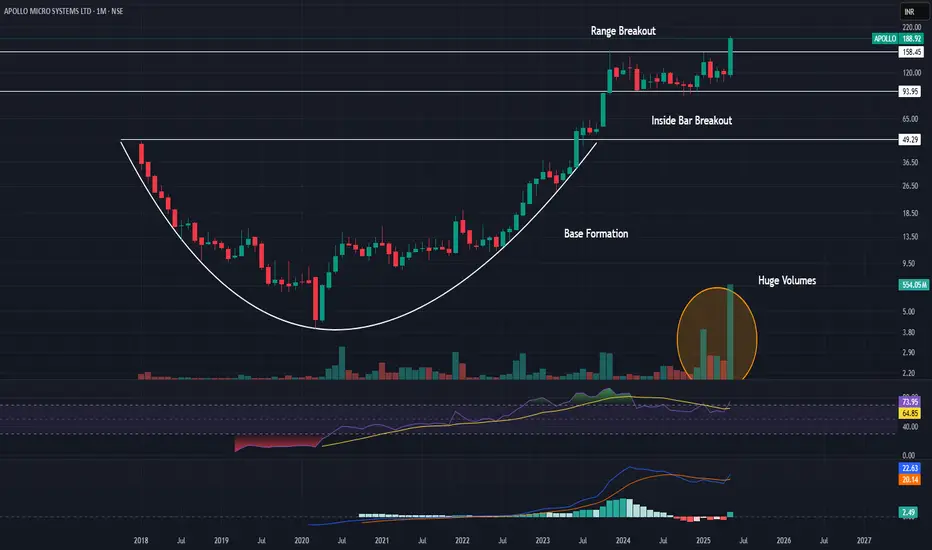
Flag Breakout in Apollo Micro Systems1. Inside Bar Breakout
2. Good Volume
3. Consolidation Breakout
4. RSI above 70
5. MACD signal turning green
Small Clues In A Big Breakout PatternSilver has been consolidating as of late and if there's one thing we no about contraction is that it eventually leads to expansion aka a breakout.
The issue with this particular setup is that based on location of the pattern, there's no predetermined directional bias for the breakout.
Therefor, what we're doing today is looking for small clues that the market has provided to give us any type of edge in predicting a breakout one way or another and guess what. WE FOUND SOME!
If you have any questions or comments, please leave them below!
Akil

FOMO & An Inside Bar Entry Into A Larger Head & Shoulder PatternAn handful of lessons in this video so hang on.
1) We take a look at the dangers that come with entering a trade too early & what you should do if you ever find yourself in that situation.
2) A discussion ion inside bars, what they are, how to trade them and an indicator that will help you spot them.
3) How to use that inside bar as an entry reason into a bigger head and shoulders pattern on the larger timeframe.
Please leave any questions or comments below!
Akil

Learning#01 : Master Candle Theory🕯️ Master Candle Theory:
The Hidden Price Action Signal Most Traders Overlook
Introduction
In a world full of overcomplicated indicators and conflicting signals, sometimes the simplest patterns reveal the deepest insights. Master Candle Theory is one such underrated concept — a clean, structure-based method of reading price that often signals major breakouts before they happen.
Whether you're a beginner trying to understand price behavior or a seasoned trader looking to tighten your entries, this article will break down how to identify, understand, and apply Master Candle setups in real markets.
🔍 What is a Master Candle?
A Master Candle (MC) is a single large candlestick that fully engulfs the range (high to low) of the next 3 to 5 candles.
To qualify as a Master Candle:
The candle must have a relatively large range.
The next 3–5 candles should form completely within the high and low of that Master Candle.
These inside candles usually show reduced volatility and indecision.
This creates a "box" or price compression zone, which often leads to a significant breakout.
📊 Why It Matters
Price moves in cycles: expansion → contraction → expansion.
Master Candle formations represent the contraction phase — a build-up of pressure. Traders watching for breakouts from these formations can catch the next expansion leg with better precision.
Key benefits:
Clear structure: Easy to identify on any time frame.
Built-in risk control: The high and low of the MC give natural breakout and stop-loss levels.
Works across markets: Forex, crypto, indices — the principle applies universally.
🛠️ How to Trade the Master Candle Setup
Step 1: Identify the Master Candle
Look for a candle with a wide range.
Confirm that the next 3–5 candles stay within the high-low range of the MC.
Step 2: Mark the MC Range
Draw horizontal lines at the high and low of the MC.
This defines your breakout zone.
Step 3: Wait for a Breakout
Price should break out clearly above or below the MC range.
Volume increase or confirmation candle helps strengthen the signal.
Step 4: Manage the Trade
Entry: On breakout close or retest of the MC boundary.
Stop-loss: Just inside the opposite side of the MC.
Targets: Use previous structure, Fibonacci, or a fixed R:R ratio (e.g., 1:2+).
☠️ Pro Tips and Common Mistakes
✅ Best on higher time frames: MC setups are more reliable on 1H and above.
✅ Look for confluence: Combine MC setups with support/resistance, trendlines, or moving averages for higher probability trades.
❌ Avoid trading inside the MC range: It’s a zone of uncertainty — wait for confirmation.
❌ Don’t force the setup: Not every big candle is a Master Candle. Let the market show you clean, well-formed patterns.
🧠 Kiran’s Approach:
Real-World Application of Master Candle Theory
While the core theory is powerful on its own, I’ve refined a method that filters noise and improves accuracy using a multi-timeframe strategy I call HTF ~ LTF (Higher Time Frame vs. Lower Time Frame).
Here’s how I apply it in my day-to-day trading:
Identify the Master CandleI start by spotting a valid Master Candle and marking its high and low. This forms my breakout zone.
Define the No-Trade ZoneThe middle of the MC range is what I call the No-Trade Zone — a chop area where false breakouts are common. I avoid trading within this midrange.
Use HTF ~ LTF Confluence for BreakoutsOnce the price breaks the high or low of the Higher Time Frame (HTF) Master Candle, I don’t enter right away. Instead, I drop down to the Lower Time Frame (LTF) and wait for a candle to close beyond that breakout level.
Entry ConfirmationMy entry is taken above the high of the breakout candle on the LTF (for long setups), and vice versa for shorts. This gives me an added layer of confirmation and filters out weak breakouts.
Target and Stop-Loss
Target:
The full range of the Master Candle.
Stop-Loss:
For long trades: below the low of the MC.
For short trades: above the high of the MC.
⏱️ Ideal Time Frame Pairings
To apply the HTF ~ LTF (Higher Time Frame vs. Lower Time Frame) approach effectively, I use different time frame combinations based on the style of trade:
⏱️ For Intraday Trades:
Higher Time Frame: 15-minute or 25-minute
Lower Time Frame: 5-minute
⏱️ For Swing Trades:
Higher Time Frame: 75-minute or 1-Day
Lower Time Frame: 25-minute
⏱️ For Positional Trades:
Higher Time Frame: 1-Week
Lower Time Frame: 75-minute
This layered approach has helped me filter out noise, catch stronger momentum moves, and keep my trades structured and disciplined.
📈 Real Market Example
👻 Valid Breakout with Target Example :
👻 Valid Breakout with Partial Target Example :
👻 False Breakout with Valid Breakout Example :
📚 Final Thoughts
Master Candle Theory is a great way to bring structure and patience into your trading. Instead of chasing price, you’re learning to anticipate breakouts and position yourself logically.
Like all strategies, it’s not a magic bullet — but with the right discipline and context, Master Candles can become a high-probability tool in your technical arsenal.

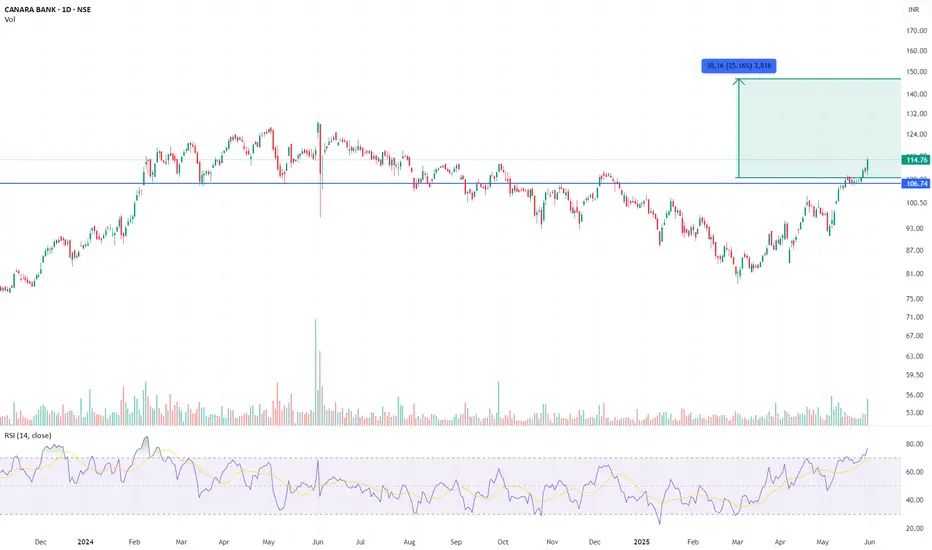
Canara Bank – Breakout With Retest, Momentum BuildingBullish | Timeframe: 1Y | Type: Positional Swing
Chart Setup:
Canara Bank has broken out of a 15-month consolidation zone above the ₹112–₹114 resistance, which acted as a neckline. Price rallied sharply from the ₹85 base, and the breakout was supported by strong volumes and momentum.
The most recent candle shows a shallow retest, with an intraday dip to ₹109 followed by a strong close above the breakout zone — classic confirmation of support holding.
Measured Move Target: ₹150–₹160
Invalidation / Stop Loss: Close below ₹108
Rationale:
Strong price-volume structure
Retest of breakout zone successful
PSU banking theme in favour
Momentum intact above all major moving averages
Disclaimer:
This idea is purely for educational purposes and reflects a technical setup based on chart patterns and price action. It is not a recommendation to buy or sell securities. PSU banks can be volatile and sensitive to macro/policy triggers. Traders should manage risk independently, use stop-loss, and size positions based on personal risk tolerance. Always do your own due diligence before taking any trade.
Final BTCUSD update..Good day traders, here is my final update on BTCUSD and I like how price has been respecting our PD arrays. Keep in mind traders price moving in waves and what again😂😂🏃🏾♂️, point is today is the last trading day for the week and my thoughts is that we can expect BTCUSD to start going higher today and tomorrow maybe till Tuesday …sorry I’m being too sure but if you focus on time and price you start to KNOW(ledge) things or maybe I should say secrets?!🤨🤔
I always expect price to manipulate higher if my bias is shorts, ICT’s power of 3 works wonders when it come to this thought process.
Watch how price reacts to the FVG where price is trading now, it’s not a signal just watch out price moves always from it for the rest of today.
We only going high to shoot lower…keep that in mind!!🤯

GBPJPY update!!Good day traders, I’m back with yet another beautiful setup on GJ and I really wish we can all monitor how price plays out and learn more about price signature.
For this setup I’ll explain more about it after the fact because it’ll help me make my point clearer and easily understandable.
Yet another gift..🎁🧧

Short trade
1Hr overview
📘 Trade Journal Entry — DOGEUSDT (Sell-side Trade)
🗓 Date: Friday, 30th May 2025
⏰ Time: 3:00 PM
📍 Session: Tokyo to London PM
📈 Timeframe: 1hr (intraday/swing)
📊 Market Structure Tool: Price Action — Lower Highs + Liquidity Sweep
🧠 Confirmation Tool: Bearish structure break + Premium pricing zone
🔹 Trade Details:
Entry Price: 0.20466
Take Profit: 0.18205 (−11.05%)
Stop Loss: 0.20691 (+1.10%)
Risk-Reward Ratio: 10.05
🔹 Market Structure:
Bearish price action is evident, characterised by a sequence of lower highs and lower lows.
Entry aligned with price returning to the premium zone before resuming its downward trend.
Liquidity Sweep & Confirmation:
Entry followed a sweep of local highs, indicating engineered liquidity.
Immediate rejection at the sweep point and entry at the confirmation candle.
Momentum:
Strong bearish momentum post-entry, with volume confirming sell-side intent.

S&P 500 Index -- Weekly Volatility Potential Good Afternoon!
This week, I want to talk about the CBOE:SPX and its weekly potential for how I read historical volatility to weight it then to implied volatility -- this creates my custom trading ranges.
Implied ranges for this week are calculated at 4 DTE using my strength of IV method. You can find out more how I do this over at my highlights page on 'X' - Find me @askHVtobidIV
We are entering a short week, with IV currently in the 89th percentile for the year ( 18.31% ) and resonating between bi-weekly ( 19.36% ) and monthly ( 15.13% ) historical values. Quarterly volatility trends ( 31.79% ) have risen more than 10% this year alone due to macro concerns and increased news from tariff uncertainties. This is creating a volatile environment that, in turn, only increases our trading ranges. Something I personally like.
Near-term trends are above the currently high IV environment, suggesting further expansion. This provides premium value on what is happening to what is projected to happen and a “strength of IV” of >100% indicating rising volatility, slowly towards quarterly means, while resonating around monthly trends.
If price action drives downwards, our gap from May 16th could fill around $5,692.56 with confluence of HV21 trends at $5,710.91.
Conversely, I can see HV10 ranges with rising pricing action and good macro news with EU tariffs breaking $5,971.33—Expanding to the price of $5,995.95 with continuing expansion and regression towards means.
Come back next weekend as I will review the chart to see how we developed!
For those interested in volatility analysis and the application of weighted HV ranges to IV, I encourage you to BOOST and share this post, leave a comment, or follow me to join me on this journey.
