Gold shocks extreme pull, US market layout🗞News side:
1. Musk issued the "strongest" condemnation of Trump
2. Trump and Netanyahu failed to reach an agreement, and the US-Iran negotiations may be "disrupted" by Israel
📈Technical aspects:
The trading strategy we have given is still valid. The current gold price trend on the hourly chart shows a standard descending flag pattern. If this pattern continues to be effective, there is a high possibility that the gold price will fall below 3285-3280. Once it falls below this range, as we gave in the strategy this morning, it may fall to the 3260-3250 line. However, the premise for this expectation to be established is that the gold price cannot break through and stabilize on the upper track of the consolidation channel, otherwise the descending flag pattern will be invalid. Therefore, for US market operations, short positions can be arranged around the upper rail of 3325, paying attention to the suppression effect; for the lower rail, first pay attention to the support effect of 3300.
sell 3325-3330
TP 3310-3300
buy 3290-3280
TP 3310-3320
If you agree with this view, or have a better idea, please leave a message in the comment area. I look forward to hearing different voices.
FOREXCOM:XAUUSD FXOPEN:XAUUSD TVC:GOLD FX:XAUUSD OANDA:XAUUSD
Candlestick Analysis

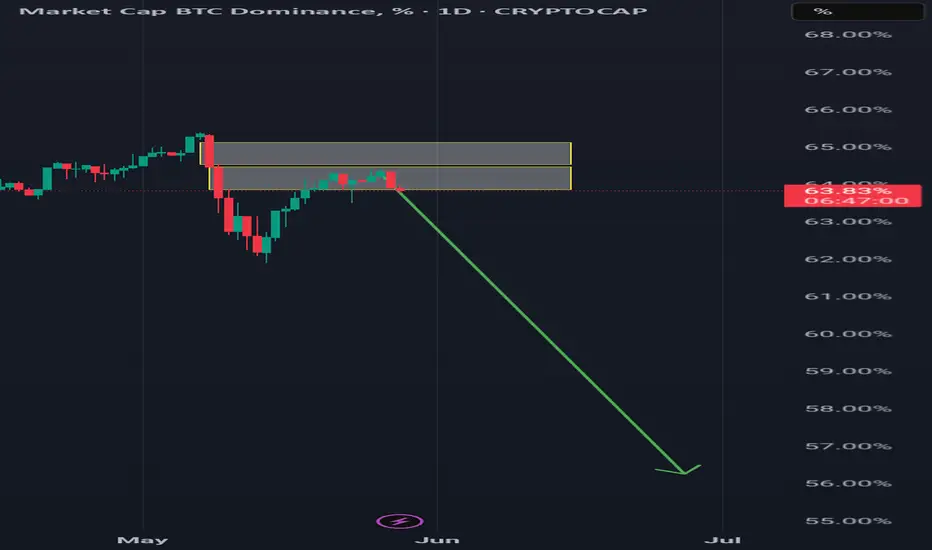
$BTC.D is starting to show relative weakness to AltcoinsCRYPTOCAP:BTC.D is starting to show relative weakness to Altcoins.
This could be a real liquidity rotation from Bitcoin into Altcoins.
Or just Bitcoin taking a breather before stealing the show again.

Nasdaq analysis: 29-May-2025Good morning, everyone! Today's Nasdaq analysis is designed to educate and empower. Use these insights to refine your price action trading strategy.

Gold trading zones: 29-May-2025Good morning! Find today's Gold trading zones and enhance your market analysis.

HEDERAset up LONG 1:1 quick
Disclaimer on Money Management for Trading in the Futures MarketFutures trading carries high risks and may result in the loss of your entire capital. Only use funds you can afford to lose, set risk limits, and understand the market and leverage. Diversification does not guarantee profits. Consult a financial advisor before trading. All decisions and losses are your sole responsibility.

EU Prints Three Black Crows!FX:EURUSD has printed a strong Triple Candlestick Pattern called Three Black Crows after having made a 50% Retracement of the failed Higher High @ 1.1407.
This 50% Retracement found price testing a Previous Low and Resistance Zone where price now has broken a Previous Level of Structure being Support and is now on its way up to Retest this Break!
If Price is able to Retrace back to the Level of Structure @ ( 1.1336 - 1.1340 ) and shows signs of Resistance, this could deliver Short opportunities to take Price down to the Next Levels of Support @ 1.131 & 1.126!

How to draw support and resistance levels the right way?
1️⃣ Why Are Support and Resistance Levels So Important?
Support and resistance levels show where price has reacted strongly in the past. These are zones where many traders including large players have placed buy or sell orders.
Support = where buyers step in and push price up
Resistance = where sellers step in and push price down
These levels are important because they act like decision zones:
- Price might bounce from these levels
- Or break through and start a new move
- Or even fake out traders before reversing again
Knowing where these levels are gives you an edge:
- You can better time your entries and exits
- You avoid chasing price in the middle of nowhere
- You prepare for market reactions not random guesses
Think of them like traffic lights for the market when price hits them, something important usually happens.
2️⃣ Three Main Types of Support and Resistance
There are 3 key types of support and resistance levels traders commonly use:
- Level-Based: Horizontal zones drawn from key highs and lows
- Pattern-Based: Support/resistance found in chart patterns like triangles, flags, etc.
- Channel-Based: Diagonal trendlines showing support and resistance in a channel
Today, we focus on level-based support and resistance horizontal lines drawn on key price zones.
3️⃣ How to Draw Support and Resistance Levels
Use daily, weekly, or monthly timeframes to find major zones. These higher timeframes give you stronger, more respected levels.
Look for:
- Candle bodies that close and open around the same price
- Strong wicks rejecting a certain level
- Zones where price has bounced multiple times in the past
I often pick:
- The close of a red candle
- The open of the next green candle
These spots usually show where sellers lost control and buyers stepped in — or vice versa.
4️⃣ Timeframes and Their Strength
The higher the timeframe, the stronger the level:
- Monthly = very strong, long-term zones
- Weekly = strong and reliable
- Daily = useful for swing trading
- Lower timeframes (15m, 5m) = more noise, less reliable unless you're day trading or scalping
Pick levels based on your strategy:
- Swing traders = use daily/weekly/monthly
- Scalpers = lower timeframes with extra confluence (volume, structure)
5️⃣ Don’t Use Support/Resistance Alone
Support and resistance are helpful — but not enough by themselves. Always combine them with:
- Market structure (higher highs/lows)
- Volume confirmation
- Indicators or price action signals
You want to watch how price reacts at your levels. Wait for confirmation before making decisions.
6️⃣ Common Mistakes Traders Make
Mistake 1: Drawing too many levels clutters your chart and creates confusion.
Mistake 2: Keeping old levels that have already been broken or invalidated.
Mistake 3: Ignoring volume. Just because price hits a level doesn’t mean it will reverse. You need volume to back the move.
Also:
Don’t enter blindly on breakout, breakouts can fail. Wait for confirmation.
Don’t assume a level is strong just because it’s touched once — look for multiple rejections.
7️⃣ Example: How I Draw Support/Resistance
Let’s say I’m looking at a daily chart.
- I find a red candle that closes at 42,000
- Then a green candle opens at 42,000 and pushes higher
That tells me buyers stepped in at 42,000 — this is a potential support.
I draw my horizontal line across that level.
Then I zoom into 30m or 15m charts to watch price behavior when it comes back to that level.
If price respects it again, I may enter a trade based on the reaction.
This technique gives me more confidence and clarity.
I know where liquidity might be waiting.
I can combine it with indicators or volume tools.
I avoid random trades.
🔄 Summary
Identify a timeframe – Use the monthly, weekly, or daily chart.
Look for two candles – Draw your support or resistance line at the point where one candle closes and the next one opens.
Make sure the level hasn’t been hit yet – This helps you spot areas where liquidity grabs might happen.
Wait for price to reach the level – Once price touches the support or resistance zone, watch how it reacts.
After price touches the level, remove it – Once tested, that level is no longer fresh and should be cleared from your chart.
Support and resistance isn’t magic — but used with confluence, it becomes a powerful guide.
Please LIKE 👍, FOLLOW ✅, SHARE 🙌 and COMMENT ✍ if you enjoy this idea! Also share your ideas and charts in the comments section below! This is best way to keep it relevant, support us, keep the content here free and allow the idea to reach as many people as possible.
Disclaimer: This is not financial advice. Always do your own research. This content may include enhancements made using AI.

Bitcoin’s Dominance (BTC.D)I spotter 2 order blocks which seem to have been rejected from the lower. Fibonacci retracement tool didn't align perfectly with the retracement, I however used it for my July target
UNI. Movement.You can call it sideways movement or a movement in a global ascending channel - imo, both options will be valid for BME:UNI you can expect 60% up move - to the middle of the channel

GOLD SqueezeLooking at the 4-hour timeframe. Price is failing to make LL or HH, with pressure getting tighter and tighter. Personally, I'm not really interested in trading a market like this till price breaks out.

AUDUSD Bearish Signal | Technical + Custom Algo Smart Trend Signal | Technical Analysis + Custom Algorithm
This signal is the result of a combination of classic technical trend analysis and a proprietary software I personally developed.
The system first identifies market trends purely based on technical indicators — no emotions, no subjective analysis.
Then, a custom-built intelligent algorithm evaluates potential entry and exit points and issues the signal.
This means: a fully data-driven signal, with no guesswork or bias.
📌 Note: This signal is for educational and analytical purposes only. Trading is at your own risk.

Nifty Analysis EOD – May 28, 2025 – Wednesday🟢 Nifty Analysis EOD – May 28, 2025 – Wednesday 🔴
Consolidation at the bottom—ready to blast? Or more of the same tomorrow?
📊 Nifty Summary:
Nifty opened mildly higher at 24,832.50, only to spend the entire session grinding within a narrow 127-point range. Most of the action stayed trapped in a 60-point box, giving day traders a frustratingly sideways experience. Attempts to break the range failed, and the index closed at the day's lower edge, continuing the consolidation near key support zones.
🔍 Intraday Walk:
Nifty opened with a small positive bias but failed to find follow-through.
For the major part of the day, price action remained boxed in a tight range—ideal only for scalpers and option writers.
An attempted breakout was seen, but the index quickly fell back into the consolidation zone.
Triangle breakout on 5-min chart came late (3:00 PM), with no time for validation.
Closed near day’s low at 24,752.45, just above crucial support.
🛡 5 Min Chart with Patterns
🛡 5 Min Chart with Patterns and Levels
🔎 Chart Observations:
🔸 Mini M-Pattern formed twice on 5-min chart at key level—adds to bearish caution.
🔸 Box consolidation zone repeated from yesterday’s range.
🔸 Symmetrical Triangle seen on 5-min chart broke on the downside at 15:00—too late to act but worth noting.
🔸 Yesterday’s low stayed protected, though price closed weak.
🔸 Volatility dried up ahead of monthly expiry—expect positioning tomorrow.
🕯 Daily Time Frame Chart
📉 Daily Candle Breakdown:
Open: 24,832.50
High: 24,864.25
Low: 24,737.05
Close: 24,752.45
Change: −73.75 (−0.30%)
Candle Structure:
Real Body: 80.05 pts (Red candle)
Upper Wick: 31.75 pts
Lower Wick: 15.40 pts
Interpretation:
Small-bodied candle with short wicks on both ends—a Bearish Spinning Top, hinting at indecision but with a slight bearish bias.
Inside Bar formation – breakout watch on either side.
🧠 Key Insight:
The market is digesting the recent downside with sideways consolidation. If bulls fail to protect 24,700, deeper cuts could follow. On the flip side, a break above 24,882 could trigger short-covering ahead of expiry.
🛡 5 Min Intraday Chart
⚔️ Gladiator Strategy Update:
ATR: 299.84
IB Range: 121.2 → Medium
Market Structure: Balanced
Total Trades: 0
❌ No valid triggers today – system stayed out due to tight range and lack of momentum.
📌 Support & Resistance Levels:
🔺 Resistance Zones:
24,768 ~ 24,820
24,882
24,894
24,920
24,972 ~ 25,000
25,062 ~ 25,070 (Rejected for 5th time!)
25,116 ~ 25,128
25,180 ~ 25,212
25,285 ~ 25,399
🔻 Support Zones:
24,737 ~ 24,727
24,700
24,660
24,640 ~ 24,625
24,590
24,530 ~ 24,480
24,460
🔮 What’s Next?
Scenario 1 – Breakdown:If 24,700 breaks and sustains, Nifty may head towards 24,589 → 24,500 → 24,461.
Scenario 2 – Breakout:If 24,882 breaks and sustains, Nifty can test 24,920 → 24,972 → 25,000 → 25,065 → 25,116 → 25,180.
📍 Most probable scenario:Expecting a range-bound day between 24,660 and 24,882, typical of Monthly expiry sessions. However, if short covering triggers, the day could flip into a trend day.
⛔ Caution: Tomorrow is a tricky expiry day—stay nimble, follow strategy, and respect levels!
🧘 Final Thoughts:
"The calm before the storm often wears the mask of boredom. When the market sleeps, prepare for the wake-up call."
✏️ Disclaimer:This is just my personal viewpoint. Always consult your financial advisor before taking any action.

Key data will be released, gold will usher in a turning point🗞News side:
1. Musk issued the "strongest" condemnation of Trump
2. Trump and Netanyahu failed to reach an agreement, and the US-Iran negotiations may be "disrupted" by Israel
📈Technical aspects:
Gold prices continued to fall this week as Trump extended the impact of increasing tariffs on the European Union. After stabilizing at 3285 and rebounding yesterday, the gains and losses at 3315 during the day are the key to the subsequent layout. The current Asian session did not stand above 3315 in the morning, which means that the short-term retracement and decline have not ended, and only by breaking through 3315 can there be a chance to continue upward. The 4H level of gold is not so strong at present. The market encountered resistance and fell back at the upper track. Now the market has touched the lower track. The Bollinger Bands have not opened and are still flat, indicating that the market is in a volatile trend in the short term. The support below 3280 just coincides with the lower track. The upper side pays attention to the resistance near the middle track of 3325. If the pressure near the middle track of 3325 is broken, it can be seen to the upper track of 3365. If the market breaks below 3280, it is expected to go to 3260-3250. The European session will temporarily maintain a high-altitude low-multiple cycle. Pay attention to 3315-3325 on the upper side and 3285-3280 on the lower side.
If you agree with this view, or have a better idea, please leave a message in the comment area. I look forward to hearing different voices.
OANDA:XAUUSD FX:XAUUSD TVC:GOLD FXOPEN:XAUUSD FOREXCOM:XAUUSD

EURJPY: Important Breakout 🇪🇺🇯🇵
EURJPY broke a significant resistance cluster on a daily.
We see its retest now.
I think that the price will start rising from that and reach
at least 164.5 level.
❤️Please, support my work with like, thank you!❤️
I am part of Trade Nation's Influencer program and receive a monthly fee for using their TradingView charts in my analysis.

Actionable Nasdaq insights: 28-May-2025Rise and shine, traders! Start your day with actionable Nasdaq insights. Let's grow your skills together, one chart at a time.

Gold trading insights: 28-May-2025Gold trading insights for today: Explore our zones for informed decision-making.
