Downtrend Due to Losing Price Momentum!The price candlestick pattern indicates a downtrend with lower trading volume and negative readings in RSI and MACD signals.
The S1 line will be a support price if the price is able to recover from the downtrend and pull back from the decline pattern.
R 0.945, 1.22
S 0.805, 0.685
Candlestickpattern

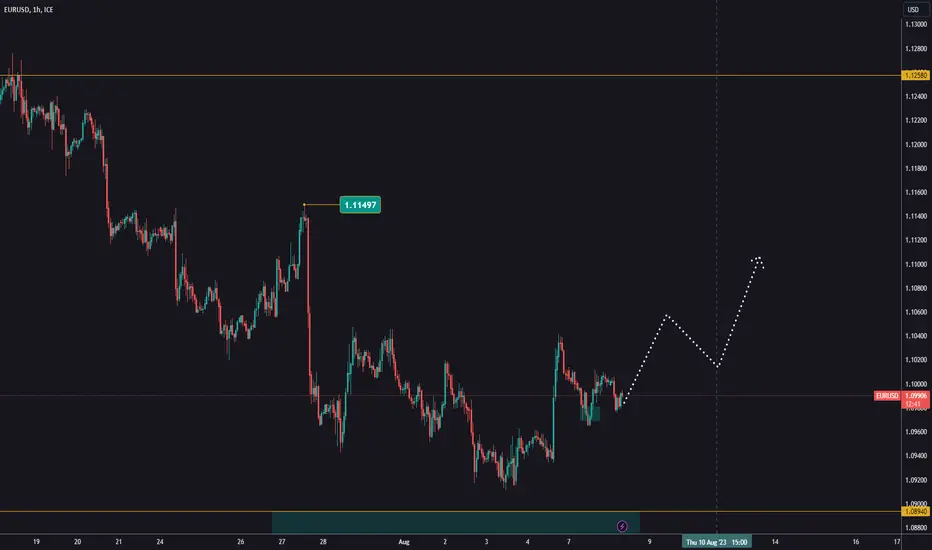
EURUSD riseYesterday we saw a pullback from the support zone on small time frames.
It’s important the movement to continue and manages to break the previous peak.
This will confirm the beginning of the upside move and will give a chance for another buys.
The important news this week is on Thursday , and there may not be any big moves before that.
Euro-Dollar vs Pound-Dollar: Why Choose🌐 If I had to choose between Euro-Dollar and Pound-Dollar, I'd trade both! However, let's focus on Pound-Dollar for now. On the weekly chart, it's still on a bullish continuation that started earlier than Euro-Dollar.
💹 Lower Timeframes: On lower timeframes, we have a buy zone and a counter-trend trading opportunity. This gives us various entry points for trading.
📊 Weekly Chart: The buy zone ranges from 1.2593 upwards. Daily Chart: A bullish gartley pattern has already formed, offering an immediate buying opportunity for aggressive traders once the market opens. Remember to set stop-loss, targets, and be aware of warning signs.
📈 Four Hour Chart: Another Gartley pattern suggests waiting for a retest at 1.2669 for a second chance entry opportunity. One Hour Chart: A head and shoulder formation indicates a possible pullback before engaging in a bullish shark pattern at 1.2697.
🎯 When trading, keep an eye on the 1.2700 level. A strong bullish run might occur, or if it breaks below 1.2700, a bearish movement could ensue due to stops placed beneath the buy zone.
💼 If you're intrigued by this type of analysis, have fixed rules, and know which direction to focus on...

EURUSD before NFPUS new Jobs data is released every first Friday of the month.
The news impact all pairs with USD.
We also expect reaction in EURUSD.
The preferred entry option is to reach the support zone and pullback.
It will give a chance for buy with target, test of 1,1258 level.

Bearish Shark Pattern with RSI Divergence🦈📉 Bearish Shark Pattern with RSI Divergence 📉🦈
Finally, the trade I've been patiently waiting for on EURJPY is here! 🚀 This one calls for a shorting opportunity, treating it as a pullback trade, a retracement trade.
Now, it's time to keep a close eye on how the market reacts when it reaches our first target at 154.25. 🎯 If the market respects this level and chooses to rebound upwards, we have our answer. But if it bashes through the blue box, then we know there's a higher chance of hitting our second target.
Make sure to follow my only account @raynlim for more updates and insights on the financial markets. Let's trade smart and seize the profit opportunity together! 💪💰

Time to Plan Your Currency Exchange!If you're planning a trip to Australia in the next few months, consider changing some Aussie dollars now. For counter-trend traders, it's a great opportunity to look for a buying opportunity in the AUD. Let's analyze the charts!
📊 The market hit resistance and is now in consolidation, making it a concern for buyers. The daily chart shows an M Formation, with the 0.6600 level as a critical watch. It's likely to be violated before any potential reversal. On the four-hour chart, wait for a buying opportunity with magic candle confirmation.
⏰ On the four-hour chart, a bullish bat pattern has already completed, signaling a potential shorting opportunity. Set alerts and observe the Monday market opening for further confirmation.
📈 The setup is clear and objective, leaving no room for subjectivity. Engage your trade with defined stops and targets in mind.
💡 Trade smarter and save time! Spend just 15 mins a day on market analysis, setting alerts, and enjoying life. DM me to learn how.
💹 Follow my only account @raynlim for insightful analysis and updates. Let's trade with confidence! 📈🇦🇺

📈 Master the Bullish Trend: Earn Income with Effective Trading 📈 The Euro dollar has shifted from a bearish to a bullish trend. On the weekly chart, we can see a violation of the previous resistance, indicating the overall trend is now bullish. However, this doesn't mean you can't consider shorting opportunities, just be more conservative with your targets.
🔍 Moving to the daily chart, the bullish trend is evident, and the RSI near the bottom signals a potential buying opportunity soon as the market is oversold. On the 4-hour chart, those trained in reading patterns might spot some opportunities right away.
💡 Pause the recording and share your findings, entry price, and trading strategy in the comments to learn and grow together. If you're not confident in spotting trends, join our community through the QR code to interact with like-minded individuals and learn how to trade.
💼 My analysis: On the weekly chart, while we're in a bullish trend, the resistance level at 1.1232 suggests both buying and selling opportunities. For a shorting opportunity, I'll wait for a counter trend or confirmation pattern at that level.
📅 On the daily chart, you can look for simple candlestick confirmation to buy at the current level (1.0974). On the 4-hour chart, a secure buying opportunity awaits with candlestick confirmation on the D price completion of the bullish bat pattern. The first target will be conservative, and I'll shift my stops to entry for a risk-free trade.
⏱️ If you'd like to spend just 15 minutes a day and generate additional income, DM me for more information. Let's make trading work for you! 💰🚀 #TradingStrategy #BullishTrend #ShortingOpportunity #JoinOurCommunity #DMMeForInfo
Follow me on my only account @raynlim for more trading insights and updates! 📊📈

EURUSD after FEDYesterday, the FED raised rates again by 0.25%.
The ECB is due to announce today whether it will do the same by 0.25%
Today's news is at 15:15 Bulgarian time, and the press conference 30 minutes later.
EURUSD looks like it has already bottomed out and is starting the next uptrend.
We are watching for a higher bottom and confirmation of the upward movement.

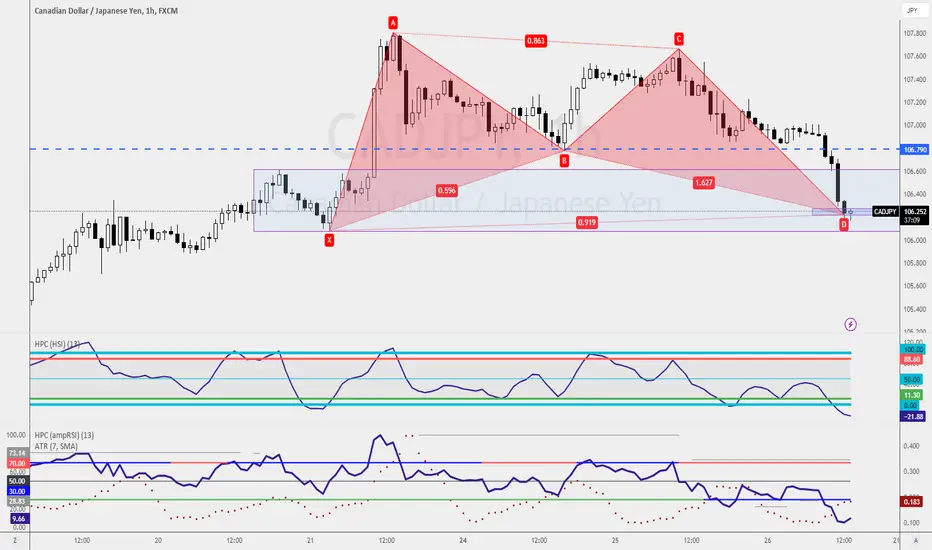
Bullish Bat Pattern within Buy Zone📈 CADJPY Bullish Bat Pattern 📈
Exciting opportunity on CADJPY! 🦅 A Bullish Bat Pattern is forming within the buy zone. 📊 Conservative traders target 106.79, while adventurous traders set their own targets. Remember to manage risk and stay informed. Follow @raynlim for more trading insights. Happy trading! 🚀
EURCAD SHORT/SELL
🔰 Pair Name : EUR/CAD
🔰 Time Frame : 4H
🔰 Scale Type : MID Scale
🔰 Direction : SHORT/SELL
📈 EURCAD Technical Analysis Update 📉
Greetings, fellow traders! 🤝 Today, we delve into the technical aspects of EURCAD on the TradingView chart.
Over the past year, EURCAD has been maintaining a monthly uptrend since July 2022. However, starting from April 2023, the pair reached its 5th wave high and has since been exhibiting signs of a shift towards the downside.
Notably, during the period between mid-June and mid-July, EURCAD successfully retested the 23.6% Fibonacci level following a robust daily breakout, creating a notable market imbalance below.
At the onset of this week, the price demonstrated fresh key highs and formed two compelling daily bearish pin bars after filling approximately 50% of the market imbalance above.
In our professional assessment, it is highly likely that the price will embark on a downward journey to retest the market imbalance left below, aiming to reach the 1.442 level. This move could potentially lead to a decisive breakout of the current uptrend channel.
Our vision for EURCAD entails a minimum target of 1.442, followed by 1.43242, as it progresses through the selling liquidity collection phase.
Keep a vigilant watch on the evolving price action, and may the markets favor your trading endeavors! 🌟 #EURCAD #TechnicalAnalysis #ForexTradingView

🐻📉 S&P Bearish Gartley: A sharp Retracement Ahead! 📉📉Hey traders! 🐻📉 Are you ready for a retracement on the S&P in the 1-hour timeframe? Let's dive into this bearish setup! 📉📉
📈 Bearish Gartley: The price action on the S&P has formed a bearish Gartley pattern, with the price topping twice on point D. This reliable harmonic pattern signals trend reversal with a highly reliable consistency.
🕯️ Bearish Engulfing: Adding to the bearish case, the price has now formed a bearish engulfing candlestick, indicating a possible shift in momentum from bullish to bearish.
📉 Retracement Potential: Considering these technical factors, I'm closely watching for a sharp retracement to the 4500 area. and even lower if the bearish momentum remain. The market sentiment seems to be aligning with a bearish outlook.
💡 Moving Average Crossover: To further strengthen the bearish setup, the imminent crossover of the 9 and 21 moving averages is providing a solid confirmation of the potential retracement.
Feel free to share your toughts in the comments section, follow me for updates and don't forget to press the like button if this insight was helpful🚀

EURUSD is heading towards key supportYesterday we saw a drop below 1,1100.
The next important support is around 1,1000.
These are levels we will be looking for buys from, upon pullback.
We’re out of trades on EURUSD for now awaiting tomorrow’s news and grounds for entry.

Shorting Opportunity Alert on EUR/USD!🐻 Weekly Chart: The overall setup on EUR/USD points to a Weaker Bear trend. 📉 This means there's potential for downward movement in the coming weeks.
⏳ Patience is Key: While we wait for the perfect entry point, keep a close eye on the lower timeframes for a shorting opportunity. 🧐
📈 Lower Timeframes: Look for price action signals and confirmation on the lower timeframes to pinpoint the ideal entry point for your short trade. 🎯
📉 Set Your Stop-Loss: Always remember to set a proper stop-loss to manage risk effectively. 🛡️
🚨 Stay Alert: Monitor the market closely and be ready to act when the right setup presents itself. 📊
Remember, trading requires discipline and patience. Wait for the right opportunity, and when it arises, execute your trade with confidence. 💪
Happy trading and best of luck! 🍀 Follow me @raynlim for more trading insights and updates. Let's capitalize on the market together! 🚀

🐻📉 AUDUSD Alert! Bearish Bat Pattern Signals Sharp Correction 🚨 Attention traders! We have an exciting bearish setup on AUDUSD that you don't want to miss. Our previous bullish setup on AUDUSD was a resounding success, allowing us to secure profitable gains. Now, it's time to switch gears and capitalize on a new opportunity as the tide turns bearish. 📉🦅 The formation of a bearish bat pattern, coupled with two strong confirmations, suggests a sharp correction is on the horizon.
The bearish bat pattern has emerged, indicating a trend reversal. This harmonic pattern is known for its high success rate and presents an excellent opportunity to capitalize on the downward movement.
confirmation n°1 : Adding to the bearish thesis, the last candlestick has formed a rejection pattern precisely at the resistance level, highlighting significant selling pressure in this area. This optimal entry point allows us to ride the anticipated sharp correction.
confirmation n°2 : Furthermore, the RSI indicator is currently in the overbought zone, signaling a potential shift in momentum. This further supports the bearish setup and increases the probability of a downward move.
To take advantage of this setup, I recommend entering a short position around 0.68775. Our first take profit level is set at 0.67900, which coincides with a liquidity pool where potential support could be found. Our target stands at 0.67000, representing a significant downside potential.
Keep in mind the importance of proper money management. It is essential to respect your risk tolerance and avoid risking more than 2% of your account on any given trade. Stay disciplined and protect your capital. 💰💪
Feel free to share your toughts in the comments section, follow me for updates and don't forget to press the like button if this insight was helpful 🚀

EURUSD continues its correction Yesterday EURUSD reached the support zone but didn’t give a chance for buys.
USD interest rates is coming next Wednesday.
We often see sideways movements before important news.
We’re not looking for new trades at the moment and we’re waiting for the correction to continue.

Support zone on EURUSD Yesterday EURUSD headed towards the first support and pulled back.
No entry grounds on these levels.
Another drop today and pulling back from the support zone will allow buys.
The target is breakout of 1,1274 and the SL should be below pullback level.
An important news due next week which will cause big fluctuations.

Correction on EURUSD Yesterday EURUSD reached exactly the resistance level 1,1274 and pulled back.
We determined the support levels which we will watch for possible buys.
The goal is reaching support level and pulling back.
This will allow a good ratio entry and opportunities to quickly move the stop on a rise.
The support levels we are watching are 1.1170 and 1.1106.
For buys, the target will be a breakout of the top of 1.1274!

Aggressive Approach on USDCAD!Get ready for some action! The USDCAD trade is heating up, and here's why you should be excited! 💪
On the Weekly Chart, a key support level has been broken, signaling a potential trend reversal. 📉🚫 This opens up an aggressive shorting opportunity for traders who thrive on bold moves! 📉💥
The Bearish Shark Pattern has formed at 1.3587, and all signs point to a potential bearish trend continuation. 🦇📉 But remember, aggressive trading requires careful risk management! 🛡️💼
Should the market retraces to 1.3175 before the Bearish Shark, I will long USDCAD with the help of Bullish Shark Pattern and I might be using a trade management known as the Upsize Trade.
Stay tuned as we dive deeper into this aggressive approach, and remember, trading is all about seizing opportunities! 📈✨

Tricky Times, I'm Counter-Trend Now!💲 Despite my Dollar Bias, all eyes are on US Secretary Treasure, Ms. Janet Yellen's upcoming speech in Bloomberg. Analyzing her insights could confirm the dollar's bullishness for the year ahead.
📈 On the Daily Chart (right), there's an outside bar on the support line. Patient traders await one more day's candlestick before deciding their next move.
📉 If you're determined to short USDJPY, keep an eye on the 1-hourly chart (left) at 138.89, as long as the market stays within the sell zone. It's worth considering.
📈 On the other hand, if you're bullish, pay attention to the key level at 138.21 for a potential head and shoulders pattern, indicating a buying opportunity.
⚖️ If you're torn between shorting and buying, observe how the market behaves at 138.21. A violation confirms your short, while no violation means a tough decision awaits.

Trading plan for 17th July 2023Nifty future and banknifty future analysis and intraday plan in kannada.
This video is for information/education purpose only. you are 100% responsible for any actions you take by reading/viewing this post.
please consult your financial advisor before taking any action.
----Vinaykumar hiremath, CMT

Rise in EURUSDThe EURUSD rally continues and we are now above 1.1200.
The next resistance level is at 1.1274.
All active buys should have stops moved and a close option considered.
There is no basis for new entries at these levels!
At the end of the week, there may be some profit taking which will lead to a correction.

Candlestick pattern: Shooting starShooting Star is a bearish candlestick reversal pattern. It signifies the end of an uptrend and the potential start of a downtrend. Its opposite is the Morning Star.
When analyzing this pattern, we should observe if the confirming candle closes within the lower third of the range formed. This condition acts as a filter when deciding whether to initiate a trade or not.
This filter makes sense because a stronger confirming candle indicates greater rejection of the uptrend continuation, thus increasing the likelihood of the pattern's success and the formation of a new downtrend.
On the other hand, if the confirming candle does not close below two-thirds of the range formed, it could indicate weakness in the direction of the trend and decrease the probability of the start of a new downtrend.

Chart pattern: Head and Shoulders (H&S)The Head and Shoulders, from now on referred to as H&S, is a chart pattern used in technical analysis of stock markets. It is a pattern that indicates a reversal, signaling the end of a trend and the beginning of a new trend in the opposite direction.
It is one of the most important and widely used patterns due to its high reliability and the number of required implications. However, this does not mean it is infallible, as its success rate is around 70%.
Regarding its potential projection, if the price breaks below the support line after the formation of the Right Shoulder (RS), the range between the maximum price of the Head (H) and the support line is measured. This distance is then applied to the breakout point, as shown in the image, to obtain the minimum pattern projection.
