MSFT - Falling Trend [MIDTERM]- MSFT has broken the ceiling of the falling trend in the medium long term, which indicates a slower initial falling rate.
- MSFT has broken up through resistance at 257.
- This predicts a further rise.
- Positive volume balance indicates that buyers are aggressive while sellers are passive, and strengthens the stock.
- MSFT is overall assessed as technically positive for the medium long term.
*EP: Enter Price, SL: Support, TP: Take Profit, CL: Cut loss, TF: Time Frame, RST: Resistance, LT TP: Long term target price
Candlestickpattern

An Immediate shorting opportunityA Bearish Bat Pattern on a counter-trend trading setup allows traders to hop in and catch some relief from the market.
This could be an amazing trade for trade management matters.

Let's Know some "Never say Die" kind of Stocks! NCC is one them?There are some quality stocks which are having a "Pushpa" attitude! "Zukega Nahi S_L_ !"
NCC has been in uptrend in D & W TF! 15 Min TF also shows good support even in falling time! Looks attractive for positional set up.

USD CHF - Long Trade Setup Support & Resistance LevelOANDA:USDCHF Long Trade Setup Support & Resistance Level. Retest the Level that is good sign gain more strength toward break the next resistance.

UNI USD Bullish Trend Based on S & R LevelBINANCE:UNIUSDT UNI USDT Bullish Trend Entries Based on Support and Resistance Level. if Market Move upward then Buy Stop Execute. if Market move down side our Sell Stop Order is Execute


EURUSD after CPIEURUSD after ICP
The news has passed but there were no good entry opportunities.
No new trades at the current levels as well.
Pullback from the support level at 1,0600 is needed in order to get into buys.
No grounds for sell trades too, at the moment!
That’s why it’s better to wait for the development and to look at another instruments meanwhile.
Tomorrow the interest rates from the ECB will be published, which will also have an impact.


USD JPY Bullish Trend Start. Bullish Candle Shows in ChartsOANDA:USDJPY USD JPY Bullish Trend Start. Bullish Candle Shows in Charts After confirmation and creating support of 133.766 Level.

What is Candlestick Pattern?Candlestick patterns are a charting technique used by traders to analyze the price movement of financial instruments. They originated in Japan in the 18th century and were used to track the price of rice. The technique was later adapted for trading other assets like stocks, currencies, commodities, and cryptocurrency.
Candlestick patterns are an important tool used by traders and investors to analyze the price movement of financial assets. A candlestick is a visual representation of the price movement of an asset during a specific time period. Each candlestick represents the opening, closing, high, and low prices of the asset during the period. The shape and color of the candlestick provide important information about the price movement of the asset.
Candlestick patterns are formed by the combination of one or more candlesticks, and they can indicate a potential trend reversal, continuation, or indecision in the market. Some candlestick patterns are based on just one candlestick, while others are based on combinations of two or more candlesticks.
A bearish candle (red candle) represents a period of trading where the closing price is lower than the opening price. This indicates that sellers were able to push the price down, indicating a negative sentiment in the market. The bearish candle has a long body and a small lower wick, indicating that sellers were in control for most of the trading period.
A bullish candle (green candle) represents a period of trading where the closing price is higher than the opening price. This indicates that buyers were able to push the price up, indicating a positive sentiment in the market. The bullish candle has a long body and a small upper wick, indicating that buyers were in control for most of the trading period.
Both bullish and bearish candles can come in various sizes and shapes, indicating different levels of buying or selling pressure. For example, a long bullish candle with no or a very small upper shadow could indicate strong buying pressure, while a short bullish candle with a long upper wick could indicate weaker buying pressure.
Different types of candlesticks Pattern:
1. Bullish Candlestick Pattern
- Hammer
- Inverse Hammer
- Bullish Harami
- Bullish Engulfing
- Morning Star
- Three white soldiers
2. Bearish Candlestick Pattern
- Shooting star
- Hanging man
- Bearish Harami
- Bearish Engulfing
- Evening star
- Three black crows
Doji: Gravestone Doji
Dragonfly Doji
Long-legged Doji ( Spinning top )
In the upcoming post, we will elaborate on the various types of candlesticks and how to use them.
Thanks
Hexa

No trades on EURUSD EURUSD passed above previous tops around 1,0700 and it’s likely to continue.
There are no current entry opportunities after the hike.
It’s better to wait for correction or reversal with good ratio.
An important news for USD is due tomorrow.
An important resistance level will be 1,0840, while the support is at 1,0640.

EURUSD before NFPEURUSD is at important resistance level before today’s US job data.
They are an important indicator of the development of the economy and are monitored by the FED when deciding on interest rates.
We will watch for a pullback from the resistance zone and a selling opportunity.
We will look for an entry after the news when pullback from the zone.
In the case of an impulse rise, no trades is entered into!

JBM Auto - Good setup even in falling market conditionLooks good to as stock is holding strength even in falling market

EUr AUD is Bullish trend Starts 1 HR TFOANDA:EURAUD Bullish trends Starts in 1 HR TF. Hammer show good Strength push price upward. Break the previous level.

Sushi Usdt Bullish Trend I Hr TF Break Higher LowBINANCE:SUSHIUSDT Sushi Usdt Bullish Trend I Hr TF Break Higher Low or also break the Trend Line.

This candle closed will determined everythingThis candle closing price would determine whether I will aggressively engage in this trade.
I need to see a long shadow candlestick pattern formation by our school definition.
Do not that if I decided to engage the trade in the next 3minutes, it means that this trade would be an overnight risk trade.

GBPUSD | LongGBPUSD | Long
Long Entry @ 1.20388
StopLoss @ 1.19177
TP1 @ 1.21198
TP2 @ 1.22469
TP3 @ 1.23942

USDCAD SHORT PROJECTIONUSDCAD broke a strong support turned into resistance as well as a daily trendline which were both retested during a pullback and just closed off with a bearish engulfing candle validating our sell positions.

Correction continues Yesterday we saw a hold on the EURUSD and there is no basis for new trades at the moment.
For selling, we will look for a correction to 1.0600 and a pushback.
Jobs data is due tomorrow and could trigger a move to provide an entry opportunity.
We are currently not trading EURUSD and are awaiting developments.
We are looking at current opportunities in the GBP crosses!

Sales after EURUSD correction Powell's press conference yesterday had an impact and we saw a sharp drop to 1.0530.
This eliminates all buying options and we look at selling options.
We will look for an entry after a correction to 1.0600 and a pullback from these levels.
The idea is break by going over the previous peak!
The goal is to breakout of the bottoms and reach 1.0440.

Rebound From Support Range!The candlestick pattern indicates the price has rebound from the price support range. Where the price gains momentum towards the R1. Although there was a significant price movement the result in volume is lower than the average volume. Hence, indicate an accumulated phase pattern but suggests that the long-term uptrend remains intact.
The MACD is in a divergence signal, thus, conforming with the candlestick trendline.
Let's save CNERGEN in WL and watch out for significant price movement with the volume above the average volume.
R 0.965
S 0.865

EUR USD Bullish Trend in 1 HR TF OANDA:EURUSD In the 1 Hr TF, we see the Bullish Trend starting. The Hammer and Bullish engulfing candle shows on charts that is good sign for go Upside movement. Or break the previous H.H more confirmation to the Upside.
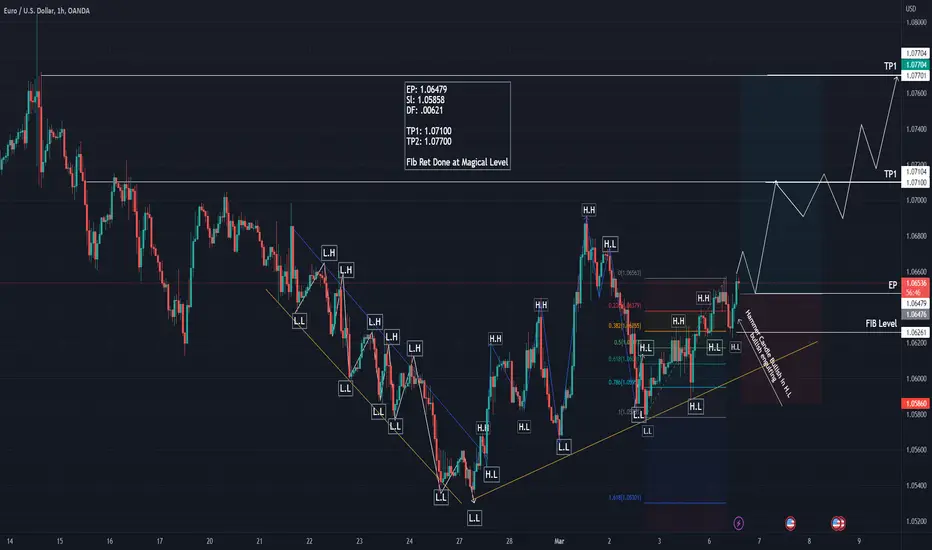
GBP USD BULLISH TREND IN 1 HR TF OANDA:GBPUSD In the 1 Hr TF, we see the Bullish Trend starting. The Hammer candle shows on charts that is good sign for go Upside movement. Fib Ret Level also Done at Magical Number.
