AUDJPY - LONG idea after reach supply zoneAfter a bullish rally for the AUD there was a correction which wasn't reach 0.5 FIBO. Now the price is moving to down side which is positive for JPY. It is good idea to look for double bottom combined with candlestick pattern ot diviregence on some of oscillators and the entry could be a good for long position. Very important is that we expect new for the AUD which could have significant effect.
Candlestickpattern

EURNZD wating for Eurozone dataAfter forming of the desceding channel the price reached to supply zone combine with resistance line. The resistance line is not so hard because the prices have touched it only 2 time and now is the 3rd. Everything depends on the data which eurozone will share. If they are positive for the EUR then may be after a retest, an idea for long position will be great. If the news are bad for EUR then a short position will be good.

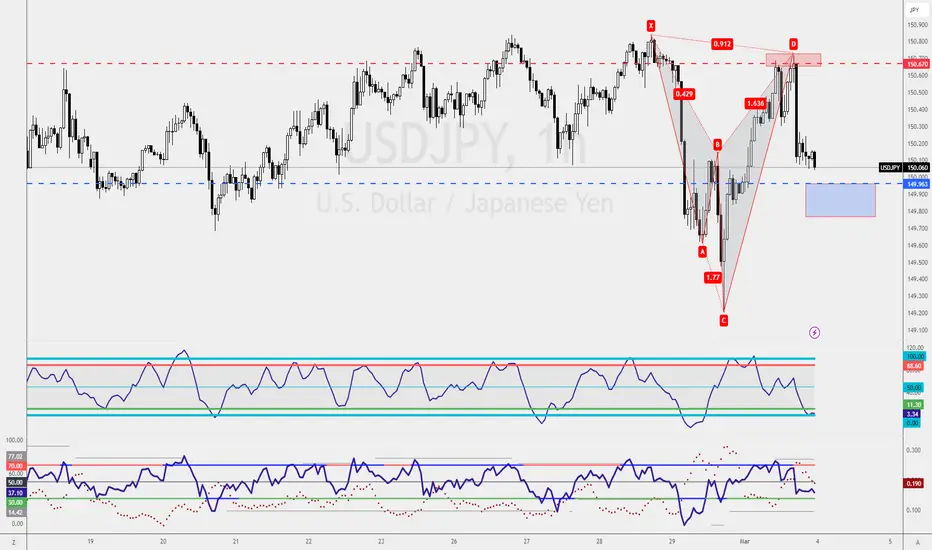
Bullish 5-0 vs. Type2 Bearish Shark PatternIf you're navigating conflicting biases, here are two potential setups:
1. Bullish 5-0 Pattern at 149.96: Long Opportunity
- Engage in a long position based on the completion of the Bullish 5-0 pattern at 149.96.
- This pattern signals a bullish bias, providing an opportunity for traders expecting an upward move.
2. Type2 Bearish Shark Pattern at 150.67: Shorting Opportunity
- Consider a short position if the Type2 Bearish Shark Pattern completes at 150.67.
- This approach factors in the possibility of Fed rate cuts in June, potentially influencing a bearish move.
As a trader, it's essential to weigh the conflicting signals and align your strategy with your overarching market outlook. Feel free to share your preferences and insights on these setups.
Science of Trading ApproachToday, I'm excited to share a detailed approach for trading GBPUSD. If you're considering a short position, here's a comprehensive strategy:
1. 1-Hourly Chart: Shark Patterns at 1.2676
- Wait for Shark Patterns to complete at 1.2676 on the 1-hourly chart.
- Look for a trading combo within the chart when the market retests the Trendline Break (red line).
- Ensure the market doesn't violate the trendline during this process.
2. 4-Hourly Chart: Bearish Gartley Pattern at 1.2725
- The ideal scenario is for the Bearish Gartley Pattern to complete at 1.2725 on the 4-hourly chart.
- Aim for completion before Monday, March 4, 2024, by 5 pm. Patterns completing after this time are considered disqualified.
This Science of Trading approach allows for a meticulous analysis and synchronization of different patterns across multiple timeframes. It provides a well-defined strategy for traders looking to short GBPUSD.
Feel free to share your thoughts and insights. Are you considering a similar approach or have different plans for GBPUSD?
For a visual representation, please refer to the chart link in the TradingView post.

Most powerfull candlestick pattern Pulse Pin Scalping Strategy Greetings, traders! 📈 Excited to share with you my latest discovery - the Pulse Pin Pattern! 🕯️✨ This three-candlestick formation is a powerful tool for identifying potential trend reversals or continuation. Let's dive into the details for both bullish and bearish scenarios.
Bullish Pulse Pin Pattern:
In the bullish case, keep an eye out for the following conditions:
Candle 2 Breaks Below Candle 1: Ensure that the second candle breaks and closes below the first candle.
Candle 3 Breaks High of Candle 1: The third candle must break the high of the first candle and close with its body above it.
When these conditions are met, it signals a potential bullish setup. Seize the opportunity by opening a buy trade and setting your stop-loss below the low of candle 2. Aim for a target that is twice the risk for a rewarding risk-reward ratio.
Bearish Pulse Pin Pattern:
Conversely, for the bearish case, watch for the following criteria:
Candle 2 Breaks Above Candle 1: Confirm that the second candle breaks and closes above the first candle.
Candle 3 Breaks Low of Candle 1: The third candle should break the low of the first candle and close with its body below it.
Once these conditions align, it indicates a potential bearish Setup. Capitalize on this by initiating a sell trade and setting your stop-loss above the high of candle 2. Target a gain that is twice the risk for a favorable risk-reward ratio.
Remember, always conduct thorough analysis and risk management before executing any trades. Happy trading! 💹🚀 #PulsePinPattern #TechnicalAnalysis #TradingView #TradeSmart #AHTConcepts

Eur/Usd Top Down Analysis Feb 24'Eur/Usd! The reaction off 1.08927 was quite dramatic last thursday and friday.
Intro/Monthly TF 0:0
Weekly Timeframe 4:05
Daily timeframe 6:29
4hr timeframe 9:29
1Hr timeframe 11:33
Price has retraced and since dipped into a 4hr zone 1.08011. It bounced here on friday and the price action consolidated after that. It is possible that we may observe more sideways movement before another continuation. I liken a continuation for buyers because of sentiment moving out of last week due to cad news. It is quite normal to see a reaction off a daily zone like we observed on thursday and friday and it could very well be just a pullback in an uptrend. Caution however!
Not Financial Advice.
Education Purposes Only.

GBPAUD Sideway Bounce Trading SetupI'm excited to share a trading setup on GBPAUD utilising the Sideway Bounce strategy. Here are the details:
- Setup: Sideway Bounce Trading
- Short Entry: 1.9324
- Long Entry: 1.9230
The Sideway Bounce strategy is a technique I've tested and traded since 2005, and I find it a comfortable and reliable approach.
In this scenario, I'm considering a short position at 1.9324 or a long position at 1.9230, aiming to capitalise on potential movements within this range.
This setup offers approximately 100 pips of profit potential, making it an intriguing opportunity to watch closely.
Feel free to share your thoughts and trade plans for GBPAUD. Are you inclined to go short or long?

Bullish Shark PatternI'm closely monitoring GBPJPY for a potential buying opportunity based on the Bullish Shark Pattern. Here are the details:
- Setup: Bullish Shark Pattern
- Completion Level: 189.06
Given the recent decline in the JPY and the resulting upward movement in JPY pairs, I'm anticipating a bullish scenario on GBPJPY.
The completion of the Bullish Shark Pattern at 189.06 is the level I'm eyeing for a buying opportunity.
Feel free to share your insights and trading plans for GBPJPY. Are you considering a long or short position?

USDJPY Trading Plan: Bullish Shark PatternI'm maintaining my bullish outlook on USDJPY and currently eyeing a potential buying opportunity. Here are the details:
- Setup: Bullish Shark Pattern
- Completion Level: 150.09
It's crucial to note the presence of the Type2 Bearish Fib-3 Bat on USDJPY's Weekly Chart. While it signals caution, my focus is on the bullish scenario with the completion of the Bullish Shark Pattern at 150.09.
Feel free to share your thoughts and trading plans for USDJPY. Are you considering a long or short position?
Check the chart link within the TradingView post for a visual representation.

GBPUSD Trading Plan: Bearish Deep Gartley PatternFor those looking for a trading opportunity on GBPUSD, here's a potential setup:
- Setup: Bearish Deep Gartley Pattern
- Completion Level: 1.2726
The GBPUSD weekly chart has shown a bearish trend. The Bearish Deep Gartley Pattern completion at 1.2726 presents an opportunity for traders interested in shorting GBPUSD.
Please share your thoughts on whether you are considering a long or short position on GBPUSD.

EURUSD Trading Plan: Bearish Shark Pattern RetestIn our EURUSD analysis, we are identifying a potential shorting opportunity for counter-trend traders. Here are the details:
1. Setup: Bearish Shark Pattern Retest
2. Timeframe: 1-Hourly Chart
3. Key Levels:
- Retest Level 1: 1.0852
- Retest Level 2: 1.0874
The Weekly Chart suggests a weaker bull trading setup, and on the 4-hourly chart, a bearish trend is noticeable. The Bearish Shark Pattern on the 1-hourly chart provides a counter-trend trading opportunity.
Feel free to share your thoughts on which retest level you find more suitable for a shorting opportunity.

GOLDIAM - Could be a gold mine in the Mid Term :-)An Investment pick, for target of 372,50% + ROI, after the all time high of 272 is taken off.
The stock is strong in all higher time frames. Showing Fibonacci 61% retracement in Monthly, moving strong to take off the Swing High at 272.
Volumes and Price action confirmation in weekly.
One may accumulate in dips till 164 levels. Stock structure becomes weak only on weekly closing less than 164.
One may consider entry based on risk management.

GBPJPY Trading Plan: Bullish Inverse Head and Shoulders PatternIn our GBPJPY analysis, we are observing a potential short-term buying opportunity on the 1-hourly chart. Here are the details:
1. Setup: Bullish Inverse Head and Shoulders Pattern
2. Timeframe: 1-Hourly Chart
3. Key Levels:
- Entry Point: Trendline retest (Blue)
- Caution: A close below the right shoulder would invalidate the setup.
This setup presents a unique aspect with its slanted neckline. While the longer-term bias may be towards shorting GBPJPY, the short-term focus is on a potential buying opportunity.
Feel free to share your insights, and let's navigate this market together.

GBPUSD Trading Plan: Bearish Deep Gartley PatternLet's discuss the trading plan for GBPUSD, and it revolves around the recognition of a Bearish Deep Gartley Pattern.
This pattern, once confirmed, provides an optimal setup for a shorting opportunity. Here's the breakdown:
1. Trading Setup: Bearish Deep Gartley Pattern.
2. Price Reversal Zone (PRZ): Awaiting confirmation at 1.2725.
Once the PRZ is confirmed, signaling the completion of the Bearish Deep Gartley Pattern, it opens up a potential shorting opportunity.
Feel free to share your thoughts and engage in a discussion on this trade plan.

Bullish Pin Bar1. Here is the bullish Pin Bar formation at the pullback and touches support level and continue the trend.
2. If the price touches the 50% of the previous Pin Bar then we can enter the long position at that point somewhere it touches.

EKC - Swing Trade Idea - 15% ROI.The stock is in uptrend in weekly,Monthly,Daily.
The stock has given a 1 year old breakout in Nov 2023, then again entered consolidation and broke out in Feb 2024, now has given a retest and ready to continue upside, indicated by price action.
One may consider entry at CMP for a target of 190 level.

BTML - Stock is poised for a short term and swing trade , 10-40%The stock has broken it's all time high and given a retest in daily.
Also the stock is retracing from its FIBONACCI 38.2 retracement level in monthly.
Volumes look strong and RSI in Lower time frame supports an entry now.
Sector - Entertainment.
Entry 215 range.
Target - 240, 260, 290.
Swing trade target at 240 - 10-15% ROI.

Mastering Trading with Support and Resistance LevelsTrading with support and resistance levels is a fundamental strategy that offers insights into market psychology and potential trade entry and exit points. This guide will explore how to effectively trade using these levels, highlighting the importance of confirmation, rejection patterns, candlestick patterns, and confluence with other indicators.
Understanding Support and Resistance
- Support : A price level where a downtrend may pause due to a concentration of demand.
- Resistance : A price level where an uptrend can pause or reverse because of a concentration of selling interest.
The Significance of Confirmation
Confirmation is crucial when trading with support and resistance, as it ensures that the price respects these levels before making a trade. Waiting for confirmation reduces the risk of false signals.
Candlestick Patterns: The Language of the Markets
Understanding candlestick patterns is essential for interpreting market sentiment at support and resistance levels. Patterns like bullish engulfing or bearish engulfing suggest strong reversals.
Finding Confluence with Other Indicators
Confluence enhances the reliability of trading signals. Combining support and resistance analysis with other indicators like moving averages or the stochastic RSI can provide stronger entry or exit signals.
Integrating Support and Resistance into Your Trading
Identify key levels : Mark clear support and resistance levels on your chart.
Wait for confirmation : Confirm the level is holding through candlestick patterns or price action before trading.
Look for rejection patterns : Observe candlestick formations for reversal signals.
Seek confluence : Use other indicators to validate your trading signals.
Manage your risk : Always set a clear stop-loss order to manage potential losses.
By employing these strategies, traders can enhance their market navigation skills, focusing on managing risk and seizing the right opportunities. With patience and practice, trading with support and resistance levels can be a vital part of a successful trading approach.

EURNZD UPDATEeurnzd has continued to move aggressively to the upside so i will be continuing to hold this position. on top of that ive gave you guys another breakdown of eurcad.

EURNZD LONG deep technical analysisFor this video i just wanted to go into a more deeper analysis of currency pair EUNZD and why i feel like buyers will take control. I want to see buyers push price back to 1.78 .

GBPJPY BUY/ Gbpaud updatelooking for sells with gbpaud and got out at a loss but currently since the open of london session market showed strong bullish pressure so i got out of sells and entered a high probabilty GBPJPY long.

GBPAUD update! 2/6/2024 7:09pmCgbpaud is continuing to make a new low as the 4hr candle is at its last hour before closure. currently watching gbpaud to break 1.92 to continue selling off.
*GBPAUD/SHORT

GBPAUD short analysis 2/6/24 5:20pmCgbpaud showing multiple signs that sellers are in control and im using euraud as correlation as evidence that gbpaud will continue to short.
*GBPAUD SHORT
