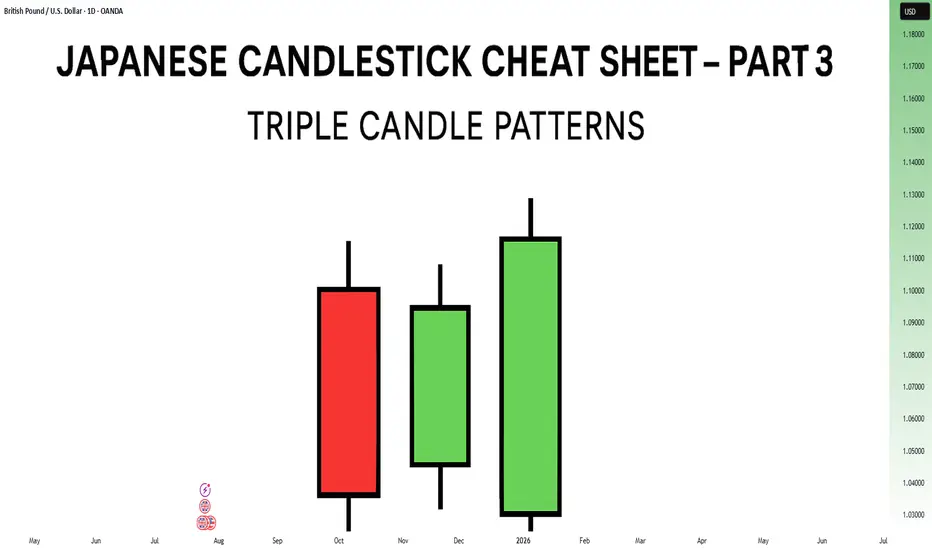
Japanese Candlestick Cheat Sheet – Part Three- 3 candle patternsSo far in this series, we've broken down single candle formations ( Part 1 ) and explored double candle signals ( Part 2 ) — the kind of patterns that give you quick, often powerful hints about the market’s mood.
But now it’s time to go a step further.
👉 In Part 3, we dive into triple candlestick formations — patterns that take more time to form, but often offer stronger confirmation and a more reliable narrative.
They’re like reading three full sentences from the market instead of just one or two words.
If you’re ready to spot momentum shifts (not noise), this lesson is for you.
Let’s decode the story behind formations like Morning Star, Three White Soldiers, and so on.
MORNING STAR
Bias: Bullish
What is the Morning Star pattern?
The Morning Star pattern consists of a bearish candle, a small-bodied middle candle, and a bullish candle, forming at the end of a downtrend to signal potential reversal. This pattern reflects a shift from seller dominance to buyer strength, as the middle candle marks a pause before a reversal. The Morning Star is a reliable signal that buyer interest is reemerging.
Understanding Morning Stars helps traders anticipate shifts in momentum, providing valuable entry points for new uptrends.
Meaning:
Found in downtrends; signals potential bullish reversal as buyers gain control, with strength confirmed by the third candle closing above the first.
BULLISH ABANDONED BABY
Bias: Bullish
What is the Bullish Abandoned Baby pattern?
The Bullish Abandoned Baby is a rare but powerful reversal pattern that consists of a bearish candle, a gapped doji, and a bullish candle. The middle doji reflects indecision, while the third bullish candle confirms the reversal. This pattern highlights a dramatic shift in sentiment, showing that buyers are prepared to take control.
Recognizing the Bullish Abandoned Baby can offer traders insights into pivotal market shifts.
Meaning:
Appears in downtrends; suggests a strong bullish reversal, as the middle doji shows indecision, with confirmation by a strong bullish move.
THREE WHITE SOLDIERS
What is the Three White Soldiers pattern?
The Three White Soldiers pattern consists of three consecutive bullish candles, each closing higher than the last, often appearing in downtrends to signal a potential bullish reversal. This pattern reflects sustained buying pressure, indicating that buyer sentiment is strong. Psychologically, it shows that buyers are steadily gaining confidence, pushing prices upward.
For traders, Three White Soldiers provide a clear signal of momentum, ideal for capturing emerging trends.
Meaning:
Found in downtrends; signals potential trend reversal, showing sustained buying strength, often signaling the start of a bullish trend.
MORNING DOJI STAR
What is the Morning Doji Star pattern?
The Morning Doji Star pattern is similar to the Morning Star, but with a doji as the middle candle, indicating greater indecision before a reversal. This pattern consists of a bearish candle, a doji, and a bullish candle, highlighting a transition from bearish to bullish sentiment. The doji reflects a moment when market sentiment is balanced, but the third candle confirms a bullish shift.
Interpreting Morning Doji Stars can help traders identify turning points in downtrends, providing valuable entry opportunities.
Meaning:
Appears in downtrends; signals potential bullish reversal, with indecision from the doji and confirmation by a strong bullish candle.
EVENING STAR
What is the Evening Star pattern?
The Evening Star is a three-candle pattern that appears at the top of an uptrend, signaling a potential bearish reversal. It consists of a bullish candle, a small-bodied middle candle, and a bearish candle, showing a transition from buyer control to seller strength. This pattern often appears at market peaks, where optimism is giving way to caution.
Understanding the Evening Star pattern helps traders anticipate downtrend formations, allowing them to time their exits.
Meaning:
Found in uptrends; signals potential bearish reversal as sellers gain control, confirmed if the third candle closes below the first.
BEARISH ABANDONED BABY
What is the Bearish Abandoned Baby pattern?
The Bearish Abandoned Baby is the bearish counterpart to the Bullish Abandoned Baby and consists of a bullish candle, a gapped doji, and a bearish candle. This pattern reveals a dramatic shift in sentiment from bullish to bearish, highlighting a sudden reversal at the top of an uptrend.
Recognizing the Bearish Abandoned Baby can offer traders insight into market tops and impending trend changes.
Meaning:
Appears in uptrends; indicates strong bearish reversal, as indecision in the doji is followed by selling strength.
THREE BLACK CROWS
What is the Three Black Crows pattern?
The Three Black Crows pattern consists of three consecutive bearish candles, each closing lower than the last, appearing in uptrends to signal potential reversal. This pattern reflects sustained selling pressure, indicating that sellers are gaining control. The Three Black Crows highlight a moment when buyer confidence wanes, marking the beginning of downward momentum.
For traders, this pattern provides a clear signal to avoid buying into weakening trends or even entering short trades.
Meaning:
Found in uptrends; signals potential bearish reversal, with sustained selling pressure often marking the start of a downtrend.
EVENING DOJI STAR
What is the Evening Doji Star pattern?
The Evening Doji Star is similar to the Evening Star, but with a doji as the middle candle, highlighting greater indecision. This pattern consists of a bullish candle, a doji, and a bearish candle, indicating a shift from bullish to bearish sentiment. The doji suggests that buyers are losing control, with sellers prepared to reverse the trend.
Understanding Evening Doji Stars allows traders to recognize market tops, helping them avoid overextended trends.
Meaning:
Appears in uptrends; signals potential bearish reversal, as the doji suggests indecision, confirmed by strong selling on the third candle.
Candlestickspatterns
How to Trade Doji Candles on TradingViewLearn to identify and trade doji candlestick patterns using TradingView's charting tools in this comprehensive tutorial from Optimus Futures. Doji candles are among the most significant candlestick formations because they signal market indecision and can help you spot potential trend reversal opportunities.
What You'll Learn:
• Understanding doji candlestick patterns and their significance in market analysis
• How to identify valid doji formations
• The psychology behind doji candles: when buyers and sellers fight to a draw
• Using volume analysis to confirm doji pattern validity
• Finding meaningful doji patterns at trend highs and lows for reversal setups
• Timeframe considerations for doji analysis on any chart period
• Step-by-step trading strategy for doji reversal setups
• How to set stop losses and profit targets
• Real example using E-Mini S&P 500 futures on 60-minute charts
This tutorial may help futures traders and technical analysts who want to use candlestick patterns to identify potential trend reversals. The strategies covered could assist you in creating straightforward reversal setups when market indecision appears at key price levels.
Learn more about futures trading with Tradingview: optimusfutures.com
Disclaimer:
There is a substantial risk of loss in futures trading. Past performance is not indicative of future results. Please trade only with risk capital. We are not responsible for any third-party links, comments, or content shared on TradingView. Any opinions, links, or messages posted by users on TradingView do not represent our views or recommendations. Please exercise your own judgment and due diligence when engaging with any external content or user commentary.
This video represents the opinion of Optimus Futures and is intended for educational purposes only. Chart interpretations are presented solely to illustrate objective technical concepts and should not be viewed as predictive of future market behavior. In our opinion, charts are analytical tools—not forecasting instruments. Market conditions are constantly evolving, and all trading decisions should be made independently, with careful consideration of individual risk tolerance and financial objectives.

Volume Spread Analysis - Understanding Traps & ConfirmationDespite the fact that the so-called “Big Players” in the game of ups and downs we call the market have the power to manipulate it in ways some cannot even imagine, what they ultimately seek is a healthy market. I’ve mentioned in previous posts that the market behaves like a living organism — and like any organism, it must be healthy in order to grow.
In simple terms, the traps institutional players set are there because they need cash flow — liquidity — to achieve that growth. But why do they need to use traps at all? The answer lies in the numbers: one institutional player is equivalent to hundreds, if not thousands, of uninformed or poorly trained retail traders. So, to sustain growth, they are not just inclined but sometimes forced to create traps.
Now imagine this: in a market with enormous capital, one big player is equivalent to 100 retail traders. If 25% of those traders were skilled — truly good at the game — think of how much more cash flow would occur, and how much healthier and more stable that growth could be.
But don’t be fooled — while big players may benefit from a small portion of skilled retail participants, it’s not their actual goal. Still, it wouldn't hurt them either, as long as liquidity and volatility are preserved. In fact, a higher percentage of skilled players could deepen liquidity and reduce the need for extreme manipulation.
However, if too many retail traders become skilled, the game tightens. Profit margins shrink. The edge that institutions hold becomes harder to maintain. And in such a scenario, consistent profitability becomes more difficult — for everyone.
As I’ve emphasized in previous ideas, there is a way to understand institutional traps — and one of the keys is learning how to interpret the Relative Strength Index (RSI) properly. However, since RSI is by nature an oscillator, its signals require confirmation. And what better tool to use for confirmation than Volume — specifically through the lens of Volume Spread Analysis (VSA)?
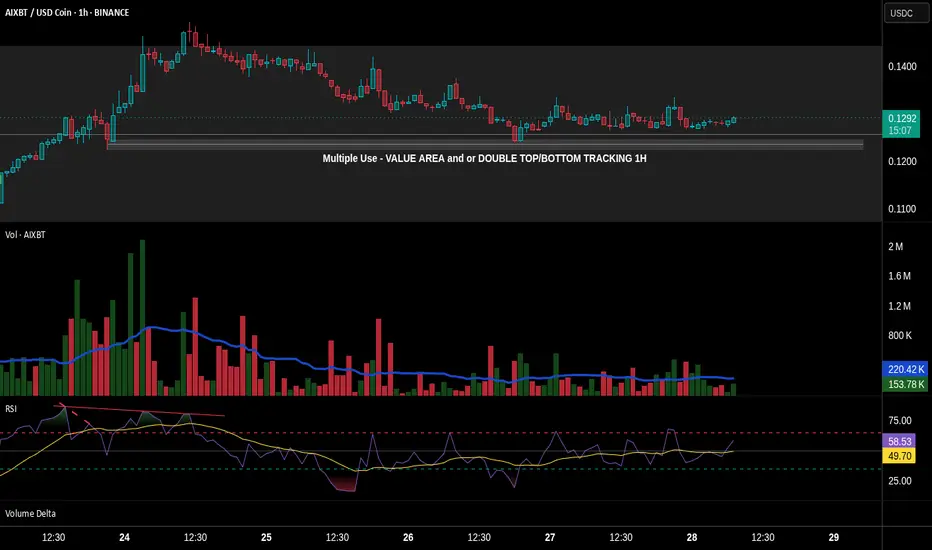
In this post, we’ll partially explore how these traps are revealed, using basic tools available on TradingView. We'll also uncover a potential trap in the chart of AIXBT/USD Coin from Binance, using the 1-hour time-frame.
🔹 1. Pre-Top Volume Cluster
Let’s begin at the very top of the chart. Just before this top, we can spot a bullish volume cluster — four consecutive volume spikes with rising price. In VSA, such a cluster often suggests that the current trend is reaching exhaustion.
⚠️ Important Note: Not all clusters mark a reversal. Even if we see one or two bearish candlesticks after-ward — even if they are engulfing — that alone does not confirm the reversal. The real signs are already present in the volume indicator.
As I’ve said in the past, in previously posted ideas: Big Players always leave footprints. Learning to read those footprints is the language every serious retail trader must eventually understand. And one of the clearest footprints is what we’ll discuss next.
🔻 2. The Buying Climax
A Buying Climax is a tell-tale sign of professional distribution — it appears (in our case) as a large bullish volume spike accompanied by a bearish candlestick, signaling the potential end of a rally.
In our AIXBT/USD Coin chart, we observe two buying climaxes:
• The first comes at the end of the bullish volume cluster, followed by a bearish candle.
• The second follows right after, repeating the same bearish confirmation.
🧠 Even though price was making a new Higher High — these repeated climaxes on increasing volume suggest supply is entering the market, and the uptrend is likely unsustainable.
✅ Conclusion
This is just one piece of the larger puzzle, but even basic tools like RSI and Volume, when read in the context of structure and intent, can reveal traps set by institutional hands. The more we train ourselves to see these signs, the closer we get to trading in harmony with the market’s true rhythm — not against it.
Now let’s take a look at another signal that hints at a possible reversal. But before we continue, keep in mind: what I’m about to describe doesn’t always play out in the simplified way I’ll mention here. The market behaves differently at any given moment — so this kind of analysis always requires a careful and adaptive approach.
This time, I’m referring to a smaller bearish cluster, made up of three volume spikes, each of them clearly above the 20-period Moving Average — and appearing just before the bullish cluster I highlighted earlier.
• The fact that the first spike in this bearish group breaks above the MA is a strong signal that bearish pressure is stepping in.
• The fact that all three spikes remain above the MA adds weight to that signal.
However — and this is crucial — just like I mentioned before, this alone doesn't confirm a reversal. It still requires confirmation.
Even though this smaller bearish cluster forms a new low, and even though it aligns with a bearish RSI divergence marked with a dashed trend line, it’s not a signal to enter a trade. Why? Because volume confirmation is missing. And that's exactly why RSI alone isn't enough. It can point to weakness — but not confirm the turn.
True confirmation only comes with the next bullish volume spike, which:
• a) breaks above the MA,
• b) is higher than the first bearish spike in the previous cluster,
• c) appears with an engulfing candlestick, and
• d) is supported by an RSI plot that follows the move.
This collective behavior — the interaction between price, volume, and momentum — is not random. It’s one of the many harmonies that exist in the market’s structure. And learning to recognize these harmonies is key to understanding when the market is genuine — and when it's trying to trap you.
🔚 Conclusion
All of this leads me to one conclusion — based not just on theory, but on direct experience.
We’ve all seen the countless videos across platforms where retail traders explain things like RSI divergences as if they’re guaranteed signals. But the truth is: not all of these videos are made by successful traders — and blindly following them can be dangerous.
Early in my trading journey, I made that exact mistake. I followed those “educational” videos without question, and nearly blew my account in the process.
Can you imagine what would happen if someone entered a trade solely based on the divergence we discussed — without waiting for confirmation?
If you’ve followed this chart example to its end, you already know the answer.
Worse, this kind of psychological frustration often leads to even bigger mistakes — especially if you haven’t applied one of the simplest protective tools: the Stop Loss. And sadly, many traders skip it.
So let this be a reminder:
A divergence is not a signal. Confirmation is everything.
Let’s now take things a step deeper — by partially revealing something that remains known only to a small circle of elite traders.
Something that’s rarely discussed in public — yet sits hidden in plain sight.
Many traders know that Volume Spread Analysis (VSA) is based on the teachings of Richard Wyckoff and expanded through Tom Williams in Master the Markets. And yes — the most of VSA’s power comes from those principles.
But that’s only part of the story. What did these two big names revealing in secret code using multiple paragraphs and terminologies, but purposely do not reveal it in simple words in a few lines. And they are doing the right thing. Because if I said to myself that if everyone knew that then the market might crashed, then for sure they had that thought as well
What truly sets VSA apart, and what gives it its real power, is that it operates in two distinct languages.
🧩 The Hidden Language of VSA — What Most Don’t See
Let’s now go a step deeper — by partially revealing something known only to a few traders who’ve spent enough time observing the market beyond surface-level signals.
Something that’s often overlooked, yet has always been in plain sight.
We all know that VSA stands for Volume Spread Analysis.
And we commonly refer to “spread” as the distance between the open and the close of a candlestick. This is what many traders fixate on — the relationship between price movement and volume.
But that’s only part of the story.
What did names like Wyckoff and Tom Williams really reveal?
They spoke in code — long paragraphs, obscure terminology, layered ideas — never quite saying "this is the hidden key" in a few plain words.
And they were right to do so.
Because I’ve thought the same thing myself:
If everyone knew this… if it was simplified and passed around like a hack… the market could collapse into chaos.
If I’ve had that thought, I’m certain they did too.
So instead, they left trails. Patterns. Puzzles.
They left the second language in the open — but made sure only those with patience, discipline, and time in the charts would ever truly hear it.
There are things the open and close can’t tell you, but...
That… is part of what I meant earlier when I said VSA speaks in two languages.
Some of you already sense what I’m pointing toward.
For the rest — keep watching.
You’ll know it when you see it.
And once you do, you’ll never unsee it again.
Let’s begin with what most traders already know.
We say "spread" in VSA to refer to the range between the open and the close of a candlestick. This spread, in relation to volume, tells us whether a candle shows strength or weakness.
• A wide spread on high volume may signal professional activity.
• A narrow spread on high volume could suggest absorption or hidden effort.
This is the first language — the most commonly taught, and the most widely shared.
But what about the second?
Here's where things get interesting.
Let’s revisit our AIXBT/USD Coin chart, and specifically the large engulfing candlestick that forms around 18:30, just after the very top.
Now ask yourself:
• 🔍 Where did this candle open?
• 📍 What previous zone did it revisit or retest? What’s the story behind on that retest?
• Have you noticed the macro scale Hidden bearish divergence between RSI & PA?
What you're seeing is not just a rejection.
It’s a trigger zone — a price level left behind earlier by institutional activity.
This candle, with its precise open, combined with the volume behavior, is no coincidence. It's not just a rejection — it's a setup, part of a pre-engineered trap. By stealing what Tom Williams said: Big players are simply saying to uninformed traders – “thank you for your money”.
The interaction of price levels over time, the zones formed by previous activity, and how volume behavior aligns with those zones to signal intent.
Most traders never see this and even fewer can interpret it.
Why This Matters
That engulfing candlestick is not just a visual cue — it's a multiple level footprint.
It confirms everything we discussed earlier about how the market is manipulated — often in ways most traders can’t even begin to imagine. Two opposite forces within a zone. One prevails while the other reveals a future!
So now, let this sink in:
To truly master VSA, one must learn to read both languages.
The visible structure, and the hidden context.
One without the other is incomplete.
Now you know why Confirmation is so crucial.
That’s all for now. I hope that all the above paragraphs were able to give you a hint of how things work! And remember: Everything I write is just a small glimpse of the whole that needs to be considered.
Until next time — stay safe, trade wisely, and never stop learning.
3 Line Strike Pattern: What It Means and How to Use It3 Line Strike Pattern: What It Means and How to Use It in Trading
Candlestick patterns are crucial tools for traders, offering valuable insights into market sentiment and potential price movements. Among these patterns, the Three Line Strike setup is particularly sought after by traders in forex, stock, commodity, and index markets. This article explores the intricacies of the Three Line Strike, explaining how to identify it on charts, highlighting its unique characteristics, and discussing how to incorporate it into trading strategies.
Three Line Strike Pattern: An Overview
The Three Line Strike is a candlestick pattern used in technical analysis to trade trend continuations. However, it often appears ahead of trend reversals. The pattern consists of four candlesticks and can be found in up- and downtrends.
Bearish Three Line Strike
The bearish 3 Line Strike candlestick pattern suggests a continuation of a downtrend. It starts with three consecutive bearish candles, each opening and closing lower than the previous one. This is followed by a large bullish candle, which opens lower and closes above the open price of the first bearish candle. This pattern reflects the strength of the downtrend. Still, it may appear at the bottom of the downtrend and signal a trend reversal.
Bullish Three Line Strike
The bullish 3 Line Strike candlestick pattern suggests the potential continuation of a solid uptrend. It starts with three consecutive bullish candles, each opening and closing higher than the last. This is followed by a large bearish candle, which opens higher and closes below the close of the first bullish candle. This pattern indicates that the solid uptrend may continue, but it may signal the market will turn down if it’s formed at the peak of the uptrend.
Analysing Three Line Strike Patterns
As the Three Line Strike pattern can provide both reversal and continuation signals, it’s vital to combine it with other analytical tools, including trend indicators like moving averages and oscillators like the Relative Strength Index. Also, traders consider the overall trend on higher timeframes.
- Entry: To enter a trade using the Three Line Strike, traders identify the overall trend. They may wait for the pattern to be formed and the following candle to close. If the following candle is bearish, traders usually open a sell position. If it is bullish, they consider an opportunity to go long. However, traders also may enter the market at the closure of the pattern’s fourth candle.
- Stop Loss: Risk management is crucial, and traders typically set their stop-loss levels above/below the fourth candle, considering the trend strength. Alternatively, they may place the stop-loss order below or above the nearest swing point or support/resistance level, considering market volatility and risk tolerance.
- Take Profit: Traders aim to secure their potential profits by setting profit targets based on the risk/reward ratio. This could be at the next significant support or resistance level or based on technical indicators, including Fibonacci retracements.
A trader finds a bullish 3 Line Strike setup on the daily chart of Qualcomm stock. However, this time, it serves as a reversal signal. They enter the short position at the close of the candle, following the pattern. Their stop loss is above the setup, with the take profit at the next support level.
A bearish Three Line Strike setup is formed on the hourly chart of Brent Crude Oil. A trader takes a long position at the close of the fourth candlestick. Their stop loss is below the formation, with the take profit placed at the next resistance level.
Psychology Behind the Three Line Strike Pattern
The effectiveness of the Three Line Strike pattern relies on understanding the underlying psychological factors influencing market participants. Greed, fear, hope, and anxiety drive buying and selling decisions.
- Initial Sentiment: The first few candlesticks in a Three Line Strike candlestick pattern represent the prevailing sentiment in the market. Typically, this sentiment is characterised by either greed (in an upward trend) or fear (in a downward trend), depending on the market direction prior to forming the pattern.
- Potential Reversal: Although this pattern is considered continuation, in most cases, it provides a reversal signal. A strong fourth candle that engulfs three smaller candlesticks reflects the change in the market sentiment. The reversal signal triggers market participants to reassess existing positions and strategies.
- Reaction: Those who were previously aligned with the old trend may feel fear or anxiety, leading them to unwind their positions to avoid potential losses. Meanwhile, contrarian traders, driven by a sense of opportunity and confidence, may enter new positions in anticipation of the emerging trend reversal, fueled by their belief that market sentiment is shifting.
Application in Trading Strategies
Applying the 3 Line strike pattern in trading strategies encompasses various elements beyond just its recognition. Let's delve into how traders implement additional steps to enhance their overall trading performance.
- Seeking Additional Confirmation: Traders often seek additional confirmation from other technical indicators such as the Relative Strength Index (RSI), Moving Average Convergence Divergence (MACD), or Bollinger Bands. These indicators offer complementary insights into market dynamics, validating the signals generated by the Three Line Strike pattern.
- Strategic Placement and Timeframe Alignment: Traders may align the pattern with key support or resistance levels on higher timeframes to validate its significance and potential reversal points. Through multi-timeframe trading, traders may gain a more comprehensive understanding of market trends to analyse future price movements.
- Entry and Risk Management: Traders should place their entry and exit points carefully. As the pattern may provide continuation and reversal signals, incorporating disciplined risk management techniques might help traders protect their capital and minimise their potential losses.
Caveats to the Pattern
High volatility periods can amplify the occurrence of false signals and erratic price movements, potentially leading to misguided trades. Conversely, during periods of low volatility, price action may be sluggish, and confirmations could be delayed. Therefore, it's important for traders to adapt their strategies accordingly.
Another important consideration is the possibility of false breakouts. Despite the apparent formation of a Three Line Strike pattern, there's a risk of the price briefly breaching the pattern's boundaries before reverting to its original direction. These false breakouts can deceive traders into entering premature trades, resulting in losses. To mitigate this risk, traders can exercise patience and vigilance, waiting for strong confirmation signals before committing to a trade.
Key Differences Between Three Line Strike and The Three Black Crows/Three White Soldiers
The key differences between the Three Line Strike pattern and the Three Black Crows/Three White Soldiers patterns lie in their trading formations and implications:
Aspect - Three Line Strike Pattern
Formation - Consists of four consecutive candlesticks, with the fourth candlestick completely engulfing the previous three.
Implication - Indicates either a trend continuation or a reversal in market sentiment, either from bullish to bearish or vice versa.
Aspect - Three Black Crows/Three White Soldiers
Formation - Consists of three consecutive candlesticks with progressively lower (crows) or higher (soldiers) closing prices.
Implication - Reflects a strong momentum in the direction of the prevailing trend, suggesting a continuation of the trend rather than a reversal.
The Bottom Line
The Three Line Strike is a complicated pattern as it may provide continuation and reversal signals. Despite its complexity, it often appears on a price chart, making it a valuable tool for traders. Mastering price action chart analysis is a gradual process. However, with skill, traders can potentially improve their trading efficiency.
FAQs
What Is the 3 Strike Rule in Trading?
The 3 strike rule in trading refers to the Three Line Strike pattern. The pattern consists of three consecutive up/down candles followed by a fourth long bearish/bullish candle that opens above/below the previous candle’s close but closes below/above the first candle's open. It’s believed to provide continuation signals, but it often appears before a trend reversal.
What Is the Three Strike Strategy?
The Three Strike Strategy refers to the 3 Line Strike candlestick pattern. It’s based on the assumption that the pattern will be followed by either a reversal or a continuation of the trend. Traders often wait for the candlestick to close above/below the pattern for an entry point, place a profit target, considering the closest resistance/support levels, and potentially limit losses by placing a stop-loss order below/above the pattern.
This article represents the opinion of the Companies operating under the FXOpen brand only. It is not to be construed as an offer, solicitation, or recommendation with respect to products and services provided by the Companies operating under the FXOpen brand, nor is it to be considered financial advice.

What Is a Morning Star Pattern & How Can You Use It in Trading?What Is a Morning Star Pattern, and How Can You Use It in Trading?
The morning star candlestick is a popular price action pattern that technical analysts and traders use to identify potential trading opportunities. It indicates a reversal from a bearish to a bullish trend and is a valuable addition to any trader's toolkit. In this article, we will cover all the technical aspects of the morning star candlestick pattern.
What Is the Morning Star Candlestick Pattern?
The morning star in technical analysis is a reversal formation that appears at the end of a downtrend and signals a trend reversal. It consists of three candles.
To identify it on the chart, you should look for the following:
1. Downtrend: The market should be in a downtrend, and the first candle should be long and bearish.
2. Indecision: The second candle is usually expected to have a gap down, but gaps are uncommon in forex. Therefore, a small-bodied candle is considered sufficient. It's worth noting it can be either bullish or bearish, but if it’s bullish, the signal is stronger.
3. Significant increase: The third candle should be strong and bullish and close above the midpoint of the first bearish one. If it forms with a gap up, the buy signal is considered stronger.
When Morning Star Candlestick Patterns Occur
Traders can identify the morning star candlestick pattern in stocks, forex pairs, commodities, and cryptocurrencies*. It may also be observed across various timeframes, from minutes to weeks.
Generally speaking, a morning star pattern can be considered more reliable when it appears on a higher timeframe. For instance, a morning star candlestick pattern has more significance when it occurs over three days vs three minutes, given the increased amount of price action and market participation reflected over longer periods.
Psychology Behind the Pattern
The morning star reversal pattern reflects a shift in market sentiment from bearish to bullish. Initially, a strong bearish candle indicates prevailing selling pressure. The second candle, with its small body, suggests indecision as the market stabilises and neither bulls nor bears dominate. This pause indicates that sellers are losing momentum. The third morning star candle, a strong bullish one, confirms the shift as buyers take control, driving prices higher. This pattern signals that the downtrend is likely exhausted, and a potential reversal is underway due to increasing buyer confidence.
Trading with the Morning Star
Traders can use the following steps to trade this setup:
1. Identify the setup: Look for a setup on the chart formed after a solid downtrend.
2. Confirmation: After identifying the formation, traders should confirm it before entering a long position.
3. Enter a long position: Consider entering a long position once the formation is confirmed.
4. Determine a take-profit target: Although candlesticks don’t provide specific entry and exit points, traders may consider the closest resistance level to take potential profit.
5. Monitor the trade: Continuously monitor the trade and adjust the stop-loss and take-profit levels as needed based on market conditions.
What Is the Morning Star Candlestick Strategy?
The morning star trading strategy leverages the formation's ability to signal a bullish reversal after a downtrend. The formation's reliability increases when it occurs at a support level and is confirmed by a momentum indicator like the RSI or MACD.
Entry:
- Traders look for the full morning star to form at a support level.
- They then look for a confirmatory bullish signal from a momentum indicator, such as RSI showing oversold conditions, a bullish MACD crossover, or a bullish divergence in either.
- Traders may wait for additional confirmation, like RSI moving back above 30, or enter on the close of the third candle in the pattern.
Stop Loss:
- A stop loss might be set below the swing low of the setup.
- Alternatively, traders may place the stop loss beyond the lower boundary of the established support level.
Take Profit:
- Profits might be taken at a predetermined risk-reward ratio, like 2:1 or 3:1.
- Traders also often aim for an opposing resistance level where a further reversal might occur.
Morning Star and Other Formations
Traders should not confuse the morning star candle formation with other formations, such as the evening star, which is the complete opposite.
Doji Morning Star
In a traditional morning star reversal pattern, the candle that appears in the middle of the formation has a small real body, meaning there is a clear difference between the opening and closing prices.
In a morning doji star formation, the second candlestick has characteristics of a doji, where the opening and closing prices are very close to each other, resulting in a very small real body. This reflects the indecision as neither bulls nor bears can take control of the market.
The doji setup is less common than the traditional formation, but it still signals a potential upward movement after a prolonged downtrend.
Evening Star
In contrast to a morning setup, an evening star is a bearish setup occurring after an uptrend. It also consists of three candles – a long bullish one, a small-body one (it can also be a doji), and a long bearish one that closes below the midpoint of the first bullish candle. This suggests that the market is about to turn down.
Benefits and Limitations of the Morning Star Candle
The morning star is a useful tool for traders seeking to identify potential market reversals, but it does come with some benefits and limitations.
Benefits
- Strong Reversal Signal: Indicates a bullish reversal after a downtrend, helping traders anticipate upward moves.
- Broad Applicability: Effective across various financial instruments such as forex, stocks, commodities, and cryptocurrencies*.
- Timeframe Flexibility: It can be observed on different timeframes, from intraday to weekly charts.
Limitations
- False Signals: Like all patterns, it can produce false signals, especially in volatile markets.
- Confirmation Needed: A morning star pattern entry requires confirmation from additional indicators or formations to improve accuracy.
- Experience Required: Identifying the formation correctly and interpreting its signals requires experience and a good understanding of price action.
Final Thoughts
While candlestick formations such as the morning star can be useful for traders to identify potential trading opportunities, it is crucial to remember that they are not foolproof and should not be the sole choice of market participants when making their trading decisions. Traders should also incorporate technical indicators and develop risk management techniques to potentially minimise losses.
FAQ
What Is a Morning Star in Trading?
The meaning of a morning star in trading refers to a bullish reversal formation consisting of three candles. It appears at the end of a downtrend, indicating a potential shift to an uptrend. The setup includes a long bearish candle, a small-bodied candle, and a long bullish candle.
Is the Morning Star Bullish or Bearish?
It is a bullish candlestick pattern that indicates a potential reversal from a downtrend to an uptrend in the market. It suggests that the selling pressure is subsiding, and buying pressure is beginning to take over.
What Does the Morning Star Pattern Indicate?
It is a three-candle price action, often indicating a bullish reversal in the market. It suggests that selling pressure has been exhausted, and buyers are starting to gain control of the market.
How Do You Read the Morning Star Pattern?
To read the morning star formation, traders should look for the following characteristics: a long bearish candle formed in a solid downtrend and followed by a bullish or bearish candle with a small real body, which in turn is followed by a long bullish candle closing above the midpoint of the first one.
What Is the Opposite of Morning Star?
The opposite of a morning star is the evening star, a bearish reversal pattern. It appears at the end of an uptrend, signalling a potential shift to a downtrend. The morning and evening stars are similar, except the latter mirrors the former, consisting of a long bullish candle, a small-bodied candle, and a long bearish candle.
*Important: At FXOpen UK, Cryptocurrency trading via CFDs is only available to our Professional clients. They are not available for trading by Retail clients. To find out more information about how this may affect you, please get in touch with our team.
This article represents the opinion of the Companies operating under the FXOpen brand only. It is not to be construed as an offer, solicitation, or recommendation with respect to products and services provided by the Companies operating under the FXOpen brand, nor is it to be considered financial advice.

Bullish Engulfing Pattern: A Strong Reversal SignalBullish Engulfing Pattern: A Strong Reversal Signal
The bullish engulfing pattern is a two-candlestick formation that suggests a possible reversal from a downtrend to an uptrend in the financial market. This particular pattern holds immense value for traders and technical analysts as it equips them with the means to discern potential buying opportunities. In this article, we will explain how traders implement this pattern in their trading strategies.
What Is a Bullish Engulfing Pattern?
The bullish engulfing is a technical analysis pattern consisting of two candles. This formation emerges when a large bearish candlestick is succeeded by a larger green one that entirely engulfs it.
What does the bullish engulfing mean? The bullish engulfing indicates a potential shift in market sentiment, suggesting that buying pressure might surpass selling pressure in the near future and highlighting a possible reversal from a downtrend to an uptrend.
Traders can find the bullish engulfing candlestick pattern across various financial instruments, including currencies, stocks, cryptocurrencies*, ETFs, and indices.
Bearish Engulfing vs Bullish Engulfing
The bullish engulfing pattern has a counterparty - bearish engulfing. The bearish engulfing pattern occurs during an uptrend, indicating a change in market sentiment and potential price reversal to the downside. It consists of two candles, where the second is larger and bearish and completely engulfs the body of the preceding candlestick.
How Can You Trade the Bullish Engulfing Pattern?
Here are some steps traders consider when trading with the bullish engulfing:
- Identification: Look for a clear bullish engulfing setup on a price chart at the end of a downtrend.
- Entry Point: Although candlestick patterns don't provide precise entry and exit points as chart patterns do, there are general rules you could use.
The entry point could be set slightly above the high of the bullish engulfing formation. In the conservative approach, traders enter the market after several candles close higher. In a risky approach, traders open a buy position after the pattern is formed.
- Exit Point: A stop-loss level could be below the low of the engulfing candle or below a nearby support level. A take-profit level could be based on a trader’s risk/reward ratio or key resistance levels.
- Risk Management: You can consider a risk management strategy to potentially limit losses. Traders focus on appropriate position sizing and risk-to-reward ratios to maintain a balanced approach to trading.
- Trade Monitoring: Once you have entered the trade, monitor price action and market conditions. Pay attention to any sign of reversal confirmation or potential obstacles that may invalidate the signal.
- Stop-Loss and Take-Profit Adjustment: As the trade progresses, you may consider adjusting your stop-loss level to protect potential returns. Similarly, you may consider adjusting your take-profit level if the price signals a strong uptrend.
Live Market Example
Let's consider an example of a bullish engulfing on the forex chart. The bullish engulfing candle in the example below is marked with 1 and 2. The trader sets the entry point above the green candle and a stop-loss level below it. The take profit is at the closest resistance level.
How Do Traders Confirm a Bullish Engulfing Candlestick Pattern?
Confirming this pattern enhances the reliability of its signals and helps traders make informed decisions. Here are key steps to confirm it:
- Volume Analysis: Traders typically look for increased buying trading volume accompanying the candle. Higher volume suggests stronger buyers’ interest and validates the reversal signal.
- Follow-Up Candlesticks: Waiting for subsequent closes can confirm the upward momentum. A series of higher closes strengthens its credibility.
- Support Levels: If it forms near a significant support level, this adds context to the reversal, as buyers are stepping in at a critical price point.
- Technical Indicators: Complementary indicators like the Relative Strength Index (RSI), Stochastic Oscillator, or a pair of moving averages can confirm the shift in sentiment.
- Market Context: Traders assess the overall market trend and news to ensure the formation aligns with broader market conditions.
Bullish Engulfing and Other Patterns
Let’s take a closer look at how this pattern compares to other chart formations, like the piercing and harami.
What Is the Difference Between a Bullish Engulfing and a Piercing Pattern?
A bullish engulfing pattern occurs when a large bearish bar is followed by a larger candlestick that completely overtakes the former's body. This indicates a strong potential reversal from a downtrend to an uptrend.
In contrast, a piercing formation also signals a potential reversal but is slightly weaker. It forms when a bearish candle is followed by a bullish candle that closes above its midpoint but doesn’t envelop it entirely.
What Is the Difference Between a Bullish Engulfing Pattern and a Bullish Harami Pattern?
The bullish harami pattern consists of a large red candle followed by a smaller green candle that is completely contained within the body of the red candle. This formation suggests a potential reversal but is generally considered less strong than the bullish engulfing candle pattern, as the latter completely envelops the previous bearish bar, showing more decisive buying pressure.
Final Thoughts
While this pattern offers valuable insights into potential trend reversals, it's essential to complement it with technical indicators and robust risk management for effective use. Also, be sure to explore other patterns as they may look very similar but provide different signals.
FAQ
What Is a Bullish Engulfing Pattern?
A bullish engulfing pattern is a two-candlestick formation in technical analysis that suggests a potential reversal from a downtrend to an uptrend. It occurs when a large bearish candlestick is followed by a larger bullish candlestick that completely engulfs the body of the preceding bearish candle.
How Reliable Is the Bullish Engulfing Pattern?
The reliability of the bullish engulfing pattern as a reversal signal depends on various factors, including the overall market context, confirmation from other technical indicators, and the timeframe being analysed. While it can be a strong indication of a potential trend reversal, it is not foolproof and should be used in conjunction with other tools and fundamental analysis.
What Is a Bullish Engulfing Candle Trading Strategy?
The bullish engulfing candle strategy involves identifying this pattern at the end of a downtrend as a signal for a potential sentiment shift. Traders typically enter a buy position slightly above the high of the closing bar, with stop-loss levels set below the low or beneath nearby support levels. Take-profit levels are determined based on risk/reward ratios or key resistance levels.
Do Wicks Matter in Engulfing Candlesticks?
Yes, wicks matter in the formation. The wicks provide insights into price rejection and volatility. For a strong confirmation, the absence of long upper wicks suggests sustained buying pressure, reinforcing its validity as a reversal signal.
*Important: At FXOpen UK, Cryptocurrency trading via CFDs is only available to our Professional clients. They are not available for trading by Retail clients. To find out more information about how this may affect you, please get in touch with our team.
This article represents the opinion of the Companies operating under the FXOpen brand only. It is not to be construed as an offer, solicitation, or recommendation with respect to products and services provided by the Companies operating under the FXOpen brand, nor is it to be considered financial advice.

How Can You Use a Spinning Top Candlestick Pattern in Trading?How Can You Use a Spinning Top Candlestick Pattern in Trading?
The spinning top candle is a key tool in technical analysis, highlighting moments of market indecision. This article explores what spinning tops represent, how they differ from similar patterns, and how traders can interpret them to refine their strategies across various market conditions.
What Does a Spinning Top Candlestick Mean?
A spinning top is a candlestick pattern frequently used in technical analysis. It consists of one candle with a small body and long upper and lower shadows of approximately equal length. The candle’s body symbolises the discrepancy between the opening and closing prices during a specified time period, while the shadows indicate that volatility was high and neither bulls nor bears could take control of the market.
This pattern signifies market indecision, where neither buyers nor sellers have gained dominance. It suggests a state of equilibrium between supply and demand, with the price oscillating within a narrow range. The spinning top may indicate continued sideways movement, particularly if it appears within an established range. However, if it forms after a bullish or bearish trend, it could signal a potential price reversal. Traders always look for additional signals from confirming patterns or indicators to determine the possible market direction.
It’s important to note that the spinning top candle is neutral and can be either bullish or bearish depending on its context within the price chart. The colour of the candle is not important.
Spinning Top vs Doji
Doji and spinning top candlesticks can be confused as they have similar characteristics. However, the latter has a small body and upper and lower shadows of approximately equal lengths. It indicates market indecision, suggesting a balance between buyers and sellers without a clear dominant force. Traders interpret it as a potential reversal signal, reflecting a possible change in the prevailing trend.
The doji candlestick, on the other hand, has a small body, where the opening and closing prices are very close or equal, resulting in a cross-like shape. If it’s a long-legged doji, it may also have long upper and lower shadows. A doji candle also represents market indecision but with a focus on the relationship between the opening and closing prices. Doji patterns indicate that buyers and sellers are in equilibrium, and a potential trend reversal or continuation may occur.
How Do Traders Use the Spinning Top Pattern?
Traders often incorporate the spinning top candle pattern into their analysis as a way to interpret moments of market indecision. Whether the pattern appears during a trend or at key turning points, its context plays a significant role in shaping trading decisions.
In the Middle of a Trend
When a spinning top forms in the middle of an ongoing trend, traders often view it as a signal of potential market hesitation. This indecision can indicate a pause in momentum, suggesting either a continuation of the trend or the possibility of a reversal.
Entry
In such cases, traders typically wait for confirmation of the next price move. A break above the high of the spinning top may signal the trend will continue upward, while a break below the low could suggest the trend may move down. Observing how subsequent candles interact with the spinning top can help a trader gauge the market’s intentions.
Take Profit
Profit targets might be aligned with key price levels visible on the chart, such as recent highs or lows. For traders expecting trend continuation, these targets might extend further, while those anticipating a reversal might aim for closer levels.
Stop Loss
Stop-loss orders might be set in accordance with the risk-reward ratio. This placement helps account for the pattern's characteristic volatility while potentially protecting against unexpected movements.
At the Top or Bottom of a Trend
When a spinning top forms at a significant peak or trough, it often draws attention as a potential reversal signal. This appearance may reflect market uncertainty after a prolonged uptrend or downtrend.
Entry
Confirmation from subsequent price action is critical. Traders typically observe if the price breaks above the candle (bullish spinning top) or below the candle (bearish spinning top) to determine the likelihood of a reversal.
Take Profit
Targets could be set at major support or resistance zones. A trader expecting a reversal may look for levels reached during the previous trend.
Stop Loss
Stops could be placed in accordance with the risk-reward ratio, allowing for the volatility often present at trend-turning points while potentially mitigating losses.
Remember, trading decisions should not solely rely on this formation. It's crucial to consider additional technical indicators, market trends, and risk management principles when executing trades.
Live Example
In the EURUSD chart above, the red spinning top candle appears at the bottom of a downtrend. A trader went long on the closing of the bullish candle that followed the spinning top. A take-profit target was placed at the closest resistance level, and a stop-loss was placed below the low of the spinning top candlestick.
There is another bearish spinning top candlestick pattern on the right. It formed in a solid downtrend; therefore, a trader could use it as a signal of a trend continuation and open a sell position after the next candle closed below the lower shadow of the spinning top candle.
A Spinning Top Candle: Benefits and Drawbacks
The spinning top candlestick pattern offers valuable insights into market indecision, but like any tool in technical analysis, it has its strengths and limitations. Understanding these might help traders use it more effectively.
Benefits
- Identifies Market Indecision: Highlights moments where neither buyers nor sellers dominate, providing a clue about potential price reversals or continuations.
- Versatile Across Trends and Markets: Can signal price consolidation, continuation, or reversal depending on its context. It’s also possible to use the spinning top across stocks, currencies, and commodities.
- Quick Visual Insight: The distinctive shape makes it easy to spot on charts without extensive analysis.
Drawbacks
- Requires Confirmation: On its own, the pattern lacks particular signals, needing additional indicators or price action for confirmation.
- Context-Dependent: Its reliability depends heavily on where it forms in the trend, making it less useful in isolation.
- Prone to False Signals: Market noise can produce spinning tops that do not lead to meaningful movements, increasing the risk of misinterpretation.
Takeaway
The spinning top candlestick reflects market indecision and suggests a potential reversal or consolidation. Traders use this pattern as a tool to identify areas of uncertainty in the market. Therefore, it's important to consider the spinning top pattern within the broader context and get confirmation from other analysis tools.
If you want to test your spinning top candlestick trading strategy or apply it to a live chart, open an FXOpen account and start trading with tight spreads from 0.0 pips and low commissions from $1.50. Good luck!
FAQ
What Is a Black Spinning Top?
A black (red) spinning top is a variation of the spinning top candlestick pattern with a small body and equal-length shadows. This is different from the white (green) spinning top, as its body indicates a lower closing price. Traders analyse its context, technical factors, and confirmation from other indicators to interpret its significance.
What Is a Spinning Top Candlestick?
A spinning top candle meaning refers to a pattern characterised by a small body and long upper and lower shadows of roughly equal length. It reflects market indecision, where neither buyers nor sellers hold a clear advantage, and is often used in technical analysis to assess potential trend reversals or consolidations.
Is the Spinning Top Bullish or Bearish?
The spinning top candlestick pattern is neutral by nature. Its significance depends on the context within the price chart. When it appears at the end of an uptrend, it may signal a bearish sentiment, while at the end of a downtrend, it can indicate a potential bullish reversal.
What Does a Spinning Top Candle Indicate?
This pattern indicates a period of indecision and balance between buying and selling pressure. Depending on its position within a trend, it can signal consolidation, continuation, or a reversal in price direction.
What Is the Spinning Top Rule?
There is no fixed "rule" for spinning top trading. Traders typically look for confirmation from subsequent price movements or other technical indicators to decide on a course of action.
Is Spinning Top a Doji?
Although similar, spinning tops and doji candles differ. A spinning top has a small body with visible discrepancies between opening and closing prices, whereas a doji’s body is almost non-existent.
Trade on TradingView with FXOpen. Consider opening an account and access over 700 markets with tight spreads from 0.0 pips and low commissions from $1.50 per lot.
This article represents the opinion of the Companies operating under the FXOpen brand only. It is not to be construed as an offer, solicitation, or recommendation with respect to products and services provided by the Companies operating under the FXOpen brand, nor is it to be considered financial advice.

The Three Black Crows Pattern: Trading PrinciplesThe Three Black Crows Pattern: Trading Principles
Various candlestick and chart patterns indicate potential market reversals. One such formation is the three black crows pattern that indicates a potential bearish reversal in the price of an asset. You can find three black crows stock, commodity, and forex patterns. This FXOpen article will help you understand how such a pattern is formed, explaining how it can be used to spot trading opportunities in the market and demonstrating live trading examples.
What Are the Three Black Crows?
The three black crows is a bearish candlestick pattern used in technical analysis to signal a potential reversal of an uptrend. It consists of three consecutive long bearish candlesticks that occur after a strong upward trend. The pattern suggests that the momentum has shifted from buyers to sellers, indicating that a downtrend could be about to begin.
Key Characteristics:
- Three Consecutive Bearish Candles: The pattern is composed of three long bearish candlesticks that open within the body of the previous candle and close near their lows.
- Appears After an Uptrend: The pattern typically forms after a prolonged uptrend, signalling a potential shift in market sentiment.
- Declining Price with Minimal Wicks: The candles should ideally have small upper and lower wicks, showing that the sellers controlled the market throughout the session.
- Steady Decline: Each candlestick in the pattern opens higher than the previous candle’s close but then reverses to close lower.
Psychological Interpretation
The pattern reflects a growing bearish sentiment among traders. Each successive bearish candlestick suggests that sellers are taking over, and buying pressure is weakening. This gradual increase in selling activity is often interpreted as a sign that the market could be heading for a downturn.
How Can You Trade the Three Black Crows Chart Pattern?
The three black crows formation has general trading rules. They can be modified depending on the timeframe, market volatility, and risk tolerance.
Entry
Once the formation is confirmed with the third long red candle and additional indicators, traders enter a short position below its low.
Take Profit
The pattern doesn’t provide specific take-profit targets. Usually, traders use other technical indicators and strong support levels to determine a suitable take-profit point. Some traders set the take-profit order with regard to the risk-reward ratio, say 1:2 or 1:3.
Stop Loss
The theory states that a stop-loss order can be placed above the first candlestick’s high to potentially limit losses. Moreover, it should be based on the trader's risk tolerance and trading approach.
Live Market Example
The above example shows the formation of the three black crows’ pattern on a weekly chart of the EUR/USD pair. When the pattern formed, the relative strength index had just left the overbought zone, confirming a potential trend reversal. A trader could go short after the third long bearish candle at 1.42550 and place a stop loss near above the first pattern’s candle (at 1.51763). The profit target could be set at the next important support level of 1.23378. It took six months for the price to reach the target level.
Practical Trading Strategies Using the Three Black Crows Pattern
Now, let’s look at two specific 3 black crows trading strategies.
MACD Strategy
The combination of the three black crows candlestick pattern and the MACD crossover offers traders a strong signal of a bearish reversal after a bullish movement. The three black crows formation suggests weakening bullish momentum, while the MACD crossover confirms the shift in momentum from buyers to sellers. Together, these indicators increase the likelihood of a sustained downtrend, offering an opportunity for traders to enter the market with greater confidence.
Entry
- Traders observe a bearish MACD crossover within a few candles of the three black crows, either just before, during, or just after.
- Both conditions (pattern completion and MACD crossover) are typically met by the close of the third candle, signalling a potential opportunity for a sell trade.
Stop Loss
- Stop losses might be placed just beyond the swing point before the three black crows pattern to potentially protect against false signals.
Take Profit
- Traders often set take-profit targets at a risk-reward ratio, such as 1:2 or 1:3, to lock in potential returns.
- Alternatively, profits might be taken at key support levels where the price may reverse.
- Another option might be to exit the trade upon observing a bullish MACD crossover, signalling the end of the downtrend.
HMA Strategy
Using two hull moving averages (HMA), one set to 20 and the other to 50, provides traders with an extra filter to confirm that a downtrend is beginning following the three black crows pattern. The three black crows indicate a potential bearish reversal, but a cross of the 20-period HMA below the 50-period HMA helps confirm the strength of the downtrend. HMAs are used as they are more responsive to trend shifts than other moving averages.
Entry
- Traders look for a bearish crossover where the 20 HMA crosses below the 50 HMA within a few candles of the three black crows.
- Both the pattern and the HMA crossover typically confirm the start of a downtrend, allowing traders to enter a short position.
Stop Loss
- Stop losses might be set just above the swing high before the pattern.
- Alternatively, they might be placed above one of the HMAs, depending on the trader’s risk tolerance and desired level of protection.
Take Profit
- Take-profit targets might be based on a risk-reward ratio, such as 1:2 or 1:3.
- Traders may also take profits at a known support level where price reversal is likely.
- Another potential exit point is when the HMAs cross over again, signalling the end of the trend.
Three Black Crows vs Three White Soldiers
The three white soldiers candlestick pattern is the opposite of the three black crows. It is a bullish reversal setup that traders commonly use to identify the potential end of a prior downtrend and the start of an uptrend. It consists of three consecutive long bullish candlesticks with highs and lows higher than the previous ones and with little or no wicks. It suggests that the buyers have taken control of the market and that the price will likely continue rising. The candles together create a formation that resembles three soldiers marching in a bullish direction.
This formation is usually considered a strong bullish signal when it appears after a prolonged downtrend, in contrast to the three black crows formation, which indicates a strong potential bearish reversal. Traders often use it as an indication to enter long positions, with a stop-loss order placed near the bottom of the pattern.
Confirmation Tools
Confirmation tools can help traders ensure that the 3 black crows candlestick pattern signals a true bearish reversal rather than a short-term pullback. Here are some key tools to consider when confirming the pattern:
- Volume Increase: A spike in selling volume during the formation of the three black crows can confirm heightened pressure and a stronger likelihood of a trend reversal.
- Momentum Indicators: Tools like the Relative Strength Index (RSI), MACD, or a Stochastic Oscillator can show a shift in momentum. An overbought RSI, a bearish MACD crossover, or bearish Stochastic divergence may reinforce the bearish signal.
- Support Level Break: Watch for a break below a key support level after the three black crows form. This can further validate the downtrend, indicating that sellers are gaining control.
- Bearish Candlestick Patterns: Additional bearish patterns, such as engulfing or dark cloud cover, emerging after the three black crows, can reinforce the likelihood of a sustained downtrend.
- Moving Averages: A cross of a short-term MA below a long-term MA can offer further confirmation of a bearish reversal.
Common Mistakes When Trading the Three Black Crows Pattern
In 3 black crows trading, it's common to make several mistakes that may lead to poor results or false signals. Here are key pitfalls to watch out for:
- Ignoring Volume: Failing to check for a rise in volume during the formation of the three black crows can lead to misinterpreting the pattern. Low volume may indicate weak selling pressure and an unreliable signal.
- Trading Without Confirmation: Jumping into a trade as soon as the pattern forms without using additional confirmation tools like momentum indicators or support breaks can increase the risk of a false reversal.
- Overlooking Market Context: The three crows candlestick pattern works in specific conditions. If the pattern appears in a sideways or range-bound market, it may not signal a true trend reversal, leading to misinterpretation.
- Setting Tight Stop-Losses: Placing stop-loss orders too close to the first candlestick’s high can result in early exit due to market noise. Proper risk management with room for fluctuations is essential.
- Neglecting Trend Strength: Ignoring the strength of the prior uptrend may lead to premature trades. The pattern is believed to be the most effective after a prolonged uptrend; using it in weak trends can result in false signals.
Final Thoughts
The three black crows pattern is a powerful bearish reversal signal that can help traders identify potential downtrends after a sustained uptrend. By understanding its formation, confirming the pattern with additional technical indicators, and implementing sound risk management strategies, traders can incorporate this pattern into their trading plans. However, as with any trading strategy, patience and proper confirmation are key to avoiding false signals.
Once you have practised identifying the black crows, consider opening an FXOpen account to start your trading journey!
FAQ
What Do 3 Black Crows Mean in Trading?
The 3 black crows’ meaning refers to a candlestick pattern signalling a bearish reversal. It consists of three consecutive long bearish candlesticks following an uptrend, indicating that sellers are taking control of the market. This pattern suggests a potential shift in momentum from bullish to bearish, meaning the price is likely to decline further as selling pressure increases.
What Do Three Black Crows Indicate?
The 3 black crows’ candlestick formation, after a prolonged uptrend, indicates a potential downside reversal. It means that sellers are taking control, and the price will likely trade downwards.
What Is the Success Rate of the 3 Black Crows?
The success rate of the three black crows pattern varies depending on market conditions, timeframe, and confirmation tools used. While it is generally considered a reliable bearish reversal signal, traders often use volume, momentum indicators, and support level breaks to confirm the pattern and improve success rates.
What Is the Meaning of Identical Three Crows?
The identical three crows is a variation of the traditional pattern. In this case, the three bearish candles open at the close of the previous candlestick, showing even stronger bearish pressure. This variation suggests that sellers are overwhelming buyers consistently, signalling an even more pronounced reversal.
How Do You Trade Three Black Crows?
To trade the 3 black crows pattern, traders wait for confirmation of a bearish reversal after the three consecutive down candles in an uptrend. They enter a short position once the pattern is completed and confirmed by additional indicators like increased volume or a break below support. They may place a stop-loss order above the high of the first candle and target key support levels below for profit-taking. Traders always manage risk carefully by using stop-losses and monitoring market conditions.
Are Three Black Crows Bullish?
No, the three black crows pattern is not bullish; it is a bearish candlestick pattern. It signals a potential reversal from an uptrend to a downtrend, indicating that selling pressure is starting to overwhelm buying pressure.
Trade on TradingView with FXOpen. Consider opening an account and access over 700 markets with tight spreads from 0.0 pips and low commissions from $1.50 per lot.
This article represents the opinion of the Companies operating under the FXOpen brand only. It is not to be construed as an offer, solicitation, or recommendation with respect to products and services provided by the Companies operating under the FXOpen brand, nor is it to be considered financial advice.

Shooting Star Pattern: Meaning and Trading RulesShooting Star Pattern: Meaning and Trading Rules
In the fast-paced world of trading, recognising key chart patterns is crucial for informed decision-making. One pattern that traders often look for is the shooting star trading pattern. This article will delve into what a shooting star pattern is, how to spot it on a chart, its associated trading strategies, and its distinctions from similar patterns.
What Is a Shooting Star?
A shooting star in trading is a bearish candlestick pattern that can signify a potential reversal of an uptrend. It consists of a single candlestick with the following characteristics:
- A small body that is located at the lower end of the candlestick.
- A long upper shadow that is at least twice the length of the candle's body.
- A short or nonexistent lower shadow.
The appearance of the setup suggests that the price opened near its low and rallied significantly during the trading session but ultimately closed near its opening price. This pattern indicates sellers regained control after a brief period of bullishness.
While the formation is considered more probable when it closes red, it’s possible to see a green shooting star. A green shooting star candlestick simply indicates that sellers weren’t able to push the price down quite as aggressively.
How Can You Trade the Shooting Star?
The shooting star trading strategy involves the following key points:
- Entry: After identifying the candle in the strong uptrend, consider entering a short position. To validate the pattern, you may wait for the next one or two candles to close below the shooting star.
- Take Profit: Although candlestick patterns don’t provide specific entry and exit points, you can use common technical analysis techniques. For example, you may set a take-profit level based on the support level, Fibonacci retracement level, or nearest swing lows.
- Stop Loss: You may want to protect your position with a stop-loss order. This is usually placed above the high price of the shooting star. This helps potentially limit losses if the pattern doesn't lead to a reversal.
Let's consider a live market example of a shooting star in the stock market to illustrate the concept. A trader analyses the Meta stock chart and spots a shooting star stock pattern after an extended uptrend. They wait for confirmation, i.e. for the next bar to close lower. Upon confirmation, they decide to enter a short trade, setting their take-profit target at a significant support level and placing a stop loss above the formation’s high.
How Traders Confirm the Shooting Star Signals
Confirming the shooting star pattern's reliability involves a multifaceted approach, adding robustness to your trading decisions. Traders look beyond the candlestick itself, integrating various technical analysis tools to validate signals.
Key confirmation methods include:
- Volume Analysis: A high trading volume accompanying the shooting star candlestick pattern can strengthen the signal, indicating that the reversal is supported by significant market participation.
- Subsequent Candles: Observing the next few candles for bearish confirmation is essential. A strong bearish candle following the shooting star suggests that sellers are gaining momentum.
- Technical Indicators: Indicators can offer confirmatory signals, particularly momentum indicators like the Relative Strength Index (RSI) and Stochastic Oscillator. A moving average crossover can also add confluence.
- Support and Resistance Levels: The proximity of the shooting star to established resistance levels enhances its significance. A shooting star forming near a resistance zone often signals a strong reversal point.
- Above Swing High/Low: A shooting star pattern that breaks into the area just above a key high or low before reversing can signal a stop hunt/liquidity grab.
- Contextual Analysis: The broader market context, such as prevailing trends and economic news, can influence the pattern's effectiveness. Aligning the shooting star with broader market sentiment increases the pattern’s reliability.
Shooting Star and Other Candlestick Formations
Let's compare the shooting star with other patterns with which it is often confused.
Shooting Star vs Inverted Hammer
The shooting star and inverted hammer look similar – they have small bodies and long upper shadows. However, they differ in their implications. The former is a bearish reversal pattern found in uptrends, while the latter is a bullish reversal formation seen in downtrends.
Shooting Star vs Evening Star
Both formations signal an uptrend reversal; however, the shooting star is a single-candle setup, whereas the evening star consists of three candles, including a large bullish candle, a small-bodied candle, and a large bearish candle.
Shooting Star vs Gravestone Doji
The shooting star and gravestone doji are both bearish reversal patterns. The shooting star features a small body at the lower end of the candlestick with a long upper shadow, signifying a failed rally.
In contrast, the gravestone doji has no or a tiny real body, as the open and close prices are identical or nearly identical, with a long upper shadow and no lower shadow. The gravestone doji suggests strong indecision in the market, with buyers initially driving prices up but ultimately failing to maintain that momentum, which often signals a sharp reversal.
Shooting Star vs Hanging Man
The shooting star and hanging man also share similarities but differ in appearance and market positioning. The shooting star is a bearish pattern occurring after an uptrend, indicating a potential reversal as bears managed to pull the price down at the end of a trading session.
Conversely, the hanging man appears at the top of an uptrend as well but has a small body at the upper end and a long lower shadow, reflecting that sellers were able to push the price down significantly before buyers pulled it back up. The hanging man suggests that selling pressure is starting to outweigh buying interest.
Advantages and Limitations
This formation offers traders valuable insights, but it comes with its own set of advantages and limitations. Understanding these can help traders use the pattern more effectively within their strategies.
Advantages
- Early Reversal Signal: It provides an early indication of a potential trend reversal, allowing traders to prepare for or act on a change in market direction.
- Simplicity: The pattern is straightforward to identify, even for less experienced traders, making it an accessible tool for technical analysis.
- Versatility: It can be applied across various markets and timeframes, with traders often spotting the shooting star in forex, stock, and commodity markets as well as across both short-term and long-term charts.
Limitations
- False Signals: The pattern alone is not always reliable and can generate false signals, especially in volatile markets or when not used with other confirmation tools.
- Lack of Precision: It does not provide exact entry or exit points, requiring traders to rely on additional indicators or analysis to determine these.
- Dependency on Context: The effectiveness of the formation is highly dependent on the broader market context and trend strength, limiting its standalone use.
Final Thoughts
Understanding chart patterns like the shooting star is essential for making informed decisions in trading. Remember that while this formation can provide valuable insights, it is more effective in conjunction with other tools for signal confirmation. As a trader, staying informed about market developments and continuously honing your skills could be a key to effective trading in the dynamic trading environment. Open an FXOpen account today to trade in over 600 markets with tight spreads from 0.0 pips.
FAQ
Can Candlestick Patterns Be Time-Sensitive?
Yes, candlestick patterns vary depending on the timeframe. A shooting star on a 1-minute chart provides short-term signals, while a shooting star on a daily chart may signal a longer-term reversal. However, the choice of timeframe goes hand in hand with your market strategy and goals.
How to Improve Candlestick Pattern Recognition Skills?
Improving your candlestick pattern recognition skills requires practice and study. You can analyse historical charts, use trading simulators, read educational materials like those at FXOpen, and engage with experienced traders to gain insights and practical experience.
Why Are Candlestick Patterns Important in Trading?
Candlesticks visually represent price action and help traders identify potential trend reversals, continuations, and key support and resistance levels. They are valuable tools for technical analysis.
What Is the Meaning of a Shooting Star Pattern?
The shooting star pattern is a bearish reversal candlestick that forms after an uptrend. It signals a potential shift in market sentiment, where buyers initially drive the price higher, but sellers take over, pushing the price back down near its opening level.
Is a Shooting Star Candlestick Bullish?
No, a bullish shooting star does not exist. It is a bearish pattern, indicating that an uptrend may be losing momentum and that a reversal to the downside could be imminent. A similar bullish formation is the inverted hammer.
Is a Shooting Star a Doji?
A shooting star is not a doji. While both patterns can signal reversals, a doji has nearly identical opening and closing prices with no significant body, reflecting indecision, whereas a shooting star has a small body with a long upper shadow, indicating a failed rally.
How Can You Trade a Shooting Star Candle?
Trading this candle involves looking for confirmation of the reversal, such as a bearish candle following the pattern. Traders often set stop-loss orders above the shooting star's high and target profit levels near key support zones or previous lows.
Trade on TradingView with FXOpen. Consider opening an account and access over 700 markets with tight spreads from 0.0 pips and low commissions from $1.50 per lot.
This article represents the opinion of the Companies operating under the FXOpen brand only. It is not to be construed as an offer, solicitation, or recommendation with respect to products and services provided by the Companies operating under the FXOpen brand, nor is it to be considered financial advice.

How Do Traders Spot and Use the Dragonfly Doji CandlestickHow Do Traders Spot and Use the Dragonfly Doji Candlestick Pattern?
The dragonfly doji candlestick pattern holds intrigue and fascination for traders in financial markets. Its distinct shape and positioning on price charts make it a keen subject for observation and analysis. In this article, we will explore this setup, its significance, and how traders use it in their trading strategies.
What Does a Dragonfly Doji Mean?
The red or green dragonfly doji is a candlestick pattern that forms when the opening, closing, and high prices of an asset are equal or almost equal. This formation resembles the shape of a dragonfly because it has an extended lower shadow. It provides bullish signals and is considered a neutral pattern as it provides continuation and reversal signals, depending on its context within a trend. The meaning of a dragonfly doji is that there is uncertainty in the market, and traders are prompted to carefully analyse other factors before making trading decisions.
Traders may find the dragonfly doji pattern on charts of different financial instruments, such as currencies, stocks, cryptocurrencies*, ETFs, and indices, regardless of the timeframe. Test this pattern on various assets with FXOpen’s TickTrader platform.
The Psychology Behind the Dragonfly Doji
The dragonfly doji candle pattern reflects a tug-of-war between buyers and sellers, where neither side gains a decisive advantage. Its formation indicates that sellers initially push prices lower, but buyers step in to push prices back up to the opening level. This results in the distinct long lower shadow and minimal upper shadow.
The psychological meaning of the dragonfly candlestick pattern is significant; it shows that despite bearish pressure, buyers are strong enough to regain control by the close. It signals indecision, highlighting the need for traders to carefully evaluate other indicators and the broader trend before making trading decisions.
How Can You Trade the Dragonfly Doji?
The bullish dragonfly doji provides valuable information about market sentiment. Here are two scenarios where this formation can be significant:
The Dragonfly Doji in an Uptrend
In a bullish trend, the dragonfly doji is generally seen as a continuation signal. This is because, despite sellers attempting to push the price lower, buyers remain active and prevent a significant decline. However, it is worth noting that the inability of buyers to push the price above its open level may indicate a potential weakening of bullish momentum. Traders may consider entering the trade above the open/close of the doji’s candle or if the proceeding bar closes above the doji’s open/close. The stop-loss level may be placed below the candlesticks, while the take-profit target may be set at the nearest resistance level.
In the chart above, the pattern formed in an uptrend, and the trader placed a long trade on the next bar. The stop loss was set below the candle, with the take profit at the closest resistance level.
Dragonfly Doji in a Downtrend
The dragonfly doji in bearish trends may suggest a possible upward reversal. The long lower shadow indicates that buyers entered the market, pushing the price up from its lows. This could be seen as a signal to consider going long or watching for a further bullish confirmation before taking action. Traders may place a stop loss below the candle with a take profit at the closest resistance level or may consider the appropriate risk/reward ratio.
The candle at the end of a downtrend signals a price reversal. The trader placed a buy order at the high of the doji with a stop-loss level below it. The take profit is calculated based on the risk/reward ratio.
Traders can enhance their trading strategies by utilising the free TickTrader trading platform.
How Can You Confirm the Dragonfly Doji?
Confirming the dragonfly doji may increase the reliability of trading decisions. Here are key factors to consider:
- Volume Analysis: High trading volume during the formation of a dragonfly candle may indicate stronger market sentiment and increase the likelihood of a significant move.
- Subsequent Candlesticks: Traders look for a bullish candlestick following the dragonfly candlestick. This reinforces the potential for a trend reversal or continuation.
- Support and Resistance Levels: A formation occurring near significant support levels can strengthen its validity as a potential reversal signal.
- Technical Indicators: To gauge momentum and confirm signals, traders often complement the analysis with indicators like the Relative Strength Index (RSI), moving averages, and Bollinger Bands.
- Market Context: It’s best to evaluate the broader market trend and news that may impact market sentiment to provide a clearer picture of its implications.
Dragonfly and Other Patterns
Dragonfly doji, gravestone doji, spinning top, and long-legged doji are all types of candlestick patterns commonly used in technical analysis to indicate potential reversals or indecision in the market. Traders often pay close attention to them when making trading decisions.
Dragonfly Doji vs Gravestone Doji
While the dragonfly doji has a long lower shadow and little or non-existent upper one, the gravestone or inverted dragonfly doji has a long upper wick and little or non-existent lower one. Both patterns indicate indecision, but the dragonfly provides bullish signals, whereas the gravestone indicates potential bearish reversals.
Dragonfly Doji vs Long-Legged Doji
The dragonfly has a long lower shadow with little to no upper shadow, indicating a potential bullish reversal. In contrast, the long-legged version has long upper and lower shadows, reflecting significant indecision and equal pressure from buyers and sellers without a clear directional bias.
Dragonfly Doji vs Hammer
The dragonfly and the hammer both signal potential bullish reversals, but they differ in appearance and context. The dragonfly has no upper shadow, but it has a very small body and an extended lower shadow, while the hammer has a body at the top of the candlestick and a long lower shadow. The hammer typically appears after a downtrend, signalling a reversal, while the dragonfly doji appears in uptrends and downtrends.
Limitations of the Dragonfly Doji
While the dragonfly doji is a valuable candlestick formation for traders, it is not without its limitations. Recognising these constraints can help them understand how to use it most effectively.
- False Signals: The dragonfly sometimes produces false signals, leading traders to anticipate reversals that do not materialise.
- Market Context: Its effectiveness is heavily influenced by the broader market context. It may not be reliable in all situations, particularly in choppy or sideways assets.
- Confirmation Needed: Additional indicators or subsequent price action are usually required to confirm the pattern, as relying solely on its appearance can be risky.
- Limited Power: It does not provide information on the magnitude of the subsequent price movement, making it challenging to set precise profit targets.
Closing Thoughts
Candlestick patterns should not be relied upon as the sole factor in trading decisions. It is essential to perform a comprehensive analysis and implement robust risk management strategies before making any trades. Once you are confident in your analysis, consider opening an FXOpen account to take advantage of spreads as tight as 0.0 pips and commissions starting at just $1.50.
FAQ
What Does Doji Candle Mean?
A doji candle represents a session where the opening and closing prices are almost equal, indicating market indecision. It suggests neither buyers nor sellers are in control, resulting in a standoff. Doji candles can take various forms, including dragonfly, gravestone, and long-legged, each with unique implications.
What Does a Dragonfly Doji Indicate?
A dragonfly doji indicates indecision and potential trend reversal. It forms when the open, high, and close prices are near the same level but it has a long lower shadow. This formation suggests buyers counteracted initial selling pressure, signalling a possible bullish shift.
Is the Dragonfly Doji Bullish or Bearish?
The dragonfly is generally considered bullish, especially after a downtrend. Its formation indicates buyers pushed prices back to the opening level, potentially leading to a price increase.
What Is the Opposite of the Dragonfly Doji?
The opposite of the dragonfly doji is the gravestone doji. The dragonfly has a long lower shadow and little to no upper shadow, while the gravestone features a long upper shadow and minimal lower shadow, indicating a potential bearish reversal.
*Important: At FXOpen UK, Cryptocurrency trading via CFDs is only available to our Professional clients. They are not available for trading by Retail clients. To find out more information about how this may affect you, please get in touch with our team.
Trade on TradingView with FXOpen. Consider opening an account and access over 700 markets with tight spreads from 0.0 pips and low commissions from $1.50 per lot.
This article represents the opinion of the Companies operating under the FXOpen brand only. It is not to be construed as an offer, solicitation, or recommendation with respect to products and services provided by the Companies operating under the FXOpen brand, nor is it to be considered financial advice.

Three Outside Up and Down Candlestick PatternsThree Outside Up and Down Candlestick Patterns: How to Identify and Trade Them
The three outside up and three outside down candlestick patterns offer traders a powerful way to analyse potential market reversals. Formed by 3 consecutive candlesticks they can signal key shifts in market sentiment, providing valuable insights into future price movements. In this article, we’ll break down how traders identify, trade, and confirm these patterns.
What Are the Three Outside Up and Down Patterns?
The three outside candlestick patterns are powerful tools in technical analysis that can help traders analyse potential market reversals. These patterns are made up of three consecutive candlesticks that reveal shifts in market sentiment. There are two variations: the three outside up and three outside down formations, each signalling opposite directions.
In a three outside up pattern, the first candle is a small bearish one, followed by a second, larger bullish candle that completely engulfs the first. The third candle is another bullish one, confirming the momentum shift toward a potential upward trend. This type typically forms after a downtrend, hinting that the market could be turning bullish.
On the flip side, the three outside down candlestick pattern starts with a small bullish candle. The second candle is a larger bearish one that engulfs the first, and the third is another bearish bar, signalling that sellers are gaining control. This formation usually appears after an uptrend and suggests a possible bearish reversal.
Three outside candle patterns are particularly useful because they provide multiple points of confirmation—first, the engulfing candle, and then the third which further solidifies the trend. They often appear on various asset classes, from stocks to forex, and can be a valuable part of a trader's analysis.
The Psychology Behind The Three Outside Patterns
Understanding the psychology driving these patterns can give traders better insight into market dynamics. With the three outside up candlestick pattern, the initial small bearish candle shows hesitation, but the large bullish candle that follows reflects a surge in buyer confidence. The final bullish candle confirms that buyers have taken control, possibly signalling a shift from bearish to bullish sentiment.
In contrast, the three outside down reflects a change from bullish optimism to bearish caution. The first candle shows a continuation of buying pressure, but the second, larger bearish bar reveals that sellers are stepping in with strength. The third bearish candle reinforces this shift in market sentiment.
Identification Steps
Identifying the three outside candle patterns is straightforward once you know what to look for. The key is focusing on the structure and order of the three candlesticks.
Want to have a go at spotting the formation for yourself? Head over to FXOpen to access hundreds of real-time charts.
Three Outside Up Pattern
- First Candle: This is a small bearish candlestick that occurs within a downtrend. It suggests that the market still favours sellers, but it’s weak.
- Second Candle: The crucial point of the formation. The second candle is a much larger bullish one that engulfs the entire body of the first one.
- Third Candle: Another bullish candle that confirms the pattern. Its close is above the second’s close, solidifying the upward momentum.
Three Outside Down Pattern
- First Candle: This is a small bullish candle within an uptrend, reflecting weaker buying interest.
- Second Candle: The key feature. A larger bearish bar fully engulfs the first one.
- Third Candle: A second bearish candle follows, closing lower than the second and reinforcing the shift in sentiment toward selling pressure.
Other Considerations
- Engulfing Candle Size: The bigger the second candle in relation to the first, the stronger the signal. It indicates a more decisive shift in market sentiment.
- Timeframe: They can appear across various timeframes, but they're expected to be more reliable on longer ones, such as daily or weekly charts. Lower timeframes can lead to wrong trade decisions.
- Context: While the formation itself is important, it’s key to consider the broader market environment. Combining it with other forms of analysis, like trendlines or indicators, can increase the reliability of your trade decisions.
Three Outside Candle Pattern: a Trading Strategy
Trading the three outside up and three outside down patterns requires understanding both how to spot the signal and how to manage the trade. Here’s a step-by-step approach to using these patterns in real-world scenarios.
Entering a Trade
For both types, traders typically wait for the close of the third candle to confirm the pattern before making any moves. For the three outside up, a trader may analyse the close of the third bullish bar as confirmation of potential upward momentum. In contrast, for the three outside down, the third bearish candle indicates potential downward momentum.
It’s common to enter trades at the open of the next candlestick, following the pattern, but waiting for a slight pullback or additional confirmation from another technical indicator (e.g., RSI or moving averages) is also a prudent strategy.
Stop Loss Placement
To potentially manage risk, traders often place stop losses at strategic points on the chart. In the case of a three outside up, it’s typical to place a stop loss just below the low of the engulfing (second) candle. This allows some breathing room but potentially protects against the risk of a reversal.
For the three outside down, a stop loss is commonly set just above the high of the engulfing candlestick.
Take Profit Strategy
Setting a take-profit target usually involves identifying potential resistance or support levels. For a three outside up, traders often target the next key resistance level. It’s also common to use a risk-reward ratio of 1:2 or higher, ensuring that the potential returns justify the risk taken.
In the case of a three outside down pattern, traders aim for the next support level as a potential area to take returns. Again, maintaining a favourable risk-reward ratio is crucial in preserving long-term trades.
How Traders Confirm Three Outside Candlestick Patterns
Confirming the three outside up and three outside down patterns is crucial for potentially avoiding false signals and increasing the reliability of your analysis. While the formation can signal a potential reversal, using additional tools to verify the move can help traders make more accurate decisions.
Here are a few ways traders typically confirm the pattern:
- Momentum Indicators: Traders often use momentum tools like the relative strength index, moving average convergence divergence, or stochastic oscillator to gauge whether the pattern aligns with market momentum. If these indicators show overbought or oversold conditions, it can confirm the strength of the signal.
- Volume Analysis: An increase in volume on the second and third candlesticks adds weight to the analysis, suggesting that more market participants are involved in the move. Higher volume often indicates stronger conviction behind the shift.
- Trendlines and Moving Averages: Many traders use trendlines or moving averages to confirm the pattern’s validity. For a three outside up, a breakout above a downtrend line or crossing above a key moving average reinforces the bullish signal. For a three outside down, a break below a trendline or drop under a moving average strengthens the bearish case.
Common Mistakes to Avoid
While these patterns can provide useful insights, there are common mistakes traders make when using them. Understanding them can help improve analysis and decision-making.
- Ignoring Volume: One of the key signs of a strong formation is the higher volume on the second and third candles. Without this, it may lack the strength needed to suggest a real market shift.
- Use in Isolation: Relying solely on the candlestick pattern without considering other indicators or market conditions often leads to misleading signals. It’s important to incorporate other technical tools to build a stronger case.
- Forcing the Pattern: Traders sometimes try to identify the pattern even when it doesn’t meet the criteria, leading to poor decisions. Both the engulfing and confirmation bars need to be clear and distinct for the formation to be valid.
- Overlooking Trend Context: They are more reliable when they occur after a clear uptrend or downtrend. Attempting to trade them in a range-bound market or against the prevailing trend can reduce their effectiveness.
The Bottom Line
The three outside patterns are valuable tools for identifying potential market reversals when combined with other technical analysis methods. In combination with sound risk management, these formations can offer traders a boost in their strategies.
To put what you’ve learned into practice across more than 700 markets, consider opening an FXOpen account. FXOpen offers several advanced trading platforms, low costs, and blazing-fast trade execution speeds designed to upgrade your trading experience.
FAQ
What Is the Pattern of Three Outside Candlesticks?
The three outside candlesticks pattern is a reversal formation made up of three consecutive candles. In the three outside up, a small bearish candle is followed by a larger bullish one that engulfs it. A third bullish candle confirms the upward move. The three outside down is the opposite, starting with a small bullish candlestick engulfed by a larger bearish one, with a final bearish candle confirming the potential downtrend.
What Happens After Three Outside Up?
After a three outside up, the market may experience a bullish reversal. The formation suggests that buyers are gaining momentum, and traders may see upward price movement following the confirmation of the third candle.
What Is the Success Rate of the Three Outside Up?
The success rate of the three outside up pattern varies depending on market conditions and timeframe. While it can be an effective reversal signal, it’s expected to be more reliable when combined with other indicators like volume or trendlines.
What Do Three Candlesticks Mean?
Three candlesticks refer to a specific pattern where three consecutive candles form a signal, often indicating potential reversals or trend confirmations in technical analysis.
What Is 3 Candlestick Strategy?
The 3 candlestick strategy involves identifying patterns like three outside up or three outside down, where 3 candles signal potential market reversals or continuations. It’s often used to analyse future price movements.
Trade on TradingView with FXOpen. Consider opening an account and access over 700 markets with tight spreads from 0.0 pips and low commissions from $1.50 per lot.
This article represents the opinion of the Companies operating under the FXOpen brand only. It is not to be construed as an offer, solicitation, or recommendation with respect to products and services provided by the Companies operating under the FXOpen brand, nor is it to be considered financial advice.

Nice Daily rejection on EurGbp Price rejects old daily strong Level 0.84234 . that level have been tested before and there was a strong rejection to the downside.
I'm not expecting the price to get to 0.84370. hence I'll be looking for sell opportunity to short EurGbp for the rest of the week except if there's any rejection amongst some daily poi below.
Please boost if you find this insightful 🫴

Top 3 Must-Know Candlestick Patterns for BeginnersGet your cup of coffee or tea ready we are doing a crash course on Candlesticks today
I’m walking you through three candlestick patterns every beginner trader should know—Doji, Engulfing Candles, and Hammers (including the Inverted Hammer). These patterns are super helpful when you’re trying to spot market reversals or continuations. I’ll show you how to easily recognize them and use them in your own trades. Let’s keep it simple and effective.
Key Takeaways:
Doji: Indicates indecision, potential reversals.
Engulfing Candles: Bullish or bearish reversal signals.
Hammer & Inverted Hammer: Bullish reversal after a downtrend.
Trade what you see and let’s get started!
Mindbloome Trader

A Practical Guide For Candlestick Patterns!Intraday trading is a method of investing in cryptocurrencies where the trader buys and sells cryptocurrencies on the same day without any open positions left by the end of the day. Intraday traders aim to either purchase a cryptocurrency at a low price and sell it at a higher price or short-sell a cryptocurrency at a high price and buy it at a lower price within the same day. This requires a good understanding of the market and relevant information to help them make the right decisions. In the cryptocurrency market, the price of a cryptocurrency is determined by its demand and supply, among other factors.
Tools such as candlestick chart patterns are very helpful to traders. We will discuss these candlestick charts and offer steps to help you read them.

Silver MatrixSilver has been in a downward pointing "shape" with a resistance on the top as a force pointing down, while being supported in a "cup" shaped support that can become resistance on the up if it is broken down.
The levels in this project are potential support/resistance zones in the future, where potential pivot points can occur (marked examples in the past). Similar candlestick patterns can also appear near the Big Thick rectangles which are Power Influence Zones, while the slim longer rectangles can direct potential pivot points or temporary consolidation support resistance levels. The smaller rectangles could turn out to be simple milestones in the path of the price.
The most important aspect of this project and approach is following the price action near the shapes which can trigger a pivot point signal or a continuation after a break and test.

JAGRAN - Swing trade opportunity 20 % ROI1)The stock is in uptrend in Monthly and weekly time frames.
2)It is in strong consolidation for about 6 months, the stock looks poised for an up move within the zone.
3)The consolidation is happening at 5 year old resistance zone.
4) The upside possible is confirmed through price action, supportive RSI.
Once the stock takes off 121 level, then one can look for 137, 150 for a Mid Term Target.

What is Tweezer Top and Bottom Patterns?Welcome to the world of trading patterns. If you appreciate our charts, give us a quick 💜💜
Today let's explore Tweezer top and bottom patterns, often referred to as simply "tweezers," are powerful candlestick formations that hold the potential to unveil significant shifts in market sentiment.
These patterns materialize as twin candles appearing at the culmination of a trend, indicating the impending transition of market dynamics. In this exploration, we'll delve into the intricacies of these patterns, unveiling their secrets for traders seeking to navigate the ever-evolving landscape of financial markets.
Tweezer Top:
A tweezer top pattern occurs during an uptrend when the price reaches a high point and then experiences a sudden reversal. It is characterized by two consecutive candlesticks with almost identical highs. The pattern suggests that the bulls are losing their grip, and a potential trend reversal or a bearish correction might follow.
Traders often interpret the tweezer top as a signal to consider selling or shorting an asset, especially if it appears after a prolonged uptrend. However, it's essential to confirm this pattern with other technical indicators or chart patterns to increase its reliability.
Tweezer Bottom:
Conversely, a tweezer bottom pattern emerges in a downtrend when the price reaches a low point and then reverses its direction. Similar to the tweezer top, tweezer bottoms consist of two consecutive candlesticks with nearly identical lows. This pattern signifies a potential end to the bearish trend, indicating that the bulls might take control soon.
Traders view the tweezer bottom as a signal to consider buying or going long on an asset, particularly if it appears after an extended downtrend. As with any trading pattern, it's crucial to validate the tweezer bottom with other technical tools to confirm the potential trend reversal.
Key Considerations:
Confirmation is Key: Tweezer patterns, while useful, should always be confirmed by other technical indicators or chart patterns before making trading decisions.
Volume Analysis: Analyzing trading volumes during the formation of tweezer patterns can provide additional confirmation of the potential trend reversal.
Market Context: Consider the overall market context and fundamental factors influencing the asset to make well-informed trading decisions.

Chart Patterns: Mastering Price Patterns for Successful TradesChart patterns are powerful tools that allow traders to anticipate market movements and make informed trading decisions. This trading idea focuses on mastering various price patterns to enhance trading proficiency. By gaining expertise in recognizing and interpreting chart patterns, traders can identify high-probability trade setups, optimize entry and exit points, and increase their chances of success in the market.
Objective:
The objective of this trading idea is to equip traders with a comprehensive understanding of different price patterns and their significance in technical analysis. By mastering these patterns, traders can effectively analyze market trends, identify potential reversals or continuations, and make well-timed trading decisions.
Key Components:
Introduction to Price Patterns:
Begin by understanding the fundamentals of price patterns and their importance in technical analysis. Learn about the types of patterns, including reversal patterns (such as head and shoulders, double tops/bottoms) and continuation patterns (such as flags, triangles, and rectangles). Gain insights into the characteristics and significance of each pattern in predicting future price movements.
Reversal Patterns:
Dive into studying popular reversal patterns that indicate potential trend reversals. Explore patterns such as head and shoulders, double tops/bottoms, and triple tops/bottoms. Understand how to identify these patterns, confirm their validity through volume analysis, and generate entry or exit signals. Analyze real-life examples to strengthen your pattern recognition skills.
Continuation Patterns:
Explore continuation patterns that suggest the resumption of existing trends. Study patterns like flags, triangles (ascending, descending, symmetrical), rectangles, and wedges. Learn how to interpret these patterns to validate trend direction, anticipate breakout or breakdown levels, and improve trade entries. Understand the importance of volume and other technical indicators in confirming continuation patterns.
Complex Patterns:
Delve into more advanced and complex patterns, such as the cup and handle, head and shoulders inverse, and ascending/descending triangles with multiple touches. Gain insights into the nuances of these patterns, their variations, and their potential impact on price movements. Understand how to incorporate these patterns into your trading strategies for enhanced accuracy.
Pattern Confirmation:
Learn techniques to confirm the validity of price patterns and reduce false signals. Explore additional tools and indicators such as trendlines, moving averages, Fibonacci retracements, and oscillators to validate and reinforce pattern signals. Understand the importance of multiple confirmations for higher-probability trades.
Trade Management and Risk Control:
Develop effective trade management techniques to maximize profits and minimize risks when trading price patterns. Learn how to set appropriate stop-loss levels based on pattern structures and support/resistance levels. Understand position sizing and risk-reward ratios to optimize risk management. Explore techniques for trailing stops and scaling out of positions to maximize gains.
Backtesting and Paper Trading:
Apply your knowledge by backtesting price patterns using historical market data. Utilize paper trading or demo accounts to practice trading based on your analysis without risking real capital. Evaluate the performance of your pattern-based strategies, identify strengths and weaknesses, and refine your trading approach.
By mastering price patterns and effectively utilizing them in your trading approach, you can significantly improve your trading outcomes. This trading idea aims to provide you with the knowledge and skills necessary to navigate the markets with greater precision, identify high-probability trade setups, and achieve consistent trading success.
Note: Trading carries a level of risk, and past performance is not indicative of future results. It is important to conduct thorough research, practice proper risk management, and consider personal circumstances before making any trading decisions.

📊10 Candlestick Patterns You need To Know🔷 Bullish engulfing:
A candlestick pattern where a smaller bearish candle is followed by a larger bullish candle, indicating a potential reversal of a downtrend.
🔷 Bearish engulfing:
The opposite of a bullish engulfing pattern, where a smaller bullish candle is followed by a larger bearish candle, suggesting a potential reversal of an uptrend.
🔷Tweezer tops:
Two consecutive candlesticks with equal or near-equal high prices, indicating possible resistance and a potential reversal from an uptrend.
🔷Tweezer bottoms:
Similar to tweezer tops, but indicates support and a potential reversal from a downtrend.
🔷Bullish harami:
A bullish harami is a candlestick chart indicator used for spotting reversals in a bear trend. It is generally indicated by a small increase in price (signified by a white candle) that can be contained within the given equity's downward price movement (signified by black candles) from the past couple of days.
🔷Morning star:
A three-candle pattern consisting of a bearish candle, a small indecisive candle, and a bullish candle, indicating a potential reversal from a downtrend.
🔷Evening star:
The opposite of a morning star pattern, consisting of a bullish candle, a small indecisive candle, and a bearish candle, suggesting a potential reversal from an uptrend.
🔷Three white soldiers:
Three consecutive long bullish candles, typically seen as a strong bullish reversal pattern.
🔷Three black crows:
Three consecutive long bearish candles, often considered a bearish reversal pattern.
🔷Three inside up :
A bullish reversal pattern composed of a large down candle, a smaller up candle contained within the prior candle, and then another up candle that closes above the close of the second candle.
👤 @AlgoBuddy
📅 Daily Ideas about market update, psychology & indicators
❤️ If you appreciate our work, please like, comment and follow ❤️

ZM: Pre-Earnings Release RunZoom is showing a pre-earnings release run up out of its extreme low, ahead of its Q1 report today. The current run's pattern is indicative of professional traders swing trading with earnings strategies; they tend to take profits on the report since they bought at the low. While revenues are likely to come in below last quarter, earnings should improve over the big loss last quarter.
The stock has probably found its final low, at long-term support from 2020. ZM outperformed during the pandemic due to huge demand that was unsustainable and time limited. So it has a lot of work to do from here; it must reinvent to offer a greatly improved service to compete with huge companies like Google, etc. which all have very similar services.

🔋Candlestick Power📍Candlestick patterns are powerful tools used in technical analysis to analyze and predict price movements in financial markets, particularly in trading. They provide valuable insights into market sentiment and help traders make informed decisions. The open, close, and various components of a candlestick, such as the body and shadows, are crucial in determining whether it is bullish or bearish.
🔷A candlestick consists of a body and two shadows, also known as wicks or tails. The body represents the price range between the open and close of a trading period, while the shadows represent the high and low points reached during that period.
🔷A bullish candlestick occurs when the closing price is higher than the opening price, indicating buying pressure and market optimism. The body is typically filled or colored, indicating a bullish trend. The longer the body, the stronger the bullish sentiment. Shadows may exist above or below the body, and they represent the price range outside of the open and close. Long shadows indicate higher volatility during the trading period.
🔷A bearish candlestick forms when the closing price is lower than the opening price, reflecting selling pressure and market pessimism. The body is often empty or colored differently to indicate a bearish trend. Again, the length of the body provides information about the strength of the bearish sentiment. Shadows can be found above or below the body, representing the price range outside the open and close. Similar to bullish candles, long shadows suggest increased volatility.
Traders use different candlestick patterns and combinations to identify potential trend reversals, continuation patterns, or price consolidations. For example, a doji candlestick, where the open and close are very close or equal, signals indecision in the market and may precede a reversal. Engulfing patterns occur when one candle fully engulfs the body of the preceding candle, indicating a potential trend reversal. However, it is important to note that candlestick patterns should be used in conjunction with other technical indicators and fundamental analysis to confirm the validity of a potential trade signal.
👤 @AlgoBuddy
📅 Daily Ideas about market update, psychology & indicators
❤️ If you appreciate our work, please like, comment and follow ❤️

Relational Technical Analysis of GOOGLProfessional traders controlled this sideways pattern that held higher lows before the break to the upside and gap up above the W bottom completion resistance, which is now strong support. Short-term profit-taking at the resistance overhead is something to prepare for now.

EUR/USD: a detailed multi-timeframe examination of the pairHaving conducted a thorough MTF analysis of EUR/USD, the following observations could be made:
Weekly: as it can be inferred from the Weekly-timeframe chart, the price has been shooting wick candles and failing to break above the major resistance highlighted on the graph. The ongoing Weekly candle is looking massively bearish, and if we get to have a such impulsive closure, then the price might be experiencing a further decline. The 50% Fibonacci retracement level aligning with the price mark of 1.08 might be the next potential region the bearish rally is leading us towards.
Daily: zooming into the Daily-TF chart, we might observe that the price has penetrated through the ascending trendline with success. This add up to the list of confluences backing our bearish bias.
16H / 8H / 4H: finally, levelling down to lower-timeframe graphs, we can plot a probable entry region and have eyes on it for SELL executions. The area of 1.1 combines two confluences: the 50% Fibonacci retracement level derived from the recent impulse and the descending trendline pictured on the chart that connects two previous tops.
On the fundamental front, we have to keep eyes on the economic news - US Core Inflation Rate and PPI MoM - due later today and tomorrow.
