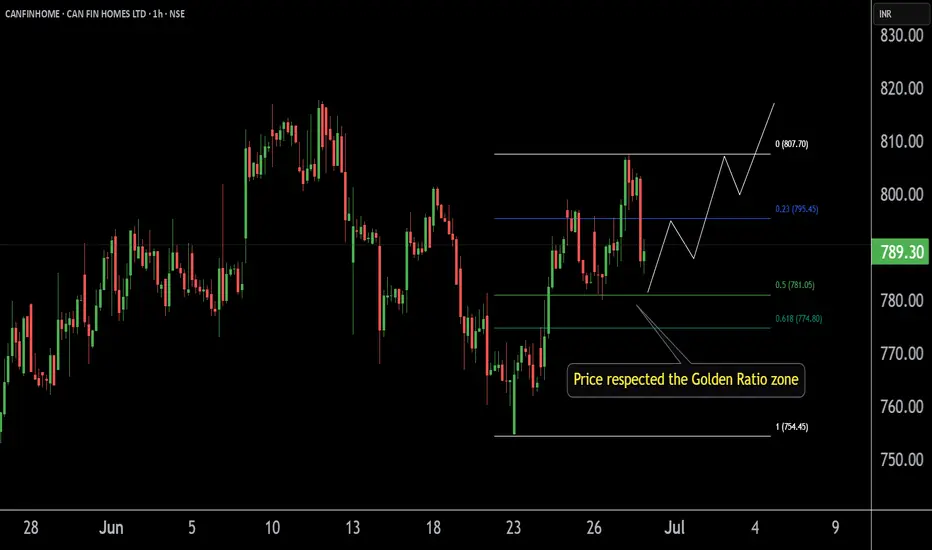
CANFINHOME'S Key ZoneThis is the 1 hour chart of CANFINHOME.
Canfinhome is taking support at the Fibonacci Golden Ratio zone.
If this zone is sustain then we may higher price in CANFINHOME .
Thank You !!
CANFINHOME
CANFINHOME (Future) : Setup for Primary Wave C Rally CANFIN Homes (CANFINHOME1!): Setup for Primary Wave C Rally
Wave Analysis:
Prices are nearing completion of Corrective Primary Wave C, with support identified at 776-763 INR.
A prior liquidity zone sweep below 805 INR suggests accumulation.
Key Observations:
Failed Breakout: Resistance at 805 INR led to a false breakout (Break of Structure).
Reversal Potential: Buyers could step in near 776-763 INR.
Trading Plan:
Entry:
First entry at the current price (805 INR).
Second entry near 776-763 INR (Wave C support).
Stop-Loss: Place stop-loss below 740 INR.
Target Levels:
First target: 870-900 INR (minor resistance).
Final target: 970-994 INR (completion of Wave C rally).
Indicators to Monitor:
Look for bullish divergence on RSI or MACD near support zones.
Watch for volume spikes signaling strong buying interest.
Disclaimer: This analysis is for educational purposes only. I am not a SEBI-registered analyst. Please do your own research or consult a financial advisor before trading.

weekly chart of CanfinhomeConsolidation for a long-time stock has given breakout 860 range tgt of 950-1000 levels for short to medium term.

Can fin home daily chart breakout @ 860 We can see 950-100 levels soon chart looking good for the short to medium term.

CANFIN Homes is ready to make a new highThis stock is trading with steady volumes on the bourses in all time frames.
Similarly, it shows positive divergence on oscillators.
The 52W H/L is INR 909.80 / 508.55.
It is consistently making Higher Highs and Higher Lows.
It honoured its support level.
LTP on NSE on 08/Feb/2024 was INR 813.30 (with a high of INR 857.80)
Resultantly after all this discussion, I believe that the target price should be INR 950-1,100.
Stop Loss should be INR 721
Risk to Reward will be 1:3
The time horizon should be 6-9 months

CANFIN Homes technical AnalysisThe stock has consolidated well at resistance level and looks set for a breakout. It has made a beautiful cup and handle pattern as well. Keep a stop below 690 and buy above 800 levels.
Disclaimer- Only for learning purpose.

My view on Canfinhome Canfinhome
Trendline breakout
Above 776.75
Tgt 780-785-790
Inverse Head & Shoulder pattern
Supporting it
Keeping on radar Canfinhome 800 CE Oct. Series cmp 19

My view on CanfinhomesCanfinhome Future forming inverse Head & Shoulder Pattern.
Looking tgt 590++ in very short term
Keeping on radar Canfinhome 580 CE


CANFINHOME LONG (INTRADAY DEC 5)Hello TradingView community and my followers, please if you like the ideas, don't forget to support them with likes and comments, thank you very much and here we go.
.
CANFINHOME
Daily : Stock is in uptrend.
15 min : It has made Aescending triangle..
*Wait for the breakout and we could see an upside movement.
THANK YOU !!!!

CANFINHOME LONG (INTRADAY NOV 23)Hello TradingView community and my followers, please if you like the ideas, don't forget to support them with likes and comments, thank you very much and here we go.
.
CANFINHOME
Daily : Stock is in uptrend and currently at higher low area and also making inside candle.
15 min : It has broken a trendline and it has also made Head and Shoulder pattern.
*Wait for the breakout and we could see an upside movement.
THANK YOU !!!!

CANFINHOME LONG (INTRADAY NOV 15)Hello TradingView community and my followers, please if you like the ideas, don't forget to support them with likes and comments, thank you very much and here we go.
.
CANFINHOME is in uptrend on daily also it has made "Bullish Inside Candle" and in 15 min it has made "Ascending triangle". On Breakout we could see upside momentum. Thank You !

CANFINHOME LONG (INTRADAY NOV 11)Hello TradingView community and my followers, please if you like the ideas, don't forget to support them with likes and comments, thank you very much and here we go.
.
CANFINHOME is in uptrend on daily and in 15 min it has made descending triangle pattern. Wait patiently and on breakout we could see upside movement.
Thank you !

Canfinhome in rangeCanfin home in range...
Expecting both side move....
Follow strict risk reward and stop loss if follow chart level
Thanks,
V Trade Point

CANFIN HOMES Positional upside viewMy positional view on NSE:CANFINHOME .
Breaks 470 resistance with high volume. My positional target will be 510 and 542.
My stop loss will be 450 only.
Note: This is my personal analysis, only for learning.

CANFINHOME may be BEARISH on Monday 13th Sep 2021 this week...
As per my analysis and thoughts i think this stock futures will be in BBEARISH mode on Monday 13th Sep 2021 all this weekend.

Can Fin Home is ready for Bull runHi All,
Can fin homes looks bullish on the charts.
There is a big bullish candle called marubozu candle which is signaling strength in the stock. Buy the stock at current levels and hold for big long term gains. The levels have been suggested in the charts. Keep stop loss on weekly closing basis.
**Ideas are my own** Invest as per your risk taking appetite**

R-0229 Cash Buy CANFINHOME @470.40-472.4 SL 463.5 TGT 486Intraday Cash Buy CANFINHOME @470.40-472.4 SL 463.5 TGT 486
TK cross over 466 + Resistance break out 462 which will act as support and next resistance is 508 + moving average and oscillator indicates STRONG BUY

R-0182 Cash Buy CANFINHOME @382.00-384.00 SL 369.90 TGT 408Short Term Cash Buy CANFINHOME @382.00-384.00 SL 369.90 TGT 408
Reason:
#1. TK cross over at 370
#2. MACD crossover at 372
#3. Above VWAP 380

CANFIN HOMES , Daily Analysis , Reversal Indication ?.* Price Was Trending Downwards And Making Lower Low's .
* Price Made Its 1st Higher Low And Brock Last Lower High . (First Indication )
* RSI Giving Positive Divergence With Price Action .( Second Indication )
* Last Day Candle Was A consolidated Candle . ( Indecisiveness of Buyer And Seller )
# I Am Expecting A Drop Around 290-275 (Fib 0.5-0.618) Zone .
Will Find Bullish Pattern There And Go Long For A Target Of 350.
# If It Did't Give A Drop And Brock 321 Level With Good Vol . Then Go Long For 350 Target .( For Aggressive Traders )
Buy On Drip Will A good Opportunity With A Good Risk Reward .
Happy Learning .

R-0072 Cash Buy CANFINHOME @376.00-378.5 SL 363 TGT 405Short Term Cash Buy CANFINHOME @376.00-378.5 SL 363 TGT 405
MACD indicates buy at CMP and TK cross over already at 360-365 so it looks bullish.


CANFINHOME Trend analysis moving upsideCanfinhome took strong support and now its moving upside as per the daily chart. we can see more upside from here or after small pull back.
