Aurora Cannabis (NYSE: ACB) The Mother of all contrarian tradesAurora Cannabis has been on a downward spiral driven by a combination of multiple factors including Cannabis 2.0 slow roll out in Canadian provinces, amounting debt, recent Bond conversion and further dilution of existing shareholders, departing executives and a market glut of oversupply. Well, basically all things that could go wrong have gone wrong for Aurora, making it a clear "Sell" case; that is if you own the stock, ha!!... For those investors waiting on the sidelines, this could be a great entry point for the stock. Aurora just relesaed today a corporate update outlining long term strategy growth plans. The report can be accessed here: www.prnewswire.com
Whats next?
Aurora is the only major cannabis player that has not inked a deal with a major player in the CPG space, others like Canopy Growth and Tilray have inked deals that are already priced into the stock, raising additional capital and giving investors relief. Nonetheless, Aurora has not only sufficient assets (excluding goodwill) to weather the coming months and gain strength as global sales resumes, the Canadian market opens up and further developments in the US unfold in 2020. In addition, ACB just bought a Hemp company that will allow them to enter the CBD US market.
In summary, this could be an interesting time to take a position in ACB and increase gradually as events unfold with significant upside as the stock bottoms. One analyst is giving it a price target of $0, but in my own view, when I hear such unrealistic opinions like this, most often coincides with bear markets coming to a bottom and about to turn making this a High Risk, High Reward trade and could be, the mother of all contrarian trades as we close 2019 and enter into the new year.
Do not take this as an investment advice and always do your own research before investing... always remember to place tight stops and risk manage every step of the way!!
Cannabisstocks
NYSE: ACB - Aurora Cannabis ShortSqueeze Coming!I have recently shared my views on NYSE: ACB Aurora Cannabis, now I wanted to comment on the latest price target of $0 and "Sell" rating from analyst Gordon Johnson from GLJ Research ... I let you make your own judgement, but this is the guy that called for a price target of $109 on Tesla when it was trading at $244.10 back in May 2,2018 .. that was a 64% downfall from the current price at the time!! ... similar to the aggressive price target of $0 he recently gave Aurora Cannabis!! ... Well you know the story on Tesla, as of this morning it was trading at $430!! far from the $109 price target he gave back then ... WATCH HIS INTERVIEW HERE: www.youtube.com
As it relates to Aurora, heres some interesting data points as it relates to Short Positions... they have decreased by 10% and % of short float now sits at 15%...
Short Interest Ratio (Days To Cover)
6.3
Short Percent of Float
15.44 %
Short % Increase / Decrease
-10 %
Short Interest (Shares Short)
155,950,000
Short Interest (Shares Short) - Prior
172,900,000
Is TNYBF trading in a Ascending Triangle?We've had the highest volume on the U.S side this year recently, along with the highest short on TNYBF on Dec 24th with 100% of the trades short, keep in mind it's not uncommon to see over 50% of TNYBF short, TNY on the CSE usually trades much higher volume, which is the Canadian ticker symbol.
Anyway, this recent move has put TNYBF over the MA50&200, and it also appears like we're trading in a Ascending Triangle.
Key Takeaways
The trendlines of a triangle need to run along at least two swing highs and two swing lows.
Ascending triangles are considered a continuation pattern, as the price will typically breakout of the triangle in the price direction prevailing before the triangle. Although, this won't always occur. A breakout in any direction is noteworthy.
A long trade is taken if the price breaks above the top of the pattern.
A short trade is taken if the price breaks below the lower trendline.
A stop loss is typically placed just outside the pattern on the opposite side from the breakout.
A profit target is calculated by taking the height of the triangle, at its thickest point, and adding or subtracting that to/from the breakout point.
ACB Inverted descending scallop Clear inverted descending scallop (inverted letter J). Low success rate in bull markets (11/52)
OH Bullish Divergence|Local Resistance|EMA Cross| Higher LowHello Traders – Merry Christmas!
Today’s chart update will be on CANNAROYALTY CORP OH where a valid bullish divergence has come to fruition.
Will OH have enough momentum to break local resistance and put in a new higher low?
Points to consider,
- Trend bearish
- Local resistance at 4.950
- Local support provided by EMA’s
- Stochastics in upper regions
- RSI diverged, Respecting trend line
- Volume above average
OH is currently in control by the bears, consecutive lower highs have been in place, a clear trend change will require a daily higher low.
Resistance is found at $4.950, a key level for the bulls to break as this will put in a new higher low, negating the bearish trend structure. Support comes from the EMA’s as they cross bullish at resistance. This needs to maintain for a bull break of the key local resistance level.
The stochastics in currently in the upper region, it can stay here for an extended period of time, however lots of stored momentum to the downside. RSI has diverged from price, needs to maintain its trend line for a bullish bias.
Volume is above average, OH needs continued bull volume follow through if it is to break local resistance.
Overall, in my opinion, OH needs to break local resistance convincingly with follow through. This will change the overall market structure, putting in a new higher low. An entry will be valid on the bullish S/R flip re-test of the local resistance.
What are your thoughts?
Please leave a like and comment,
And remember,
A streak of winning trades can boost your ego and self-confidence to such an extent that you start believing that you’re invincible. If that is the case, try to take a break from trading to calm your emotions down.
Is TRUL trading in a Head & Shoulders pattern?After the recent short report we've seen some very serious downward pressure, and rightfully so, IMO...
Any cannabis company related to fraud & corruption in this CantTrust environment is a Huge Red Flag..
There's nothing propitiatory about opening a bunch of dispensaries & growing grass, so the market cap here is out of touch with reality by a factor of roughly 10...
Is TNY trading in a Bull Flag or Symmetrical Triangle?Bullish flag formations are found in stocks with strong uptrends. They are called bull flags because the pattern resembles a flag on a pole. The pole is the result of a vertical rise in a stock and the flag results from a period of consolidation. The flag can be a horizontal rectangle, but is also often angled down away from the prevailing trend. Another variant is called a bullish pennant, in which the consolidation takes the form of a symmetrical triangle. The shape of the flag is not as important as the underlying psychology behind the pattern. Basically, despite a strong vertical rally, the stock refuses to drop appreciably, as bulls snap up any shares they can get. The breakout from a flag often results in a powerful move higher, measuring the length of the prior flag pole.
It is important to note that these patterns work the same in reverse & are known as bear flags & bear pennants, but the bullish volume recently indicates that it's unlikely to result in a bearish outcome...
Only time will tell, and when it comes to Tinley Beverages, "My favorite time frame for holding a stock is forever."
Warren Buffett
On a Macro level Tinley has held their share price impressively well comparable to "any cannabis related stock" over the past 4 years boasting roughly 523% gains...
On a Micro level we're potentially seeing a trend change from bearish to bullish, indicators that support my narrative is the recent Triple Bottom pattern that's linked to this chart. Also, the increase in buy volume indicates that short sellers are either losing money in their positions to the downside, or they're running short on shares available to short, or they've simply reached their target buy in price...
Keep in mind hopium is a schedule 1 narcotic & has killed many Moon Boys in the cannabis sector during 2019.....
WeedMD should bounceWeedMD should recover after almost 1year long downtrend, despite drop in sales they are shortly after harvest, I suspect lots of new buds are already in curing, soon ready for sales. On the top of that lfpress.com
This price range looks like great entry for long term position, however short term rapid recovery would be well deserved.
$GRWG... Ready To Resume UptrendRecent uplising news coupled with solid earnings and upgrades should take this back up to the high end of the range... $4.40 in sight... next target $5.00... look for friction @ 50MA 4.11 @ 100MA 4.45... Stop@ $3.60... sell 1/2 @4.80 then watch for direction...
All IMO...
$GRWG
Triple Bottom for TNY?It appears as though $TNY may have formed a triple bottom where I have the red fingers pointing right on the chart.
In my previous post linked to this chart I spoke about the descending triangle & potentially testing .335c, clearly visible on this chart we can see .33c is about exactly where a new double bottom was created, and thus potentially creating the third bottom of a triple bottom. We will need to see continued bullish price action next week & break out of this pattern flush to the upside, maybe create a top at 44c & consolidate sideways before continuing, who knows, only time will tell.....
The RSI appears to be breaking out of a Bull Flag, and on 5 year & 1 year time frame the RSI is fairly low with lots of room to move to the upside, "if we're looking at a longer term trend reversal."
Key Takeaways
A triple bottom is a visual pattern that shows the buyers (bulls) taking control of the price action from the sellers (bears).
A triple bottom is generally seen as three roughly equal lows bouncing off support followed by the price action breaching resistance.
The formation of triple bottom is seen as an opportunity to enter a bullish position.
Bull Flag or Descending Triangle.Since my post several days ago linked to this chart, you'll notice $WEED is holding the neckline area of the inverse H&S, forming two additional patterns known as a bull flag & descending triangle.
Seeing how the sector has thrown under the bus for the better part of 1 year, I'm expecting to see the Bull Flag play out.. Simply to go against the bearish narrative that's becoming a bit more hysterical by the day..
Time will tell per usual.
Cannabis Stocks Crash /Tilray: Boom And BustTilray is one of the cannabis companies that saw its shares rise massively prior to legalization in Canada, but shares have gone down a lot since then.
Tilray (TLRY) is based in the Vancouver Island town of Nanaimo, Canada, where the company is responsible for
"cultivating and delivering the benefits of medical cannabis safely and reliably," according to its website.
As with much of the marijuana industry, Tilray is losing money as it tries to expand in Canada and globally.
The company has a presence, of some kind, in at least 12 countries. But it has lost money over the past six quarters.
Tilray (TLRY) reported 2019 Q3 results that were mixed with strong medical sales and struggling recreational sales in Canada.
The company sold more than double the amount of cannabis it did last quarter but average pricing also dropped 30%.
More importantly, the company's weaker balance sheet will become its biggest near-term impediment to growth.
Disclaimer:
We are not registered or licensed in any jurisdiction whatsoever to provide investing advice or anything of an advisory or consultancy nature,
and are therefore are unqualified to give investment recommendations.
Always do your own research and consult with a licensed investment professional before investing.
This communication is never to be used as the basis of making investment decisions, and it is for entertainment purposes only.
Trulieve Cannabis Corp Trulieve Cannabis Corp., together with its subsidiaries, operates as a medical marijuana company.
Revenue is forecast to grow 39.46% per year.
Earnings grew by 339.5% over the past year.
RISK ANALYSIS
Earnings are forecast to decline by an average of -14.4% per year for the next 3 years.
High level of non-cash earnings.
Highly volatile share price over past 3 months.
Significant insider selling over the past 3 months.
Disclaimer:
We are not registered or licensed in any jurisdiction whatsoever to provide investing advice or anything of an advisory or consultancy nature,
and are therefore are unqualified to give investment recommendations.
Always do your own research and consult with a licensed investment professional before investing.
This communication is never to be used as the basis of making investment decisions, and it is for entertainment purposes only.
Cannabis Stocks Crash / Lawsuit Against HEXO Corp.A LEADING LAW FIRM, Announces Filing of Securities Class Action Lawsuit Against HEXO Corp. - HEXO
According to the lawsuit, defendants throughout the Class Period made false and/or misleading statements and/or failed to disclose that:
(1) HEXO's reported inventory was misstated as the Company was failing to write down or write off obsolete product that no longer had value;
(2) HEXO was engaging in channel-stuffing in order to inflate its revenue figures and meet or exceed revenue guidance provided to investors;
(3) HEXO was cultivating cannabis at its facility in Niagara, Ontario that was not appropriately licensed by Health Canada; and
(4) as a result, HEXO's public statements were materially false and misleading at all relevant times.
When the true details entered the market, the lawsuit claims that investors suffered damages.
Disclaimer:
We are not registered or licensed in any jurisdiction whatsoever to provide investing advice or anything of an advisory or consultancy nature,
and are therefore are unqualified to give investment recommendations.
Always do your own research and consult with a licensed investment professional before investing.
This communication is never to be used as the basis of making investment decisions, and it is for entertainment purposes only.
A further 56% reduction in CGC (cannabis)... One of the best choices for long term investment. However, in my opinion, the exchange rate may fall further. Its level can be around 7.68usd. From that level, I expect a long-term rise. The analysis shows that a second fractal is being constructed. The shape of this can be determined by the first fractal. However, its size may be 1: 3. It follows that the adjustment at this level has not yet been completed.
AURORA CANNABIS (ACB) | Risky, But Probably Worth It!Hi,
Aurora Cannabis Inc. produces and distributes medical cannabis products.
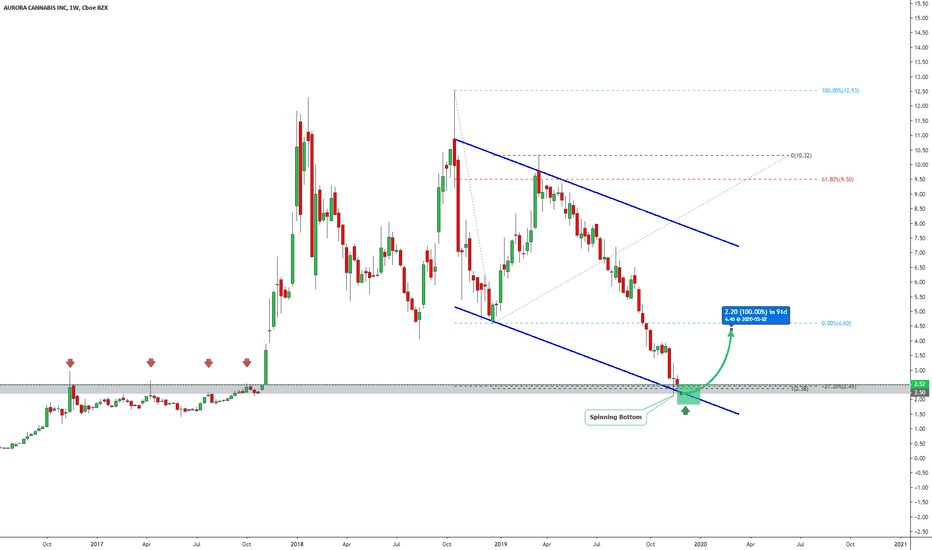
Obviously, it has some mixed fundamentals but technically it may find some buyers around 2.00 - 2.50.
Technical criteria are pretty strong, some of them are a bit subjective but in general, we have a strong crossing area. The green box consists of:
1) 2016 & 2017 high/resistance should start to work as a support level.
2) Actually, it has already started to act as support. In the last week, the price got a rejection upwards from the gray area (2016/17 high) and formed a Spinning Bottom candlestick pattern - bullish candlestick pattern.
3) Now, a bit subjective but still, channel projection worked as a support level and they make up a crossing area with the gray zone.
4) The crossing area becomes even stronger because we have D point exactly inside of it from the pattern called AB=CD
5) Fibonacci Extension 127% should make it (marked bounce area which stays between 2.00 - 2.50) also a bit stronger.
6) The current seasonal "pattern" favors buyers. It means that the end of the year has been pretty profitable for Aurora and the last upwards rally started about a year ago also in December.
Target is up to you but the strongest resistance level stays around the 5.00 and if it reaches there from the current area then it will be 100%+ profit.
Do your own research and please, take a second and support my effort by hitting the "LIKE" button, it is my only FEE from You!
Best regards,
Vaido


