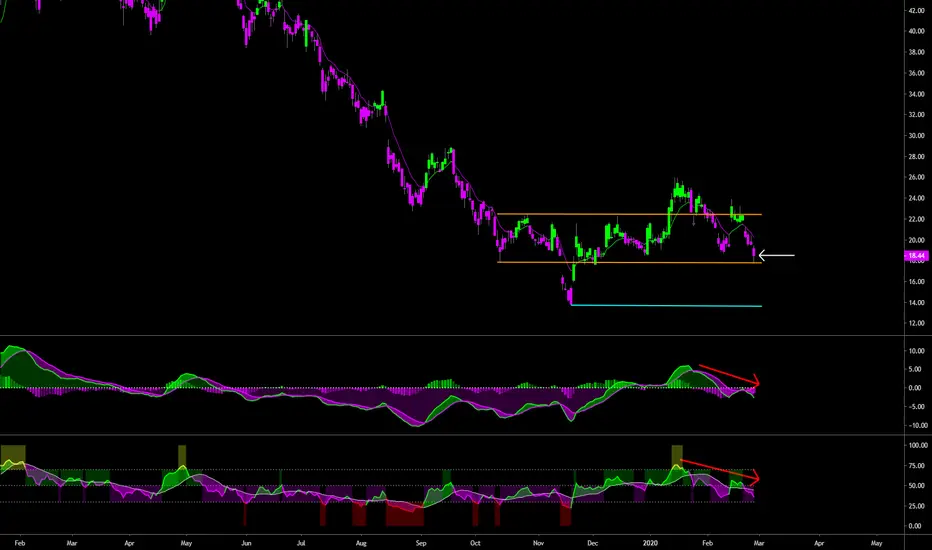
CGC Support TestCanopy Growth Corp is down roughly -15% on the trading week as global fears over Covid19 have finally gripped markets after a month of essentially dismissing the potential negative economic impacts.
CGC is currently trading within a parallel channel which began forming in late 2019, with an upper resistance level of $22.50 and a lower support level of $17.80. Yesterday saw traders close price just above the lower support level, or the bottom of the parallel range, which is an important level to watch in Fridays trading. A hold above the lower support line would indicate that bulls are still attempting to keep price in a consolidation range, while a close below the lower support level would indicate that bulls are losing the upper hand and becoming more fearful of Covid19's potential impact on economic activity across all sectors.
Given the severity of the market decline this week with indices such as the DOW Jones having its worst 1-day decline in history yesterday, its fastest 10% decline ever, as well as its worst 6-day performance since 1928(just before the Great Depression), its likely that traders will be unwilling to buy the dip in equities and hold stocks over the weekend.
Should traders fail to hold CGC above the lower range of the orange channel today, the next likely target is a retest of November 2019's low of $13.81 shown in blue.
Both indicators below the chart are showing negative momentum and trend behind price with the PPO in a bearish crossover and now moving below the centerline, as well as the RSI in a decline and also below its centerline as well.
Current view is bearish due to the overall fear gripping markets right now and CGC's position within the channel after yesterdays close.
Canopygrowthcorporation
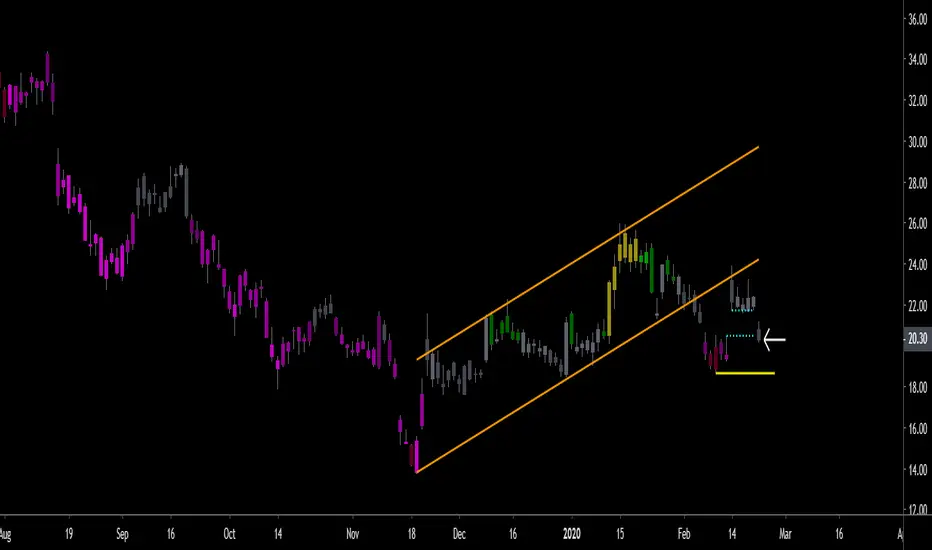
CGC Gap FillCanpoy Growth Corp's price filled the gap(blue dashed lines) that was created on February 13th -14th with a close today of $20.30, a gap fill that was anticipated after price failed to move higher last week and back into the rising trend channel(orange lines). Today's price move can mostly be attributed to the overall selloff in global equities last night into today over Covid19 fears, but likely would have traded lower and filled the gap even without the overall market decline.
The key level to watch now that the gap has been filled is the last low made before price attempted to regain the uptrend channel, the low being $18.65 indicated by the yellow line. That yellow line stems from the low made on February 11th and was the last level of price demand before price moved higher, ultimately stalling out at the lower line of the uptrend channel which acted as resistance rather than the support level it had been previously during the uptrend. In technical analysis, previous levels of price support become price resistance once they are violated to the downside.
A move below the yellow line would create a pattern of lower lows and lower highs in price after the failed attempt to regain the uptrend channel and could be viewed as a return to a negative price trend. For now price remains neutral and will remain so until/unless price moves below the yellow line, at which point a bearish case can be made for price. A move above last weeks highs would be bullish, but looks unlikely as long as global traders are being spooked by Covid19 and its potential short and intermediate-term affect on global supply chains.
CGC Loses UptrendCGC has fallen out of its uptrend channel(orange lines) and has returned to a previous consolidation range(blue lines). The trend for now has shifted back to neutral as long as price is within the blue lines; a break back above the blue channel would be bullish, a break below bearish. The PPO is indicating a negative short-term trend with the green PPO line declining below its purple signal line. Worth noting is that the green PPO line is close to crossing below the centerline which would indicate a more substantial downtrend should the PPO continue to fall below the centerline. For now, the lower blue line near $17.50 is the level to watch for support, a move below that line would shift the trend to bearish.

CGC Testing SupportCGC is back to testing an uptrend support line after a recent channel breakout that had looked promising until pandemic fears shook the market today. Currently watching this uptrend line to see whether or not it is able continue propping up price. A bounce here would be bullish for CGC, a break below the uptrend line would put price back to neutral, or no trend with risk of turning bearish again.
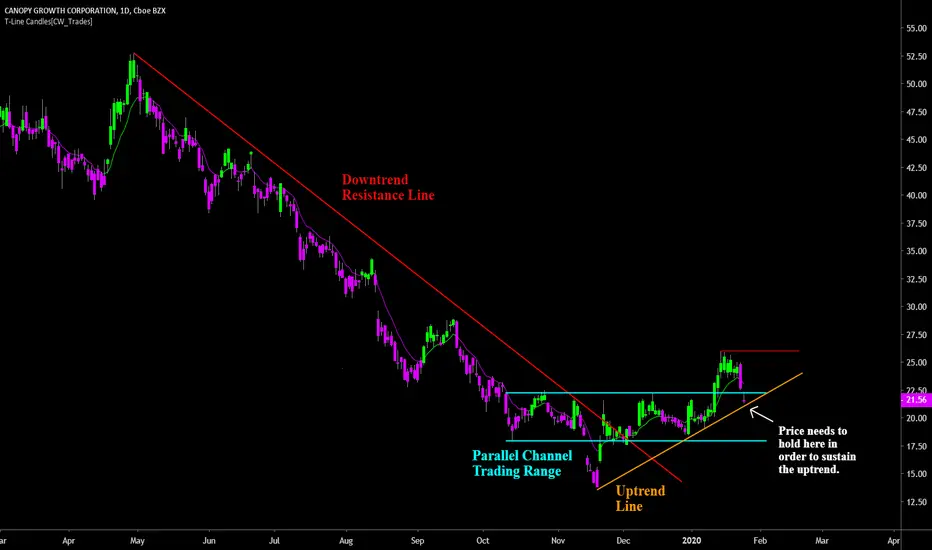
Canopy Growth Corp Breakout HoldingCGC is holding its own after a rough 2019. The recent sideways action within the parallel channel was an accumulation phase and now that we've had a successful breakout of the parallel channel the next move should be an upside continuation move, with or without a re-est of $20 first. A successful re-test and hold at $20 would help solidify the current uptrend and create a strong base for price to move up from ie attract more buyers who are waiting on the sideline.

Another stock i really like. CGC to survive the Bubble. Good evening traders.
I thought I would share another stock I really like for a couple of reasons. CGC is at a great entry price, even if we fall lower good dollar cost averaging will leave you in a good place when we return to the upside.
So my first reason, so called pot stocks have been getting a bashing by the media the past 6 months(just like crypto) most books I read and all the great traders of the past all like to buy when panic and fear are In the market, if the stock is good of course, it has to show potential in the future.
Second reason, most companies to come out of a so called BUBBLE, they have to have deep pockets or strong roots, I feel that CGC will come out strong on the other side.
And finally, the decline in the stock and low earnings was not all down to the company, economic and regulatory factors were huge in this.
Now I am not a financial advisor, I just read the charts and see what they have to offer, personally this is a stock that I own and I am simply sharing my thoughts for educational purposes.
This is again a long term hold and I don't have any short term T/P in mind, any TA on my chart is simply for learning/testing purposes.
If anyone has any opinion on this stock I would appreciate the feedback.
Every day is a learning day.
Trade safe people.

CGC - Swing Idealooks like a good setup for a swing up towards 40s - Market sentiment seems to be slowly changing. Farm payroll on watch w/ fed still dovish.
Pot industry still a few years ahead of itself - so trade wisely. I see this as a win/win, if the market turns - it's a solid spot for a beginning entry position and I'll plot out a long hold - IMO.
Been riding the volatility but love when everything starts to turn - or appear to. It's buying time!
GLTA

Long term Long position with head and shoulder bottom pattern Welcome to Fxtrading services, we provide Forex mentorship to our costumers.
We are watching this stock very closely as potential long.

Canopy Growth Corporation updates planAfter setback in the cannabis industry and lack of liquidity, we had a slump in stocks. Now it seems 22 is a strong resistance level.
Earlier entry is possible on the close of the recent gap.
Good Luck!

Canopy Growth Corporation trade planAs we see the end of wave C, looking for the buy on the break of the trend line. Multiple confirmations on it so a break is a good trigger.
Company has $7.01B market cap, industry is on the rise.
Good Luck!

CGC Critical Support|Falling Wedge|Bullish Divergence|Open GapHello Traders!
Update on CGC – Canopy Growth Corporation, testing critical support in a potential falling wedge pattern that has a bullish divergence coming to fruition, will CGC have a relief rally from here?
Points to consider
- Trend Bearish with consecutive lower highs
- Major structural support being tested
- Resistance at .50 Fibonacci
- EMA’s giving price resistance
- Stochastics projected upwards
- RSI converging from price
- Volume below average
- Open Gap
- Technical target in confluence with .50 Fibonacci Level
CGC has been trading in a distinctive bear trend within this falling wedge formation that has yet to be broken. We have consecutive lower highs as the trend comes into its probable apex zone.
Major structural support is getting tested, currently holding true, this is critical as it’s in confluence with the falling wedge’s apex zone. A break of this level will negate the formation, leading to local support being more probable to be tested. Resistance on the other hand is at the .50 Fibonacci level, this is a key area as it is in confluence with the technical target of the falling wedge…
The Stochastics is projected upwards; momentum is in favour of the bulls if price where to break up and above from current resistance line. The RSI is currently putting in higher lows; divergence from price as it puts in lower lows, this just further confirms the theory of a bullish divergence playing out.
Volume is below average at current given time; we need to see an influx of volume upon breakout to ensure that it’s not a fake out. A breakout and an influx of volume will make the EMA’s cross bullish which will confirm the trend reversal as currently it’s giving price heavy resistance.
Overall, IMO, CGC is more probable to break bullish from this formation as we are testing a critical support level, we also have an open gap, and gaps always tend to fill if you look at price history. The technical target for the falling wedge will be met at the .50 Fibonacci which is in confluence with structural resistance.
What are your thoughts on CGC?
Please leave a like and comment,
And remember,
Don’t worry about what the markets are going to do, worry about what you are going to do in response to the markets - Michael Carr

Pot Stocks Bout to FlyFinding support here on a large scale, First Target at weekly resistance, I think they will take it off schedule one or something will be the catalyst to get them flying again.

$TLRY - I expect $CGC to followjust like with chart similarities with Lyft and Uber. $TLRY tends to pave the way for $CGC.

Not alot of support on the way down for Canopy Growth. Looks like trend has completely reversed after another harsh rejection at the $50 level. Could the tide be changing?

Is a bottom near for Canopy Growth Corp?Did Canopy create a double top, or is the stock going to create a Macro higher low & stick in a bottom tmrw or sometime right away next week?? If Canopy doesn't take control of the market tmrw with some big news to offset the market sentiment than don't look down, in my humble opinion which is only worth a grain of sea salt from...….
Time will tell per usual.

$WEED support lost, will the channel hold? #WEED #CGCOh well, were definitely expecting more energy from around here but now it seems to be that the support that has been holding the price on right course since December '17, is lost. This channel where the price bounced a tiny bit right now has also been tested few times earlier. Not looking that impressive here, for me at least. If this channel is lost, we may see this stock around sub 40 CAD and then maybe even sub 30 CAD. Seems crazy with all this legalization just keep on spreading that the price would see stupidly cheap prices but maybe still lower from here a bit. Direction will chance soon - after the market has done what has to be done.


Bull flag pattern on CGC. Could look to move higher.CGC is currently within a very clean bull-flag pattern. We also have the 100/200 day moving averages right around the bottom of the bull-flag. I will be looking for a break-out above the descending line of resistance, and if we get that with some conviction, we could see CGC run back to previous highs around $55-60.
Moving average guide (All daily for this post):
50 day moving average in Green.
100 day moving average in Yellow.
200 day moving average in Red.
Entry: $40.00-$45.00.
Target 1: $51.00 (top of the flag-pole.)
Target 2: $56.60 (prior resistance level.)
Target 3: $59.25 (previous peak.)
--Not looking for any further targets after target 3, as a break above $59.25 would take CGC into a new price discovery phase.
SL: $38.25-$39.25 depending on risk level. (Below the 100 and 200 day moving averages. Just be aware of wicks.)
-This is not financial advice. Always do your own research and own due-diligence before investing and trading, as for investing and trading comes with high amounts of risk. I am not liable for any incurred losses or financial distress.

weedweak at least levels suggest price will come towards 50$ range - it just can't above 65$ not enough buyers showing up..market profile suggest 50$ at a naked VPOC to come test and find buyers 15-20% drop very possible here will probably affect whole cannabis sector which is pretty much overbought anyway

Canopy GC: High return long term investment.Canopy Growth Corporation is on strong long term bullish price action both on 1W (RSI = 58.856, MACD = 4.873, Highs/Lows = 2.6189) and 1M (RSI = 66.122, MACD = 12.099, Highs/Lows = 7.3414). Since mid 2017 in particular, it has been trading on Higher Lows reaching +1000% in growth. Using the Pitchfork to identify the pressure zone, we estimate that the asset is close close to a bullish accumulation point (Higher Low). Out moderate Higher High target is 110.00.
** If you like our free content follow our profile (www.tradingview.com) to get more daily ideas. **
Comments and likes are greatly appreciated.

Canopy (CGC) update: 30-60 days downtrend?Update of previous chart on Canopy.
MACD, Parabolic Sar, RSI all looking pretty bearish and reminding me of previous chart action in the aftermath of the late 2018 price run-up.
However.. the EMAs (10 and 30) haven't crossed over, and to me that would need to happen to confirm a steep downtrend.
For now things are leaning bearish, if we see further confirmation in that direction, I'd be looking at 30 to 60 days of downtrend based on past price action.
So targeting a buy in March or April - but where would I place my buys?
+ Diagonal trendline
+ Horizontal support
Both of these seem like nice areas to put in some bids. Let's come back and see what happens.

ACNNF Buy ZoneBought last year, way too high, down 60% in my position
Realize I suck at holding 3-5 years long term
Realize I don't like to bet on biotech/pharma companies who are constantly in development stage with no sales
I find these companies sketchy with changes in management, awaiting FDA approvals, cash burn, lack of transparency on development of new drugs/trials, burns through shareholder via share dilution/fundraising
Lacks volume and interest
Hyped up and falls hard.
Looking to average down into my buy zone, make a gain and average out my losses so I can exit.
Thoughts? Feedback would be greatly appreciated
This is supposed to be along term cannabis play in Aus, touted as the Canopy Growth Corp of Australia (side note, canopy growth does own 15% of this company and has partnerships to distribute to Australia through Auscann) But I just have no idea how big of a market cap Australia is going to comprise of.
Looking to enter at critical support. Currently there is still another 20% downside until reaching major support. Would prefer to wait a bit longer to initiate another average down purchase

