ADAUSD Is this 1W Golden Cross what the market needs??Cardano (ADAUSD) just formed a 1W Golden Cross this week, the first in its history, amidst a continuous bearish sequence since the December 02 2024 High. With its 1W RSI just below neutrality, this simply highlights the undervalued condition of this token relative not only to the rest of the high cap market, but also to its previous Bull Cycle.
As you can see, based both on 1W RSI and price action terms, we may be in a consolidation phase similar to September - November 2020, at the end of a Megaphone pattern. That pattern was the Accumulation vessel of the Cycle that led to the massive 2021 parabolic rally and the eventual Cycle Top / Higher High of the historic Channel Up.
According to that, we should be expecting a 1.236 Fibonacci extension test, targeting $5.000.
-------------------------------------------------------------------------------
** Please LIKE 👍, FOLLOW ✅, SHARE 🙌 and COMMENT ✍ if you enjoy this idea! Also share your ideas and charts in the comments section below! This is best way to keep it relevant, support us, keep the content here free and allow the idea to reach as many people as possible. **
-------------------------------------------------------------------------------
💸💸💸💸💸💸
👇 👇 👇 👇 👇 👇
Cardano

TON/USDT : Are you Bullish or Bearish? Let's Talk!By analyzing the #Toncoin chart on the 3-day timeframe, we observe that the price is still within the demand zone between $2.40 and $3.00.
If the price manages to break above the $3.10 level and hold within the next 7 days, we can expect further growth from this cryptocurrency.
The expected returns are approximately 20% in the short term, 40% to 55% in the mid-term, and up to 110% in the long term.
Please support me with your likes and comments to motivate me to share more analysis with you and share your opinion about the possible trend of this chart with me !
Best Regards , Arman Shaban

ETH/USDT : Gearing Up for a Major Breakout? (READ)By analyzing the Ethereum chart on the weekly timeframe, we can see that the price has started rising just as expected and is now approaching the first target. For now, ETH faces major resistance in the $2,600–$2,900 zone.
If price breaks above this key area, I expect a strong bullish move from Ethereum!
Based on the main analysis, the short-term targets are $2,700 and $2,890, while the mid-term targets are $3,100 and $4,100.
Please support me with your likes and comments to motivate me to share more analysis with you and share your opinion about the possible trend of this chart with me !
Best Regards , Arman Shaban

ADA/USDT : Get Ready for another Bullrun (READ THE CAPTION)By analyzing the #Cardano chart on the 3-day timeframe, we can see that the price is currently trading around $0.59. After sweeping the liquidity below $0.51, our bullish outlook for the next upward wave has strengthened significantly.
I'm now expecting a strong move from ADA, with short-term targets at $0.61 and $0.76, and longer-term targets at $0.93, $1.05, and $1.33!
Please support me with your likes and comments to motivate me to share more analysis with you and share your opinion about the possible trend of this chart with me !
Best Regards , Arman Shaban

HolderStat┆ADAUSD formed rising bottomBINANCE:ADAUSDT has formed a symmetrical triangle after finding firm support around 0.54. Previous consolidation zones have led to significant breakouts, and the current structure is showing early signs of a similar rally. If bulls manage to reclaim 0.58, a climb toward 0.66 and 0.70 becomes likely, with upper trendline resistance acting as a magnet for price.

It's disappointing !!!Do you think this will happen, or do you see ADA below $0.50 in the future?
Best regards CobraVanguard.💚

Cardano Correction or Opportunity? (READ THE CAPTION)By analyzing the #Cardano chart on the 3-day timeframe, we can see that after reaching 73 cents and amid rising war tensions, the price started a correction along with the broader crypto market. This correction has now brought ADA to attractive zones for potential laddered buying and long-term investment. Cardano is currently trading around 54 cents, and if the conflict continues, it may drop further, possibly below 45 cents.
Key demand zones are at $0.36, $0.45, and $0.52.
Short-term targets are $0.61 and $0.76, while long-term bullish targets are $0.93, $1.05, and $1.33.
Please support me with your likes and comments to motivate me to share more analysis with you and share your opinion about the possible trend of this chart with me !
Best Regards , Arman Shaban

Gold Pullback Into Demand – Is Another Bullish Leg Coming?By analyzing the gold chart on the 4-hour timeframe, we can see that, as expected, price began to rise from the $3323 area and reached up to $3350. After this move, gold experienced a minor correction down to $3310, which aligns with a key demand zone.
Currently, gold is trading around $3322, and if price holds above $3313, we can expect another bullish move with $3333 as the first target and $3350 as the second.
This outlook will be invalidated if price closes below $3309.
Please support me with your likes and comments to motivate me to share more analysis with you and share your opinion about the possible trend of this chart with me !
Best Regards , Arman Shaban

Cardano, The Support Line —Crypto For The FutureHere we have Cardano long-term. I am keeping it simple because simple is best.
We have this "support line." Notice that a descending wave ends on a flat support. Each time this pattern showed up, decreasing prices with a stable base, what followed was a strong inverse reaction. Prices were going down but the reaction was a strong jump. Notice how each time the bullish jump becomes bigger.
» The first support line and descending triangle happened in 2023. This led to a small bullish wave, not a fast one but a good one.
» The second descending triangle and support line happened in 2024 and this one led to a strong bullish jump supported by high volume. Here the candles start to become bigger.
» The third and final support line is the current one, 2025. This one is expected to produce such a strong reaction that a new all-time high is expected and beyond.
Now, the action will be wild and strong but it won't happen in a single day, week or month, it will take months, many months. The bullish wave can develop in 4 months as it can take 6 months or even more. And this even more is very important because this is something not seen before. A "White Swan" event. The bullish cycle can develop for 12 months or even more because the preparation has been so prolonged and because fundamental market conditions have been improving for years, with a major boost the past 6 months. Conditions are so much better now compared to just a few years ago, that it is even hard to understand. It is like the world is shifting, changing and adapting to our vision. We saw Crypto, we voted for Crypto with our energy, attention and money, and the world is now catching up.
If all this "improvement" in acceptance and adoption has already happened within just 6 months, what do you think will happen in four full years? By the time this cycle is over, we will be living in a different world.
If you are in this market now, Oh boy! you are blessed; you are wise, you made the right choice.
If you are a developer, a reporter, a coder, designer, web manager, project owner, entrepreneur, promoter, innovator and the like, you are damn smart and you will be reward for the risk you took.
If you are on the other side of the spectrum, the artist, the dancer, the writer, the composer, the teacher, the athlete, the body builder, yoga instructor, waiter, the server, the clerk; the lawyer, the accountant, the advisor, and decided to put your hard earned money in Crypto, you decided to join... God bless you, you will be rewarded for the risk you took.
Patience is key, we are very close.
If you decided to trust my clean-sharp-straight words, Thank you!
You are appreciated greatly for your continued support.
If you are a human being, we love you... Crypto was made for all of us.
Don't worry about Cardano, it is going up.
Namaste.

ADA | BTC | ET | Why ALTSEASON is COMING SOONAfter a -34% retracement, ADA is ready to go higher alongside with the rest of the alt market.
We see a very interesting phenomena here, were ADA also represents a large part of the larger alts: BTC pulls back, ETH is starting to increase or trades sideways (before the increase) whilst the alts dip.
This is actually BULLISH for alts, showing the very clear rotation between BTC, ETH and top 15 alts.
If we look at the macro of ANY of the alts I've been working through recently, a similar pattern appears - a clear bottom, followed by a sideways trade. This is usually the point just before the big ALTS season.
We actually see this pattern at the end of the 2018 rally, as well as after the 202- Covid dip:
The bottom line -
ADA and other alts are gearing up for their ALTSEASON. With patience, we will soon see some great gains across the markets.

SHORT Idea on CARDANOThe 0.6020 level has been recently broken and retested. This is a clear confirmation that price has accepted this level as a new resistance and should continue pushing lower .
My target is 0.5688
SL : 0.615

ADA , 1DAs BTC is Falling And BTC is given Breakout of Pattern in 4Hr , then Remaining coins will also fall drastically .
in 1D pattern of ADA USDT , it is Breaking Down as BTC is also given Break Down of Pattern
Follow for More Ideas like This

Cardano- Polkadot, Cardano, or any other major cryptocurrencies all feel alike.
- Only the price is different.
- Find Resistance.
- Find Support.
- Master your emotions, learn and gamble at the good time.
Happy Tr4Ding !

Cardano UpdateA lot of you have been DMing me asking for altcoin analysis. i hear you, but here's the truth:
- Right now, most altcoins are simply too weak to offer a reliable forecast. I prefer to post when timing makes sense, not just for engagement, but to avoid misleading anyone.
- BTC Dominance is still heavily suppressing the altcoin market, and I’d rather wait than risk rekting my followers with premature calls.
So why do I post about Cardano? :
- Simple, Cardano is one of the most established altcoins. It makes sense to track its evolution alongside Bitcoin and Ethereum. When you're analyzing the broader market cycle, starting with BTC, ETH, and ADA gives meaningful context. Newer cryptocurrencies from 2020+ don’t have the same historical data, which makes reliable analysis much harder.
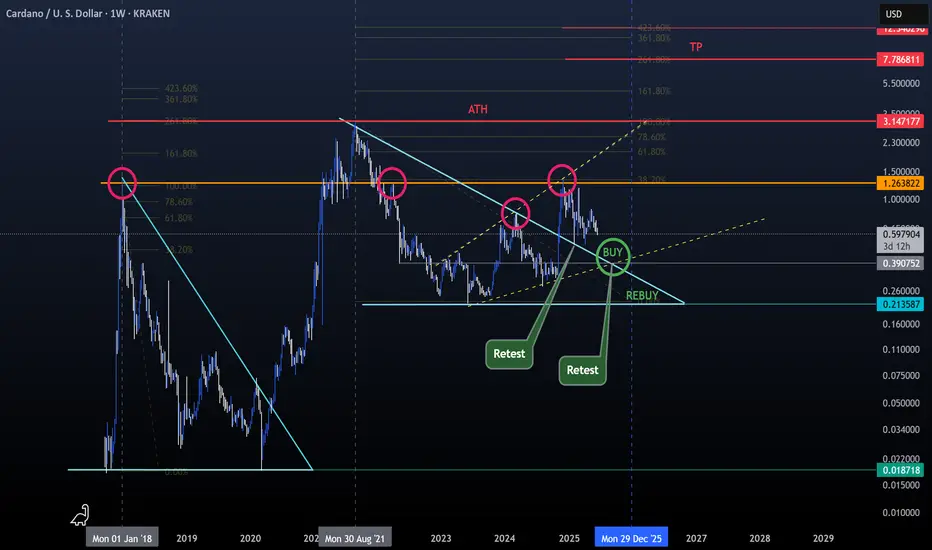
Back to Trading (Everything is marked on the chart for easier reading) :
- Cardano got rejected around $1.25, which aligns with its 2018 ATH, a key historical resistance.
- Check the bullish megaphone pattern and how it connects with the trendline and that $1.25 level (marked with yellow dotted lines).
- Also observe the minor bounces and retests above the bearish triangle trendline (light blue).
What we can do now?
- Nothing. If BTC dips, altcoins will likely follow and get rekt.
Best strategy for now:
- Consider setting a buy order around $0.41 (don’t go all in).
- Keep some dry powder in case of further downside, potentially to rebuy around $0.21 if pressure continues.
Be wise, be patient, ride the wave, don’t fight it.
Happy Tr4Ding !
HolderStat┆ADAUSD retesting of the $0.6 levelBINANCE:ADAUSDT is orbiting the major $0.6000 shelf inside a fading down-channel. A lift through 0.63-0.64 would flip short-term momentum and open a swift path toward the mid-$0.70s, while a daily close below $0.58 cancels the run-up thesis 📈

HolderStat┆ADAUSD BULLISH BOUNCEBYBIT:ADAUSDT is squeezing out of its falling-channel floor, carving a clean higher-low right above 0.66. That move flips a month-long consolidation into a fresh trend-restart signal. A steady bid on top of the diagonal keeps the bias pointing north-east; reclaiming 0.71 unlocks the 0.77 target where the upper megaphone meets prior supply. Break that and the “new-highs” narrative returns to center stage.

Cardano and Diametric Pattern
We are currently in wave-g of the Diamond Diametric and it could continue to 0.43.
After the completion of the Diametric, if the Double Combination pattern does not form, we expect an uptrend to form. (The post-pattern movement will show us whether the Diametric has completed or not).
Good luck
NEoWave Chart

ADA's situation+ Target PredictionThe price on the daily timeframe is within a triangle, which can create some uncertainty about which direction it will move. Here, we should wait to see which side of the triangle the price breaks out from. Remember, the trend is our friend.
Best regards CobraVanguard.💚

Cardano Weekly, UpdateCardano weekly doesn't look as good as XRP and Ethereum, this is true because I am using the same indicators.
Here we can see ADAUSDT trading below EMA34 and MA200. We can even see an attempt this week to move higher followed by a rejection, this means that there can be some more bearish action before higher prices but this bearish action can easily happen short-term. Why? Because Cardano has already been dropping for five weeks straight.
The rise from the 7-April low lasted a total of six weeks. The week that produced the peak is also the first week of lower prices. So we can say 6 weeks up and four weeks down, or, five weeks up and five weeks down.
The thing is that the market seeks balance and this retrace is already big enough and has been going long enough. Yes, the action is happening below these moving averages but this can easily change.
Short-term bearish.
» ADAUSDT will continue bearish as long as it trades weekly below the $0.7050 - $0.6875 price range. When ADAUSDT moves and closes above this range, the bullish bias is confirmed. Any trading below and we wait.
Thank you for reading.
Your support is appreciated.
Namaste.

HolderStat┆ADAUSD above the $0.66 levelCRYPTOCAP:ADA
→ Climbs out of falling channel, presses 0.68 trend-lid
↳ Accept > 0.68 targets 0.72–0.75 → 0.80–0.85
⇢ Must defend 0.60–0.63 breakout shelf
⤴ Fall < 0.60 hands reins to bears aiming 0.58–0.55

Cardano, What To Expect!The action is turning bearish after a very weak bounce from "higher low" on the chart. There is a sequence of local lower highs on ADAUSDT daily. What to expect?
Expect a test of the "higher low" zone as support and this zone breaking. The next level that will come into question is the "main support" but this one isn't likely to be tested.
Picture the action going lower towards support and ending right in between 'higher low' and 'main support'. This is the main scenario.
This scenario will keep the broader bullish structure intact and at the same time would end as a major market flush. As many weak hands as possible are removed and yet the bulls will remain in control.
Make no mistake, whatever happens in the short-term, Cardano will continue to grow. This is only a temporary event. Patience is key.
Thanks a lot for your continued support.
Namaste.

ADA | Liquidity Drain or UPSIDE POTENTIAL??ADA is lacking behind in terms of altcoins this season. We've not yet seen the new highs or parabolic increases that is due for a new BTC ATH.
We're seeing higher highs, and higher lows in the macro which is a bullish sign - indicating the trend is still BULLISH
From the macro, we do see a better picture.. at least THIs time around, the accumulation cycle isn't in such a tight range, and you could day trade / swing trade:
_______________
BINANCE:ADAUSDT

Be careful with ADA !!!Finally, the price broke the wedge, and the price experienced a significant drop. I think is the time for btc to rise again to 0.73 after more correction . STRONG SUPPORT 0.67
Give me some energy !!
✨We spend hours finding potential opportunities and writing useful ideas, we would be happy if you support us.
Best regards CobraVanguard.💚
_ _ _ _ __ _ _ _ _ _ _ _ _ _ _ _ _ _ _ _ _ _ _ _ _ _ _ _ _ _ _ _
✅Thank you, and for more ideas, hit ❤️Like❤️ and 🌟Follow🌟!
⚠️Things can change...
The markets are always changing and even with all these signals, the market changes tend to be strong and fast!!
