Cardano Could Make A Breakout TodayWarning: our thoughts are ours; not financial advice.
Cardano is one of many assets on our watchlist.
It's followed the uptrend line it's been trading for weeks and now we could see a breakout from the channel today or in a couple of days.
We're still watching.
CARDANOADA

🤩Attaboy - ADAmantium 🦍Wow... This went REALLY well - (Gracias Jose 💫)
Ethereum's competitor Cardano was a great call.
Outperforming the rest in the category and looking healthy technically from day one.
Few dips bought nicely and dinner served today.
Are we out now? No... we do what we ALWAYS do: take some profit, leave some for higher, be able to buy new dips when they show up.

CARDANO, WHAT'S NEXT?? 😍💪🏼💸 CARDANOOO - ADA 💸😍
After some some another Ada update, I know some people who bought cardano at my last call, I guys are already in 100% profit!💪🏼 Well done and I'm happy for you guys! 💸
So I've been getting the questions if cardano will dump. Well, of course thats possible, but I don't count on that. My opinion: SIDEWAYS AT WORST, UPWARDS AT BEST! I think cardano is going to move sideways for the immediate short term, Maybe ranging in between 60 and 70 cents. If it might break the 73 cents level, it can continue upwards. But I think it needs to cool down a little bit and I'm basing this on the MACD and RSI indicators as seen on the second pic 📈📉 Enjoy the bull market everyone!!

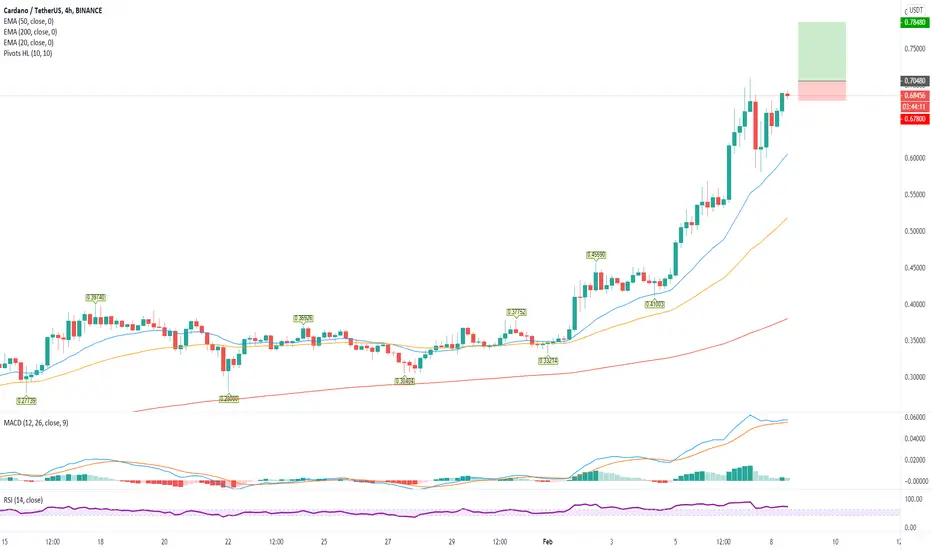
ADA Buy a break setup.Cardano - Intraday - We look to Buy a break of 0.7048 (stop at 0.6780)
Daily signals are bullish.
We can see no technical reason for a change of trend.
We look for gains to be extended today.
A break of bespoke resistance at 0.7000, and the move higher is already underway.
Our profit targets will be 0.7848 and 0.8148
Resistance: 0.7000 / 0.7500 / 0.8000
Support: 0.6600 / 0.6150 / 0.6000

Cardano Road Ahead - Next Stop $.70BITTREX:ADAUSDT - 1D
I built this chart a few weeks back when Cardano was in the process of completing a long term cup and handle. With ADA price shooting up, I've seen alot of people on social media just pulling resistance/price levels out of their butt so I wanted to re-publish this with some hopes that people will have a better idea of where roadblocks lie ahead.
As noted in the previous post, Cardano launched at the perfect time to catch the bull fervor of 2017. It was nowhere near ready to hit those price levels and the coin shot up dramatically in a short period of time. As such, we don't have a ton of support/resistance levels to work off of - given that the coin was rising 10-25c/day. But we do have some to work with. The chop zone we're heading to was formed during the crash of 2018 and represents a lot of ping pong action on the way down. I see two ways this will play out:
1. Price blows right past
2. Price chops around in that zone and gathers steam for a quick move to 90c once it breaks 70c.
If #1 plays out - I'd expect a swift rejection on the first attempt at 90c. If #2 plays out - 90c could get obliterated on first attempt. If 90c is quickly overcome and we get some hourly candle closes above $1 - then we're going to challenge ATH relatively quickly thereafter. Keep in mind all of this could happen in a short time period with Greyscale opening an ADA trust and a potential CB listing (Hoskinson eluded to a big liquidity announcement soon). The rise from a dime to a dollar happened in a blink of an eye before so that *is* the precedent.
Inevitably Cardano will break its prior ATH, and its also inevitable that it will chip away at ETH Dapp/DEX market share with $LQ launching in <3 months. How long you want to stay on the ride is entirely up to you. Now, between 65-70c, and from 95c-$1 all represent good potential entry points when the price is right.
This is not investment advice and trading cryptocurrency is high risk

CARDANO - Ethereum's main competitor The Ethereum killer as some name it. It's technology seems to be gaining more and more fanatics in the crypto space.
Ethereum 2.0’s ‘science is not good,’ says Cardano’s Charles Hoskinson , as Cardano Gets Closer to Goguen Era after the successful rollout of the Goguen “Mary” update
(the one of two hard forks that will allow Cardano to transition).
i think we picked a winner again..
(Thanks Jose)

Decision Day For Cardano ADAWarning: our thoughts are ours; not financial advice.
Cardano is one of our favorites. It's stood the test of time; it survived the bear market.
However, some short-term analyses to ponder upon.
Though in the long term, ADA is bullish. Very bullish. You can't just be bearish on this one. Nevertheless, we could (not of a certainty) see a pullback in the coming days.
ADA just rallied strongly to the top of the channel, we need to either see the strong move throughout today making a close above the channel which will translate to a breakout. If that happens, great news. We should even expect more bullish days ahead.
Alternatively, we could see price scramble back inside the channel at the close of today's' candle. If that happens, well, we may Cardano's price pullback to the midline or the bottom of the channel before resuming its uptrend.
Whatever happens, trade with caution.

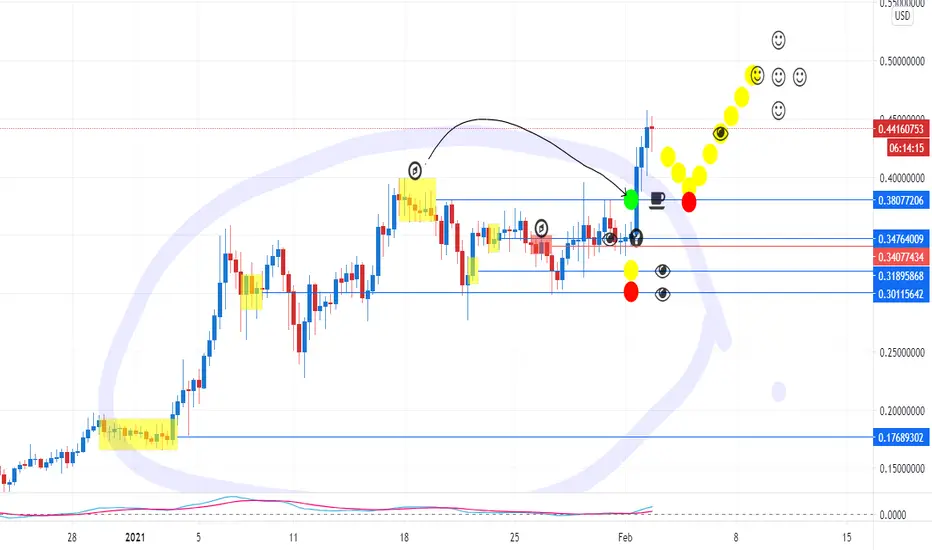
ADA Daily Follow-Up to 1-27-21Last week I made a quick update on ADA as it was setting up for a test of $0.50. Before we went into this bull market cycle I normally would utilize more tools to make analysis's. If you were involved in the 2017 cycle then you'll remember that indicators such as RSI and MACD became LESS reliable as we broke new highs.
That said, I'm not saying that indicators aren't useful but that with the constant momentum etc it's useful to fall back on the old saying "Less is More". Just because the RSI shows that we are overbought doesn't mean the move is completed.
Remember, these big moves take days to complete. People will take profit, the price will dip, and it'll be bought up and the price will move even higher before any significant pullback.
Things to look at:
- Volume is on the Bulls side, we have a strong break of $0.40 and briefly touched $0.46. Keep tabs on the Volume as we push up further.
- As I mentioned earlier, the other indicators such as RSI and MACD won't be nearly as reliable in indicating momentum shifts so keep tabs on the Volume and anything that will affect fundamentals.
What to expect:
- Resistance at $0.50
- With BTC ranging in the low-mid $30ks and Alts moving up, we'll see the money start flowing between each.
- Tax Season is starting soon in the U.S and regulators could put a damper on things but it'll only be temporary.
See you all on Mars

Cardano Correction or move up?in this time frame we have a great ascending channel as you see in the chart, and key levels of support and resistance .for now price follows the bearish trend line and one unsuccessful break out and a triangle pattern as well.
if the price could break out successfully and stabilize above the resistance we can see bullish movement to the top of channel 48 or 50.
but if price be unable to break above and break downside of the triangle and ascending channel the two main support could be great area for price recovery and powerful movement to the higher targets.

ADA DailyVolume is dropping, RSI is resetting as is the market. Good time to consolidate.
Still sticking to my call of $1 ADA by the June - August.

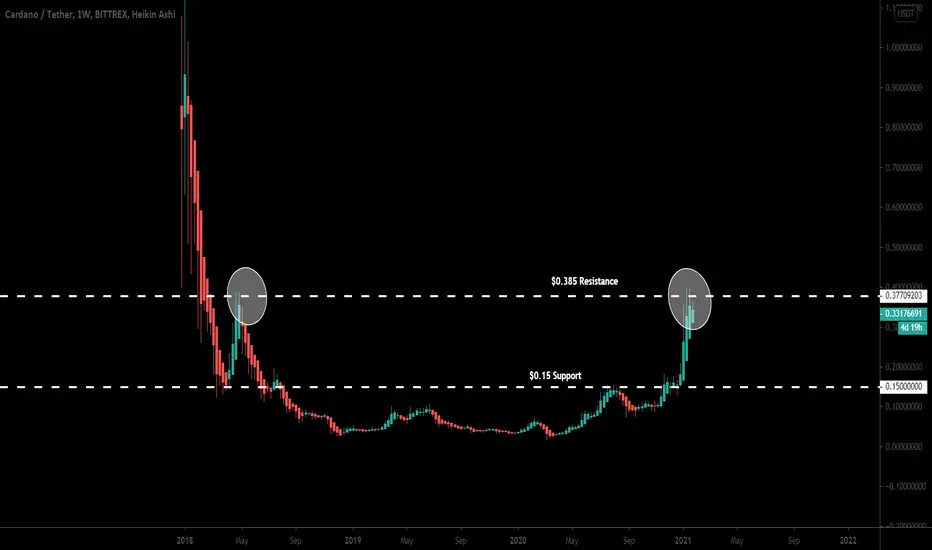
ADA breaking out the key level resistanceHey friends, hope you are well and welcome to the new update Cardano coin.
Breaking out key level resistance:
During the powerful bullish rally on the long-term first the price action broke out the $0.15 resistance and after re-testing this resistance as a support move to the next resistance $0.385. This is the key level resistance for ADA coin because this resistance is not broken out since 2018. If this resistance will be broken out then the price action of ADA can reach at $1.4 very easily.
The EMAs and Ichimoku cloud:
On the weekly chart, the price action of ADA coin has is moving above the exponential moving averages 10 and 21 and using these EMAs as good support.
On the weekly chart, the price action of ADA with Bitcoin pair is breaking out the Ichimoku cloud. Once this cloud will be broken out then the Cardano can turn more bullish.
Conclusion:
This can be a historical moment for ADA, because on one side in the US Dollar market it is breaking out the key level resistance and in Bitcoin marked it is breaking out the Ichimoku cloud strong resistance.


Another Shorting OpportunityAnother shorting opportunity, it will will drop at least to 0.34 before making a new ATH.
Open: between 0.39-0.367
TP1: 0.34
TP2: 0.33
SL: 0.393

ADAUSD this is just a beginning towards previous highEMAs on the monthly chart.
Even though the price action of Cardano has rallied more than 1800%, but if we switch to the monthly chart, then it can be observed that the priceline has just broken out the resistance of EMA 10 and 21.
EMAs on the weekly chart:
On weekly chart, the price action broke down the EMAs 10 and 21 but again it has moved above these exponential moving averages.
SMAs on the weekly chart:
On the weekly chart, the price action of ADA has broken out the 50 and 100 simple moving averages and now breaking out the 25 SMA resistance level.
Ichimoku cloud:
Now if we turn to the ADA with the Bitcoin market, then the price action of Cardano is likely to break out the Ichimoku cloud resistance on the long-term weekly chart.
Conclusion :
The priceline has rallied more than 1800% so far, but this is just a beginning and the ADA can cross up the previous highest price ever very easily.
For exact buy and sell targets for this trade, and other harmonic trading signals you can join:
www.patreon.com

Cardano ADA 4 hour vs 1 Day timeframeCardano ADA receives a buy signal on the 4 hours timeframe and another buy on the daily.
Please leave me a message if you want to test the buy and sell indicators that i am using.

ADAUSD - Our Small ChartDefinitely looking healthy and ready to fly higher.
3 previousd resistances have been broken, checked and confirmed as new support levels. It reminds me of Bitcoin just a few weeks ago at 12,500 and 16,300 levels.

ADAUSDT (Waiting for the resistance zone breakout)#ADAUSDT ( 1H chart) Technical Analysis Update
Waiting for the Resistance zone breakout
ADA/USDT currently trading at $0.315
Long Entry-level: Above $0.320 (only enter long after 1 h candle closes above the resistance level at $0.320)
STOP LOSS:$0.300
Target 1: $0.340
Target 2: $0.380
Max leverage: 3X
ALWAYS KEEP STOP LOSS..
Follow our Tradingview Account for more Technical Analysis Update, | Like, Share and Comment your thoughts.

ADA - Cardano - Price levels to JUMP IN - LONGADA is going up after a quick but massive price correction. If you did not catch the bottom, you could enter with a price drop to $0.250387 - $0.229006.
Entry levels - LONG:
$0.250387
$0.229006.
Take Profit:
$0.313558
$0.341742

ADA Cardano Analyze By Persian crypto master Daniyal DaraeiHi
Like it before reading please
cardano made a good symmetrical triangle on daily time frame , and we have good support line on 0.13 and resistance on 0.15 , it can made a great consolidation on this triangle and it can break triangle upward to get on targets that i'd showed on the chart.
0.20$ could be first target and the second could be on 0.2355
consolidation in 5 to 10 days could make bullishness before breaking out
FOLLOW us , this idea will get update soon
;)
Daniyal daraei

ADAUSDT (Falling Wedge Breakout)#ADAUSDT Technical Analysis Update
Falling Wedge Breakout
ADA/USDT currently trading at $0.187
LONG ENTRY level: $0.185 to $0.188
STOP LOSS: below 0.171
Target 1: $0,197
Target 2 :$0.210
Max leverage: 3X
ALWAYS KEEP STOP LOSS...
Follow our Tradingview Account for more Technical Analysis Update, | Like, Share and Comment your thoughts.
