CARDANOADA
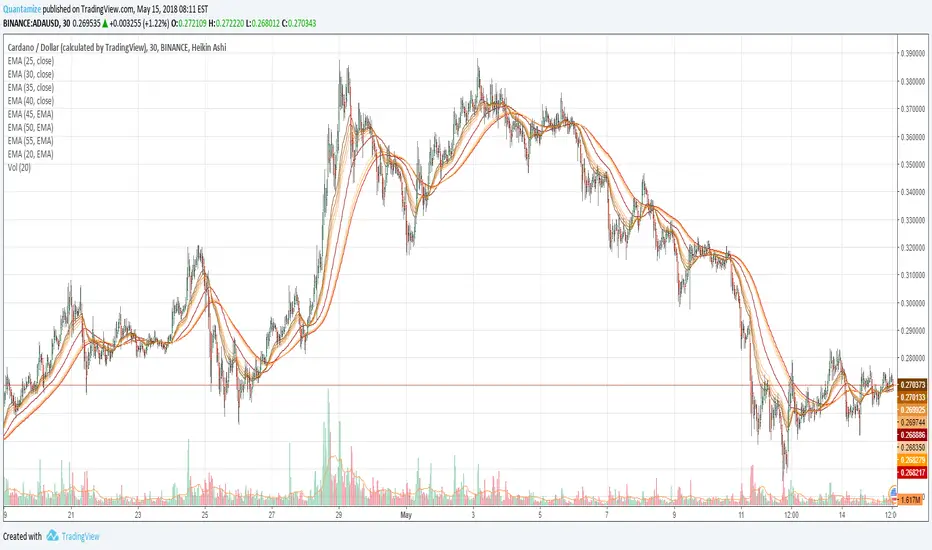
ADA/USD pair seems to have no clear direction currently. The currency pair is one of two today’s leaders as it added nearly six percent in the past 24 hours. Cardano seems to feel good as ADA price moves along the green ascending trend line. However, currently, it is in correction. ADA/USD has crossed the support area at $0.2523 and currently loses its positions. Cardano price is still above the Ichimoku cloud meaning buyers are controlling the market.
Possible scenarios for Cardano are the following:
1. ADA/USD will develop its decline towards the green ascending trend line and test it. Sellers will have the opportunity to push Cardano even lower if successful. The closest support area is at $0.2387.
2. The currency pair will try to test the closest resistance area at $0.2523. Buyers will have an opportunity to drive Cardano even higher if successful.
3. ADA/USD will stay close to the current level without significant price changes.
The currency pair seems to have no clear direction currently. It moves along the higher border of the Ichimoku cloud on the hourly chart.
Check more detailed crypto analysis HERE

Is ADA a Good Buy Right now?Hey, I am back after some time with another Technical Analysis , this time looking again at Cardano - ADA.
I will answer really simple question for me, and that is if Cardano is a good buy now.
Lets talk a bit about it.
Cardano is really solid buy right now. Why?
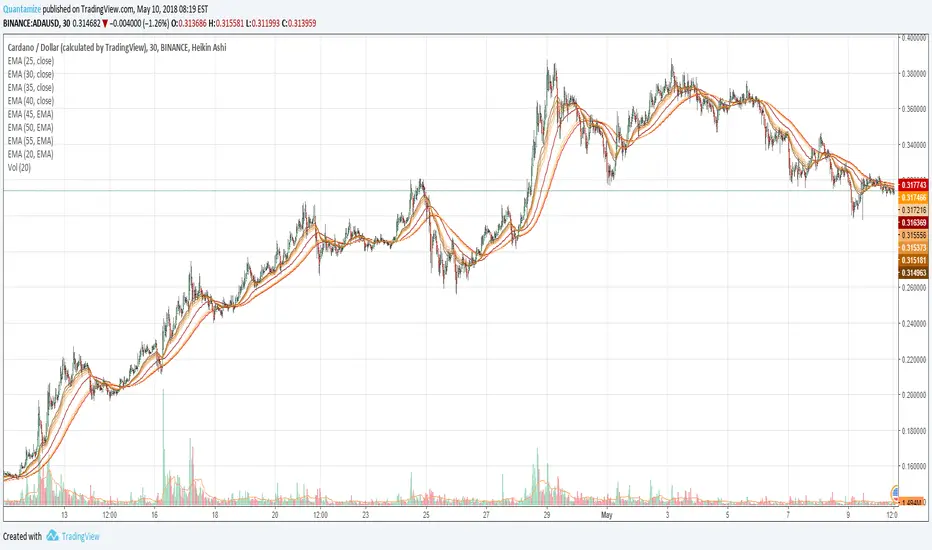
Cardano / ADA is in the strong demand zone and has bounced off 50 day EMA and has broken downtrend line.
I dont see ADA as a good buy only if Bitcoin will fall below 8200, that would made this strong demand zone, strong ressistance zone.
Moving on the chart.
Downtrend line broken, Strong demand zone, few supports and ressitances ideal for buys and sells.. not much to say. Oh yes, slight uptrend.
What does the Indicators says?
Not looking so good, ADA may see lower levels in this zone such as 2950 - which may lead to strong bounce upwards.
RSI - Failed to hold at support.
MACD - sellers dominance over buyers, failed to hold divergence.
Stoch is at the bottom giving buy signal, for me is stoch like a fast MACD which can lead to MACD curve.
Also daily Fractal has told me that at 50 day EMA there is strong support.
So I think thats about it.. If you have any Questions feel free to ask me down bellow or at my discord channel!
Hope I made your view on whats going on with ADA somehow clearer.
If you like this Technical Analysis let me know in the comments, Likes are aprreciated, Thanks !
If this gets a little bit of attention, I will do an update!

ADA BTC Bittrex 4H up to 16MAY18 Crypto Trading Analysis (TA)BITTREX:ADABTC
4H Chart, also works on 1H, at this time Cardano (ADA) has tested the SUPPORT ZONE by the third time since May 11 hovering over it for 4 days since May 16, gaining strength to go up. The 50, 100, 200 MA Indicator is increasingly separating its 100/200 days signals (Orange Arrows), but the Stochastic RSI Index (Blue Arrows) is pointing toward a Bullish situation and the MACD even though has been diving bellow the Histogram for a while, we could spect it to move upwards for fresh air on the surface in the next hours. But remember, this is our optimistic approach, keep in mind that is plenty of sea to dive a deep more always. At this time the Market Cap is struggling on the 382 Billions and BTC is trying to reach the $8.5K. Good Luck!
4H Chart, también funciona en 1H, en este momento Cardano (ADA) ha probado la ZONA DE APOYO por tercera vez desde el 11 de mayo, surfeando sobre ella durante 4 días desde el 16 de mayo, ganando fuerza para subir. El indicador 50, 100, 200 MA separa cada vez más sus señales de 100/200 días (Flechas Naranja), pero el índice RSI estocástico (Flechas Azules) apunta hacia una situación Bullish y el MACD a pesar de que ha estado buceando debajo del Histograma por un buen tiempo, podríamos esperar que se mueva hacia arriba para tomar aire fresco en la superficie en las próximas horas. Pero recuerde, este es nuestro enfoque optimista, tenga en cuenta que hay mucho mar para bucear más profundamente. En este momento, Market Cap está luchando en los 382 Billones y BTC está tratando de alcanzar los $8.5K. ¡Buena suerte!
"Bitcoin will do to Banks what Email did to Postal Industry / El Bitcoin le hara a los Bancos lo mismo que el Correo Electronico hizo a la Industria Postal"

Cardano Machine Learning Crypto Signal The rolling three-day signal for Cardano (ADA) is "Buy". This is day one of the three-day signal. The signal will be updated again Friday. For further details or discussion, feel free to leave any questions or check out signature/profile.
Cardanoa Machine Learning Crypto SignalThe rolling three-day signal for Cardano (ADA) is "Don't Own". This is day two of the three-day signal. The signal will be updated again Saturday. For further details or discussion, feel free to leave any questions or check out signature/profile.


Cardano .I made main lines from lows and highs.
I want to wait , how Cardano breaks that pink diamond.
You can see, how exactly diamond found place between most important retracements.
It´s a lot of room between FIBO.
I ´m owning ADA yet, so It´s just an idea to watch.
Please do not trade by my charts.
* This is nor a financial advice.
*Only for educational pursposes.

Cardano Machine Learning Crypto SignalThe rolling three-day signal for Cardano (ADA) is "Don't Own". This is day two of the three-day signal. The signal will be updated again Saturday. For further details or discussion, feel free to leave any questions or check out signature/profile.
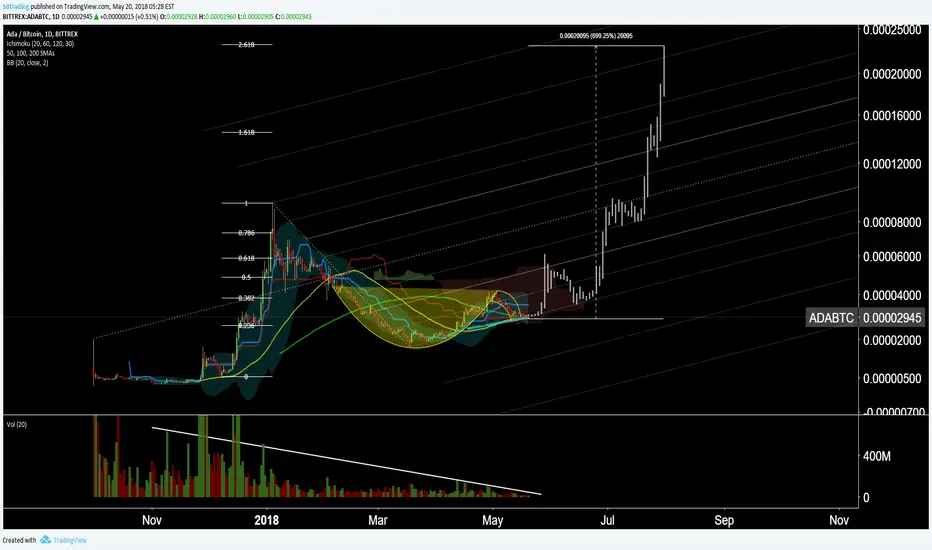
Cardano Upside potentialCardano (ADABTC) has been dropping following the rally from the last few weeks.
Price broke the daily ascending trendline and is now heading to the support level around 0.00003.
If price reacts from the support level, we can expect a new rally and new short term highs up to the resistance area around 0.00005.
If price breaks the support level, the next support comes at around 0.000023.
Good Luck,
CryptoTrendline

Cardano $ADA | Time To Get Back In | Trade 2 | 5/8This will be Trade 2 for my "0.01 $XBT to 1 $BTC" Bitmex series!
All targets were hit in the first run for a nice 2x. (Click the picture above to track first trade)
Now we are going for 6 targets for 75% + run. (I'll be using Leverage to allow even higher profit levels)
Buy Zone: ~3500 sats
TARGET 1 ~4050-4200 sats
TARGET 2 ~4400-4550 sats
TARGET 3 ~4800-4950 sats
TARGET 4 ~5200-5350 sats
TARGET 5 ~5650-5800 sats
TARGET 6 ~6000-6200 sats

Cardano Machine Learning Crypto SignalThe rolling three-day signal for Cardano (ADA) is "Don't Own". This is day three of the three-day signal. The signal will be updated and shared again tomorrow. For further details or discussion, feel free to leave any questions or check out signature/profile.


Cardano's time?Something like a Cypher (in red the valid one) could be in formation (green)... but obviously it isnt a valid Cypher... looks more like a variaton (Nen-Star).
Anyway, in Cyptospace things are a bit messy and levels can be easily moved ... so.. just to have in consideration, we could see ADA explotion very soon.
Cause Im a real newbie student here.. this is just for educational uses and al comments, teachings, corrections, etc., are welcome!
Thanks!
GoodTrade
-CJ-


ADAUSD analyse, predictionNow we need to stay in uplink channel (pink lines). If we dont break it in down, we can jump up to red top line then we can break it or bounce back.


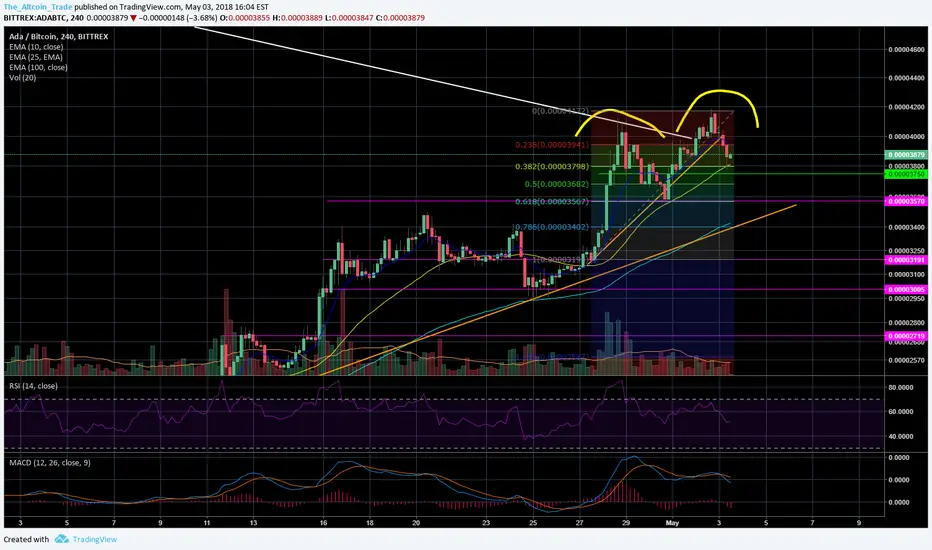
Ada make us great again!Greenbox -> Targets
Redbox -> Support
Ada will make us some good profits in short mid and longterm, IF our btc is stable and goes sideways :)

Cardano Machine Learning 3-Day Crypto SignalThe rolling three-day signal for Cardano (ADA) is "Buy". This is day ONE of the three-day signal. The signal will be updated and shared again on Sunday. For further details or discussion, feel free to leave any questions or check out signature/profile.

Cardano Machine Learning 3-Day Crypto SignalThe rolling three-day signal for Cardano (ADA) is "Buy". This is day two of the three-day signal. The signal will be updated and shared again on Thursday. For further details or discussion, feel free to leave any questions or check out signature/profile.

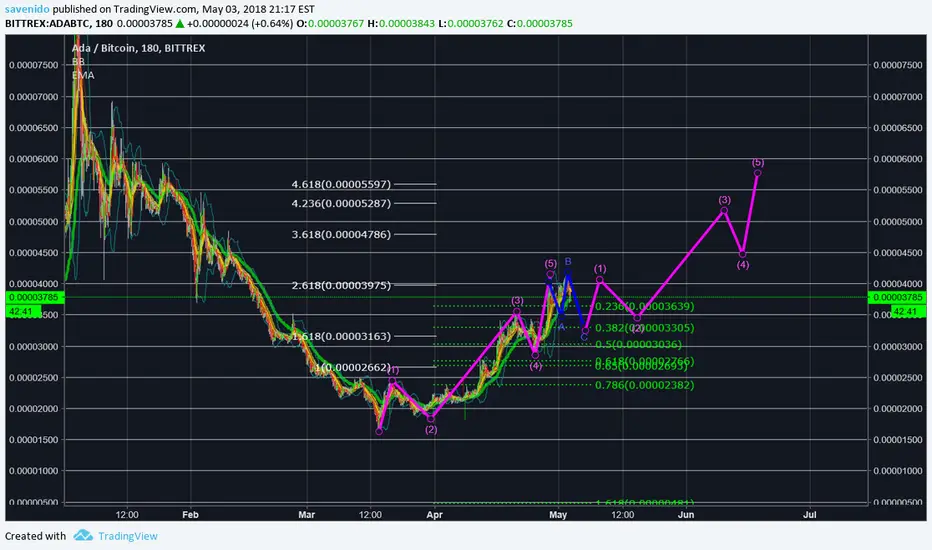
Cardano Upside potentialCardano (ADABTC) is in consolidation following the rally it made last week.
If the rally continues we can expect price to reach the resistance level around 0.00005.
If price goes down, the next support level is just below 0.000035, which coincides with the ascending trendline.
If the support and trendline are broken, we can expect price to go down to the next support area around 0.00003.
Good Luck,
CryptoTrendline
