Cardano 1.638 target-rangeMy analysis reflects a positive fluctuation (target 1,638).
The analysis consists of these 4 different levels.
A support level (fluctuation level) of 0.951 and a stronger support level of 0.8.
A resistance level of 1.34 and a target of 1,638.
I have positioned my purchases at these support levels as both levels are extremely strong. The ongoing price declines have been due to the fact that bitcoin has been through a hefty hardship, which has led to an all-coin crash. I do not think we have reached a bottom, but a position at one of these support levels can ensure a positive return when the crypto market turns around.
CARDANOADA

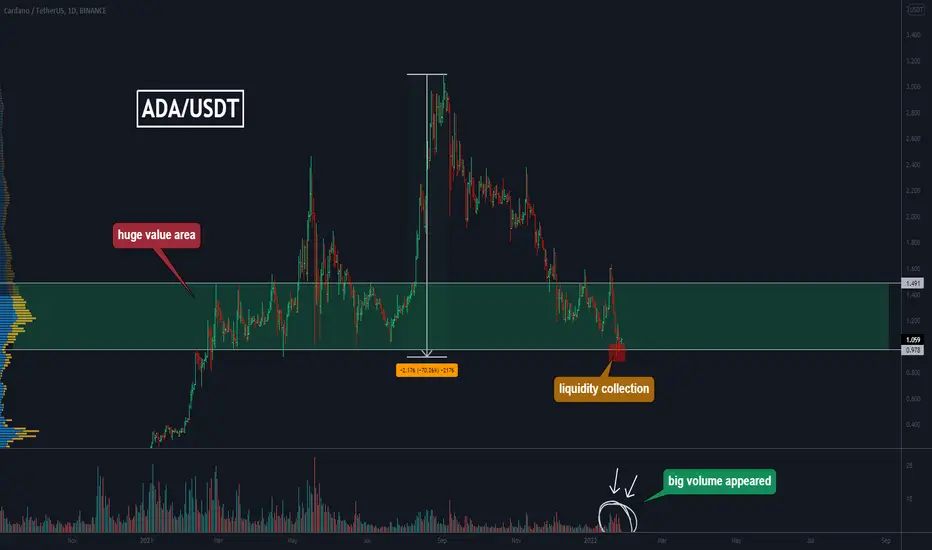
ADA, why you should buy now using the "DCA" strategy!ADA corrected 70% from its highs. Price has collected liquidity below the very important key $1 level. Also, very positively, big volume has appeared at the bottom. When to buy if not now? This is a good time to buy on a DCA strategy. Yes, the price could fall even lower, maybe even 90% of its high, but with a DCA strategy you will have a good average buy price.
Write in the comments all your questions and instruments analysis of which you want to see.
Friends, push the like button, write a comment, and share with your mates - that would be the best THANK YOU.
P.S. I personally will open entry if the price will show it according to my strategy.
Always make your analysis before a trade.
Where are ADA's BULLS? 🦬Hi everyone 👋🏽
🕊 Wish y'all have a profitable lifestyle 🍀
📌 ADA /USDT - Daily Time-Frame - Heiken Ashi
📌 Elliott Wave - Channels - Fibonacci - Price Aaction
📍Cardano is looking a little bit confusing in my eyes; it has already lost a very major support zone 2.0$ (which I personally did not think might have happened)
📍By the way, ADA is still bullish in 1.55 - 1.66$ price zone levels and may have a reversal from there!
📍 Cardano has already retraced about 50% of its previous wave which can be the 5th wave of the last cycle; it is so potential that it retrace about the 61.8% which can be the 1.55-1.60$ price range.
✍🏼 The 5th wave target is around the 3.64 price zone minimum
✍🏼 We are still the first wave of the 5th wave elliott
✍🏼 What I see from daily to one hour time frame just indicates bearish signs
✍🏼 I the daily time frame I can see a falling wedge triangle that may not be a good news for the price
THIS IS NOT A FINANCIAL ADVICE
PLEASE DO YOUR OWN RESEARCH BEFORE ENTERING ANY SELL AND OR LONG POSITION
GOOD LUCK
NP TRADER

ADA Bullish The price of Cardano has been suffering from intense bearish pressure due to the lack of dex's on its ecosystem and with the Cardstater and Sundaeswap current conflict, there will be a bit more pressure.
Cardano has reached close to its all-time low within the last year of about $1.00
However, the Sundaeswap addressing the issue with their mainnet release which includes liquidity, congestion, and trouble of certain wallet integration I believe that their problems will be resolved within a few months. They have been having AMAs addressing all their current problems and doing press releases including sundaeswap-finance.medium.com
The Cardano ecosystem has many more important releases this year including hdrya and basho that will greatly improve congestion problems and with the release of more dex's this year, there will be more need for the use of the ADA token. It is important to know that the TVL has increased by 3x within one week to about 95 million.

ADA, CARDANO, DAILY TRADE, SIGNAL#ADA had a little recovery as result of opportunistic buying from those convinced the market has either hit, or is near, the bottom. Worth a trade but with caution as rejection at key resistance will send $ADA back to $1

ADA - A Long Way to GoADA boasted an inflated market cap through last year. There was no real justification for its value, because there was no true working product - or at least something which was on the verge of mass adoption. It was pure speculation of what 'might' be and not grounded in anything but hope.
So, ADA has been flying high for a long time and was way too close to the sun when it hit $3.10 a coin. It is a well overvalued project and anyone suggesting it will return to its ATH in the near future is creating false hope founded in the same fictional claims.
At best, I see ADA hitting the approximate $0.45 mark. However, considering where the project was valued this time last year and no real changes since then in terms of tech, ADA still has a long way to tumble. Don't mistake the most recent pump as anything other than squeezing the last little bit out of the coin, before its demise.
The market is down and ADA is going to continue to decline until the time the true leaders in the field begin recovery.

Why ADA Looks Bullish?ADAUSDT (Day Chart) technical analysis Update
ADAUSDT currently trading at $1.11
ADA is already dropped 70%+ from the top
In the chart you can see price reversing from the major support zone, ADA is already up 18% from today's bottom, I’m expecting ADA can go up from the current support zone.
if the price breaks $0.90 support then we can expect one more drop in ADA.
Recommend to buy it on the spot market.
buy level :$1.00 - $1.10
Stop loss:$0.82
Target 1: $1.50, Target 2: $2.30, Target 3: $3.00

CARDANO LONG TERM BULLISHCardano's price can go much higher than expected in the future. Other a lot of crypto is now on the 5th wave to finish the rally but Cardano is most probably waiting for the 3rd wave to push higher. Some people can count the recent top as a 3rd wave but I am counting this as a 1-2, 1-2 because if you count as a 1-2-3-4 then there is an overlap happen between 1 and 4, so most probably the recent top out of $3.09 is not a ((3)), It's actually (1) of ((3)). It may be the 5th wave as an extended leading diagonal and if it's leading diagonal then also it should push higher because in an expanding leading diagonal wave 3 must be greater than wave 1 and wave 5 must be greater than wave 3.
For the short term most probably it finished the second wave as a complex correction around the previous 4th or it may be down to the lower sider for finish correction. For now, the trend-line is the resistance point for bullishness.
DISCLOSURE - Please be informed that the information I provide is not a trading recommendation or investment advice. All of my work is for educational purposes only. All labeling and wave count have been done by me manually and I will keep changing according to the LIVE MARKET PRICE ACTION. So don't bias, hope on my trade plans. Try to learn Elliott Wave or other strategies and make your own strategy. Following is not that much easy. I am not responsible for any losses if u took the trade according to my trade plans.
#ADA #CARDANO #ELLIOTTWAVE

Cardano(ADAUSD) IN IRREGULAR CORRECTION SHORT TO $0.8Macro-level
Looks like we are still in Wave 3 of the 5 wave series for Cardano(ADAUSD)
The Wave 1 was completed in 2018 at $1.3
Wave 2 ran for a very long period till end of 2021
We are now in wave 3 for the bigger wave cycle
Wave 3 is an impulse wave with 5 sub-waves (1-2-3-4-5)
In the bigger Wave 3 we are in sub-wave (2)
Looks like Sub-wave 2 is making an irregular correction (A-B-C)
Micro level
In a complex A-B-C irregular correction the waves are subdivided into 3-3-5
W(A) is a 3 wave ended at $1
W(B) is a 3 wave structure and ended above the start of wave(A) at 1.38% extension of W(A)
Wave(C) is a 5 wave and drastically drops to the end of W(B) or even a little lower to 1.618% of Wave(A)
We are now in the 5 wave series of Wave(C) - its at sub-wave(4)
If we are in the downward cycle with the whole crypto market going down, my guess is this might end at 1.618% at
$0.81 in the next few weeks
Please comment and appreciate your feedback

ADA CardanoHello This Is My Technical Analysis For ADA(Cardano) Crypto Follow & Like And If You Have Question Comment I Answer Good Days And Good Trades.

Bullish Divergence RSI! #ADAHey there! Noticing the Bullish Divergence RSI on the 15m Chart! #ADA. Let's hear what everyone thinks! Bitcoin seems to be leading an assortment of alternative coins so I'm still learning how much weight to put on Chart Analysis. It seems to apply well, however, what happens if, let's say MicroVision would dump? I presume there is not much of a leading indication of that happening, but following, the indicative analysis would adjust quite rapidly. It seems to still be quite a lottery call in my opinion. I've noticed, the shorter the time frame, the less percentage gain on trades, but the more instantly rapid and accurate are the indicators, so you can score more often (fee's are hard to deal with though, even 1.002% raises my average about a penny on these lower priced crypto and thats almost a whole run on the minute, less of a run on the 5). What time frames do you all use?! I am trying them all out and learning my best which fits my trading style!
Thanks and Happy Trading!
-Eric-

ADA Flight for Cardano is provided, the only question is whitherWe are analyzing the "first order" from the voting under the idea of "Bitcoin weekend №17"
If you look at the ADAUSDT chart, you can see that the price is moving upward in a channel.
And if we draw this channel by the highs and lows, we will see that the price moves exactly from border to border.
Today the ADAUSD price has stopped at the level of $2.88 so far. The sellers did not even let them approach $3.00, because the channel border is a bit lower.
In fact, in two weeks the price of ADAUSDT increased by x2 from $1.44 to $2.88
If you look locally, the breakout of the $1.50 level upwards took place on increased volumes and buyers did not even give a chance to test this level for strength from above.
However, if you look at the entire movement of the ADA price in the channel, we will see that trading volumes are fading and over the last month they are just scanty in comparison.
Now we would like to see a correction in the price of the Cardano token in the range of $1.73-1.93 , we will take the average price of $1.83 as a basis.
And when and if the price reaches this zone, then we will analyze: the nature of the price movement, at what volumes the price movement will be and in general what mood will reign in the crypto market in the future.
After this analysis, it will be easier to predict which further variant of the ADAUSDT price movement will be more probable. Since now, theoretically, there are equal chances for the price of ADAUSD to renew the maximum to the $4.30 region or to begin a deep correction to the $0.40-0.50 region.
_____________________
Do you like the idea fulfilment? Does it help you trade and make a profit?
Do you want more forecasts from us?
Give us motivation! (Like, comment and donate). These little things won't make us rich, but they will warm the trader's soul while writing the next idea!

ADA is ready to fly!Breakout has happened as I expected. Now bulls must keep the ADA price above 1.5$ to see another uptrend.
Buy your ADA above the current support area, But be aware that a fake breakout can happen, So set your STOP LOSS carefully. Also set stop loss for sure!
Write your question in the comments, I'll answer.
Also, see my previous ADA analysis for sure, That's related to this analysis.

CARDANO TREND CHART Hello trading friends,
✅IF Cardano holds the level of 1.47 with confirmation trend and the time frame it can increase further.
An interesting trend to check out.
Manage the risk fine. it's crypto and with all risk on all sides.
Have a great day.

ADA Cardano price target ADA Cardano bounced from the strong support area after being oversold.
It also formed a bullish divergence.
Price target is the $1.46 resistance.
Looking forward to read your opinion about it.

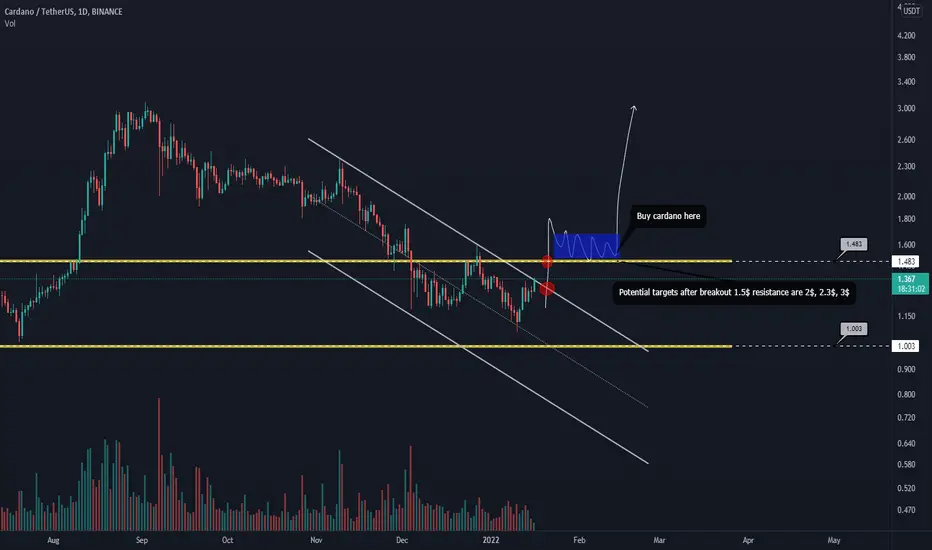
Cardano is pumping but don't buy it yet!Cardano is going to break out the strong descending channel top, Also we need to see a breakout of 1.5$ to be sure of future positive movements.
Personally, I will buy ADA after stabilization above 1.5$. Don't forget that, Buying this coin before the breakout of 1.5$ is so risky.
ADUSD Has Reached Strong SupportADA has reached a very strong support area on the daily time frame
From here it will likely bounce bullishly off the support

Cardano is going to see 1$, Can I buy there?Cardano is making Lower lows!
ADA is making lower lows as you can see, Therefore I think this downtrend's destination is around 1$.
1$ is so strong and I think a bounce there can happen, Buying a step there, Is wisely.
Good Luck

CARDANO (ADA) TO THE DOWN SIDECardano is going to make make a new low around $0.90 to finish the correction as a WXY complex correction on the 4th wave. We are currently on the 3rd wave of the C of (Y) of ((4)). Most probably we can see the bounce from trend-line support and for now no buy position.
DISCLOSURE - Please be informed that the information I provide is not a trading recommendation or investment advice. All of my work is for educational purposes only. All labeling and wave count have been done by me manually and I will keep changing according to the LIVE MARKET PRICE ACTION. So don't bias, hope on my trade plans. Try to learn Elliott Wave or other strategies and make your own strategy. Following is not that much easy. I am not responsible for any losses if u took the trade according to my trade plans.
#cardano #ada #adausdt

ADA CARDANO🧨🧨🧨100% Profit 2 monthHello, all my dear friends, I left the analysis of Cardano. In the analysis of Cardano, you see what you have, especially in these cubes. We see numbers with the numbers of support and resistance that exist. I showed myself based on analysis and forecast. In 51 days, Ada Cardano will start the uptrend from $ 1 to $ 2, and the downtrend of the third wave will start at the same time with the third downturn of Bitcoin and will go up to 38 cents.
My servant Manouchehr Azar, I am your friend from Iran, I speak Persian. I expressed my analysis on YouTube in Persian. Unfortunately, I was not fluent in English.

ADA difficult situation ADA will soon test the support line and we will see if there will be another correction (BTC influence) or a strong rebound and a new strong uptrend (when BTC starts to grow)

Cardano's price AnalysisNothing has changed in its price.
Price is still trading in its accumulating zone and still moving in its downward parallel channel.
It could be forming a cup and handle pattern.
By measuring the height of the cup or measuring the height of the parallel channel. The next possible target is the same as mentioned as the next possible ATH. To check this I even used Fib extension and it shows the same target.
Still sharing support and resistance area along with possible next ATH.
Note: these are just my observation. Kindly #DYOR

COTI DAILY LONG$Coti on the daily chart is getting squeezed tight between the 21SMA and 50SMA. The RSI on the daily has crossed over the RSI 200SMA which has indicated in the past the $Coti is primed for a move to the upside. Increase in volume is confirmation that this time will be no different. Coti is scheduled to handle the first released $ADA Cardano stable coin $Djed at some time in the near future Q1 which maybe the reason for the increased interest in Coti. With an ATH of .7074 I expect Coti to challenge this within the next few weeks. The momentum of all Cardano projects is picking up steam as a report came out this week that ADA leads the charge in all of crypto in active development. The only real level Coti has as a resistance on the daily, 0.5266 and 0.6480
