ADA Faces ☁️ - Time to Short? Most altcoins face bearish trading conditions in the next 24 hours, ADA included. Over a one-week horizon, these bearish and cloudy trading conditions will spill over to Bitcoin which is likely to face downside risk, just as Ether, Ripple’s XRP and Cardano.
“The Cardano network has no meaningful use or any credible track to get it,“ according to K33 Research, singling out the fact that there are no stablecoins issued using the Cardano blockchain.
“No USDT or USDC in a network generally means that no meaningful decentralized finance (DeFi) occurs, and that Tether and Circle attest to this because if something went on, they would issue stablecoins there,” the crypto research consultancy said.
“All price signals also point to Ada gradually disappearing from the crypto map. Ada has not rallied in line with other ‘stronger’ smart contract tokens when markets have improved, which is a strong indicator of a dying coin,” K33 Research warns.
Follow us for more crypto weather reports!
Cardanoanalysis

ADA → Cardano Gearing up for a Reversal? Let's Answer.ADA has been on a strong bull run since October of this year and we've finally come to the end of a measured move and three legs up. Are we gearing up for a reversal?
How do we trade this? 🤔
We don't have enough evidence for a short entry just yet, but we do have some key data points in our favor. We've completed a measured move to the current price, had three pushes up in a bull trend, two failed attempts to break $0.68, and a gap down below the large bull candle.
What we're missing are the sell confirmation candles. ADA needs to break below the Daily 30EMA, close a strong bear candle, and possibly test the 30EMA as resistance before we enter a short. The re-test of the 30EMA as resistance isn't required, but would add to the probability of profit if achieved.
Once these conditions are met, it's reasonable to enter a 1:1 Risk/Reward Ratio trade around $0.565, placing a protective stop around $0.70, which puts your take profit at $0.43 above the previous high or "Support Zone". This is a conservative trade because we have several areas of support to consider.
💡 Trade Idea 💡
Short Entry: $0.565
🟥 Stop Loss: $0.700
✅ Take Profit: $0.430
⚖️ Risk/Reward Ratio: 1:1
🔑 Key Takeaways 🔑
1. Potential Double Top after there pushes up. Bias to Short.
2. Large Pin Bar Top on Second Attempt.
3. Wait for break below Daily 30EMA to Enter Short.
4. Large Bull Bar after Breakout, Gap to Close.
5. RSI at 57.00 and below Moving Average. Bias to Short.
💰 Trading Tip 💰
Reversal trading is inherently low probability because you're betting against the trend. The tradeoff is your reward will be much higher if you swing trade it. This kind of trade is the inverse of trend trading, where the probability is higher but the reward is lower.
⚠️ Risk Warning! ⚠️
Past performance is not necessarily indicative of future results. You are solely responsible for your trades. Trade at your own risk!
Like 👍 and comment if you found this analysis useful!

ADA LONG SETUPHi, dear traders. how are you ? Today we have a viewpoint to BUY/LONG the ADA symbol.
For risk management, please don't forget stop loss and capital management
When we reach the first target, save some profit and then change the stop to entry
Comment if you have any questions
Thank You

ADA → Cardano Ready to Rip? Or Dip? Maybe $0.72 before Reversal.Cardano has been on a ride along with the entire crypto market for months and with a bull flag playing out, looks like we're going to get a little more upward price action. Should we long here?
How do we trade this? 🤔
We need to wait for a pullback to at least the 30EMA, maybe the 200EMA, whenever we see some bullish price action in response. A strong bull signal bar closing near its high and a confirmation candle are preferable. This gives us the necessary probability to enter a long and place a protective stop below the 200EMA around $0.59. Plan to take half profits at 1:1 Risk/Reward around $0.63, move your stop loss up to the entry price to secure profits, then take profits at the next reversal signal or at 1:3 Risk/Reward around $0.727.
We need to be aware that on the higher timeframes, Bitcoin and the crypto market is running hot and we should be on the lookout for a trend change. Either to a trading range and/or a reversal to the downside. We need to close a few more weekly candles to get an indication of the next market moves on the higher timeframes.
💡 Trade Ideas 💡
Long Entry: $0.630
🟥 Stop Loss: $0.599
✅ Take Profit #1: $0.630
✅ Take Profit #2: $0.727
⚖️ Risk/Reward Ratio: 1:3
🔑 Key Takeaways 🔑
1. Bull Flag after a Bull Run, Bias to Long.
2. Near Flag Resistance, Wait for a Pullback.
3. Gap to 1HR 30EMA and 200EMA, Wait for Pullback.
4. RSI at 64.00, Above Moving Average. Bias to Long.
5. Take half profits at 1:1, Remainder at 1:3.
💰 Trading Tip 💰
Bull flags in the proper context, provide over a 60% probability that a trend will continue. This provides justification to enter a long trade.
⚠️ Risk Warning! ⚠️
Past performance is not necessarily indicative of future results. You are solely responsible for your trades. Trade at your own risk!
Like 👍 and comment if you found this analysis useful!

ADA → Cardano Failed to Break Resistance Zone. About to Fall!?Cardano had a failed breakout above the Resistance Zone at $0.62, followed by several failed attempts to break it again. Does this mean we enter a long?
How do we trade this? 🤔
Entering a short right now is reasonable if you accept the low probability nature of reversal trading. The number of failures to break the resistance zone are great signals to enter a trade, but additional confirmation to the downside with a strong bear candle is preferable. Due to the current distance to the proper stop loss placement above the Resistance Zone, it's reasonable to take a 1:1 Risk/Reward Ratio trade down to the support zone. Use a smaller position size given the additional risk.
💡 Trade Ideas 💡
Short Entry: $0.575
🟥 Stop Loss: $0.665
✅ Take Profit: $0.485
⚖️ Risk/Reward Ratio: 1:1
🔑 Key Takeaways 🔑
1. Failed Breakout at Resistance Zone, Sell Signal.
2. Failed three times to break Resistance Zone after Signal, Confirmation.
3. Gap to Daily 30EMA and Support Zone.
4. RSI at 60.00, Below Moving Average. Bias to Short.
5. Watch for Bitcoin Trend Change at $46,000.
💰 Trading Tip 💰
Price seeks balance and will naturally move toward moving averages. Trade with the trend for maximum probability, but also expect gaps between the price and moving averages to close before they widen.
⚠️ Risk Warning! ⚠️
Past performance is not necessarily indicative of future results. You are solely responsible for your trades. Trade at your own risk!
Like 👍 and comment if you found this analysis useful!

ADA → Cardano Ascending Wedge Signals a Drop! Will It Happen?Cardano is forming an ascending wedge pattern, a bearish formation that the majority of the time ends in a fall below the support line. For the next few days, we need to consider that the probable outcome.
How do we trade this? 🤔
Consider waiting for one more attempt to break resistance at the top of the wedge around the $0.68 area. A rejection at that level creates a reasonable reversal entry for a 1:2 Risk/Reward Ratio trade. Target the $0.52 range where previous support was demonstrated.
Don't be too hasty to enter, we're still in a bull trend and ought not bet against the trend until all of the requirements are met. This includes a strong sell signal (large wick on top, price closing near or on its low), followed by a confirmation candle or candles (strong bear candles closing on or near their lows). It's greater probability of profit if that confirmation candle closes below the 1HR 30RMA.
💡 Trade Idea 💡
Short Entry: $0.6400
🟥 Stop Loss: $0.6986
✅ Take Profit: $0.5230
⚖️ Risk/Reward Ratio: 1:2
🔑 Key Takeaways 🔑
1. Ascending Wedge, Bias to Short.
2. Daily Measured Move Complete, Trend Change Probable.
3. Three Pushes Up in a Bull Run, Trend Change Probable.
4. 1HR RSI at 50.00 on Moving Average, Indecision.
5. Bitcoin at Risk of Trend Change, Supports Short Bias.
⚠️ Risk Warning! ⚠️
Past performance is not necessarily indicative of future results. You are solely responsible for your trades. Trade at your own risk!
Like 👍 and comment if you found this analysis useful!

ADA → Cardano Coming Down! Where Will We Land? Let's Answer.Cardano had a fantastic measured move event from the breakout point on October 23rd, a move that I overlooked in my last couple of analysis! The price shot up from $0.27 to $0.41, pulling back into a bull flag, then ripping up from $0.41 to $0.62! Now that the move is complete, where do we go from here?
How do we trade this? 🤔
The measured move is usually followed by a trading range, which can turn into a continuation pattern over time *OR* a reversal to the downside. We need more price action to determine the next moves. Right now we have a market that is burning hot on the upside, and RSI that is over 70.00, and the massive bear candle from last night that showed the bulls taking profits at this key level.
Right now, we need more price action to justify an entry. Given the current datapoints, we should expect some sideways price action until the 30EMA catches up, but its likely we'll fall down toward the previous Resistance Zone that may not act as support. The test of that zone will give us strong evidence as to the next moves for Cardano. We need to see a strong bull signal and confirmation bar to justify a long. An RSI level of 50.00 or below would be ideal as well.
Until then, it's reasonable to stay on the sidelines until more price action plays out.
💡 Trade Idea 💡
Long Entry: 0.482
🟥 Stop Loss: $0.437
✅ Take Profit: $0.572
⚖️ Risk/Reward Ratio: 1:2
🔑 Key Takeaways 🔑
1. Measured Move Complete! Trading Range or Reversal Likely.
2. Previous Resistance Needs to be tested as Support.
3. If Support Holds, Could go up for another test of the Previous High.
4. If Support Fails, Expected Lower Lows around 200EMA.
5. RSI at 70.00, Above Moving Average. Bias for Short-Term Short.
⚠️ Risk Warning! ⚠️
Past performance is not necessarily indicative of future results. You are solely responsible for your trades. Trade at your own risk!
Like 👍 and comment if you found this analysis useful!

ADA → Cardano Racing Toward Resistance! Will We Reverse!?Cardano is racing toward the Resistance Zone after a successful break to the upside from last week's bull flag, as predicted in our last analysis. We're getting closer to resistance and the big question is, do we short it?
How do we trade this? 🤔
If you're still in a long from bull flag breakout, good! Don't exit yet as we have not seen a reversal signal. ADA likely will make it to $0.45, I would take profits around that price area. Once we hit the resistance zone it's reasonable to expect a pullback or even a reversal. If we get a bear signal bar followed by a confirmation bar closing on or near its low, it's reasonable to short.
We are in a bullish macro trend, so a short would be playing the reversal where Probability is low, but Risk/Reward is over 1:2. I would take half profits at 1:1 around $0.422, move the stop loss up to your entry price and swing the rest until we see the reversal bar to the upside.
💡 Trade Idea 💡
Short Entry: $0.446
🟥 Stop Loss: $0.468
✅ Take Profit #1: $0.422
✅ Take Profit #2: $0.403
⚖️ Risk/Reward Ratio: 1:2
🔑 Key Takeaways 🔑
1. Bull Breakout of 200EMA Followed by Bull Run.
2. Bull Flag Continuation Pattern Playing Out.
3. Resistance Zone Approaching, Look for Sell Signal.
4. Do Not Short Until Sell Signal and Bear Confirmation Candle Close.
5. RSI at 65.00, Above Moving Average. More Up Before Down.
⚠️ Risk Warning! ⚠️
Past performance is not necessarily indicative of future results. You are solely responsible for your trades. Trade at your own risk!
Like 👍 and comment if you found this analysis useful!

ADA → Breaking $0.40! This Analysis Shows a Cardano Moon Shot!Cardano is showing great bull strength toward the $0.40 price and has made a few attempts to break it! We're in the midst of a trading range pullback from the previous bull run waiting for the signal to go long.
How do we trade this?
Our bias for ADA should be bullish! We're fresh off of a bull run and are currently in a pullback. Much of the crypto market is in a similar holding pattern, including Bitcoin which has not yet broken its Weekly Resistance. Before jumping into a long, we likely need another pullback to the 30EMA and a strong bull signal bar followed by a strong confirmation bar closing on or near its high. Once those conditions are met we have a potential run to the next Resistance Zone at $0.45!
Always be ready to change your bias. The next attempt to break resistance could result in a bear signal bar, along with Bitcoin, which signals a market reversal. We will consider the chart at that time but for now, watch for the bull signal bar to long!
Trade Idea
Long Entry : $0.375
Stop Loss: $0.353
Take Profit: $0.440
Risk/Reward Ratio: 1:3
Key Takeaways
1. Bull Breakout of 200EMA Followed by Bull Run. Bias to Long.
2. Bull Flag Continuation Pattern, Bias to Long.
3. Look for Support at 30EMA.
4. Do not Long until Bull Signal and Confirmation Bars Appear.
5. RSI at 55.00, below Moving Average. Bias to Short.
You are solely responsible for your trades, trade at your own risk!
If you found this analysis helpful, click the Boost button and let us know what you think in the comment section below!

ADA Failed to Break Down! Will The Price Rocket to the Upside?ADA failed to break down after the triple top failed! The minute that bull bar on November 21st at 19:00 closed near its high, a short position should have been closed for a break even. We're still below the resistance zone. It would have been reasonable to long that bar given the multiple failed attempts to break to the downside.
How do we trade this?
The price is currently sitting at resistance in a bull trend. We should be waiting for either a strong bear signal bar to short or a breakout above the resistance zone to long. Bitcoin is in a similar situation, and we should wait for the signal before entering.
If we get a bull breakout bar closing on or near its high above the resistance zone, it's reasonable to long. Place a protective stop below the resistance zone and a 1:2 Risk/Reward ratio to the upside.
Don't trade a bull breakout bar until it closes and shows support above the resistance zone. That bar could quickly become a bear signal bar in which case, we're looking for a bar closing below the resistance zone on or near its low. A break below the channel support with a bar closing on or near its low would give us enough probability of profit to short with a tight stop, playing the reversal. We are in a bull trend, make sure the signal and confirmation are clear with tight stops.
Key Points
1. Fanning Bull Channel, Bias to Long
2. Resistance Zone Still in Play
3. Failed Triple-Top Reversal
4. RSI at 56.00 above Moving Average, Indecisive.
5. Bitcoin at a critical moment. Breakout or Breakdown?
You are solely responsible for your trades, trade at your own risk!
If you found this analysis helpful, click the Boost button and let us know what you think in the comment section below!

ADA SCALP SHORT SIGNAL Hello dear friends,
In the 15-minute time frame, Cardano has shown a potential setup for a suitable short position.
I am in a hurry to share this post since it is a scalp position, and there is no time for detailed explanations.
Wishing you success and profitability.
Be sure to consider risk management and capital preservation.

ADAUSDTThis is a 1D frame analysis for ADAUSDT The price of Bitcoin has tested its static support band for some time and is currently above the support line. The candle has started to move upwards with a shadow a few days ago, and we can expect a price increase, but keep in mind that as long as the price is above the support line, we can expect a price increase. If the price can maintain itself above the support line, it can experience higher prices for a long time. But don't be fooled, it is possible for the price to go slightly higher and be pushed back by selling pressure and experience more volatility. We have mapped out support and resistance areas for you dear friends so that you can use them in different situations.

Cardano- i read many peoples complain about ADA on Twitter.
- Like the project is bad and going to nowhere.
- As Trader my job is only to do the Math and check pourcentages.
- i care about what peoples speak but i verify and deduct.
-----------------------------------------------------------------------------------------------------
So let me do Little Math for Cardano :
-----------------------------------------------------------------------------------------------------
- in 2018 if u bought ADA at Bottom ( 0.017$) you could have made +6500%
-- So if u invested 10k$ you could have returned $660,000
-----------------------------------------------------------------------------------------------------
- in 2020 ADA returned the same bottom level ( 0.017$) then made +16160%
-- So if u invested 10k$ you could have returned $1,626,000
-----------------------------------------------------------------------------------------------------
- So Now i don't think we gonna see again 0.017$ in entire Cardano Life.
- So haters gonna hate but Cardano made the Job.
- Just have to buy at the good time and be patient.
- if you bought the TOP, it's not Cardano fault, but your own fault!
- Next Target could be around 7.5$ (+3000%)
Happy Tr4Ding !

Crypto Update: ADA gearing up for new push higher?Today's focus ADA
Pattern – HL support hold
Possible targets – .3550
Support – .3550
Resistance – .3665 - .3770
Looking at ADA today, we can see a few bullish signs coming into play. We have run over them in today's analysis, and the rejection signs we will also be looking out for. Effectively we want to see support continue to hold and feed a new rally. If we do see this, we would like to see a new test of resistance to show buyer strength and break of that level to start thinking the overall up trend is still in play.
Thanks for stopping by. Good trading, and have a great day.

Cardano: Winnie the Pooh 🍯Like the honey-loving bear Winnie the Pooh, Cardano should grab deeper into the orange-golden honeypot between $0.39 and $0.31 to finish wave (ii) in blue. Although the main requirements to conclude the current movement have already been fulfilled by touching at the orange zone and Cardano could thus take off anytime, we rather expect the altcoin to advance ideally until the 100.00%-retracement at $0.34 before turning upwards. As soon as wave (ii) in blue is indeed complete, our crypto-friend should expand wave (iii) northwards.

Cardano ADA price has a ray of hope for continued growth The last time we came up with an idea for ADAUSDT was 5 months ago, and it's been working out great. The value of the Cardano token has doubled during this time.
The positive thing is that the ADA price has broken out of the falling trend channel.
However, there was one "But" during this time - buyers were unable to break through and gain a foothold above the powerful liquid level of $ 0.43
On yesterday's market decline, buyers of ADAUSD managed to keep the price in an uptrend, above the local purple trend line. That is, buyers don't want to give up easily, which is good and gives a ray of hope.
Given that, in the coming days, BTC sellers may try to drop the price below $ 26600-27000 to break the stops of long positions that are hiding there. The ADAUSDT price may also squeeze down, but it shouldn't be able to stay below $ 0.327-0.34. Fixing the price below this level could trigger an extension of the price drop to $ 0.27 and below.
A positive scenario is difficult in the current realities but possible.
It is necessary to break through to $ 0.55, then consolidate above $ 0.43, and only then will the path to $ 0.80 open up, and maybe even to the first "non-burning price" $ 1 (not million)))
_____________________
Did you like our analysis? Leave a comment, like, and follow to get more

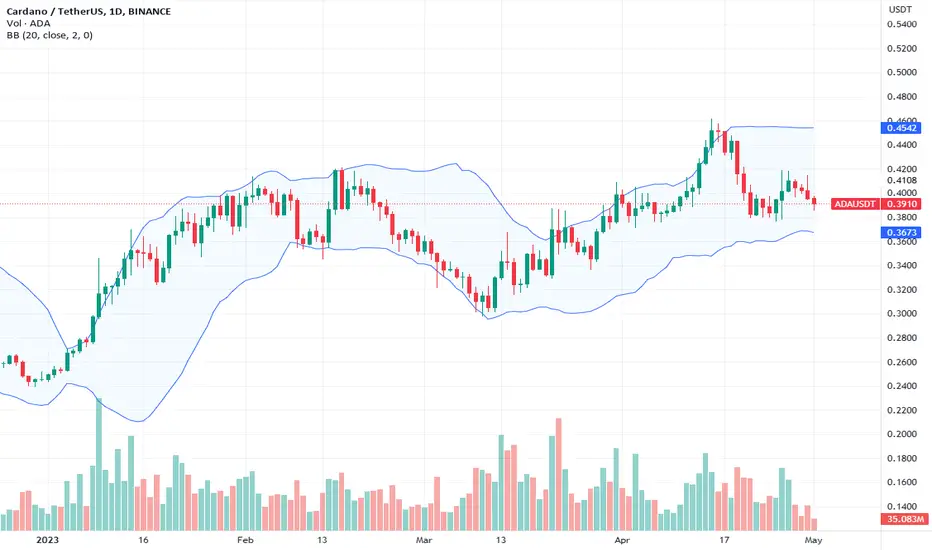
#Cardano Retracement after 50% Rally, Support at $0.37Past Performance of Cardano
The uptrend might still be valid, and ADA is up over 50% from mid-March, but the coin could further correct from recent peaks. Notice that the coin is lower, pulling back from last week's highs. The resistance line remains at $0.41, while support is at $0.37. Any comprehensive close above those lines will shape the immediate to medium-term formation.
#Cardano Technical Analysis
Trading volumes are decent, but ADA buyers still need to build on recent gains and edge above April 26 highs of $0.42. The current rejection of higher prices means bears of April 16 to 22 may flow back, forcing the coin towards $0.37 and even $0.30 in the sessions ahead. Traders may wait for a solid close, with expanding volumes, below $0.37 before engaging. This means they are aware that more gains above $0.41 may see ADA float back to $0.45 in a bull trend continuation formation.
What to Expect from #ADA?
ADA is in an uptrend but correcting after a solid performance from mid-March. As a bear flag prints in a short-term correction printed within a broader bull trend, traders should watch how prices react at $0.37. Losses may dent Cardano bulls' sentiment.
Resistance level to watch out for: $0.41
Support level to watch out for: $0.37
Disclaimer: Opinions expressed are not investment advice. Do your research.
ADAUSD - Cardano Short-term BEARISHHi guys, i put out an analysis on ADA 4 days ago, wanted to update my analysis with whats developing in the charts as we speak.
Lets jump right in with PRICE ACTION ( on daily timeframe)
We are currently in the process of breaking this short-term support line #3. Though we have not yet closed below, todays candle which is a relatively large bearish candle with upper wick indicates bearish activity. Lets see what happens end of day.
We are also below #4 line, horizontal resistance line that played major resistance. Important to watch how ADA reacts with this line as well. The temporary move above could of been a fakeout and we may need a bit more time to get above.
I believe lines # 3 and 4 will be hard to get over. But keep an eye, If this down trend is a fake out. But this scenario is less probably with how our indicators are overbought.
I am watching the green horizontal support line without a #. I believe price action to test this level first. But my major area i am watching is line#2 and purple line (200 day moving average) converge. This in my opinion is some major support. We have to see how price action reacts here.
I think this move is the move i was expecting from the BEARISH DIVERGENCE.
From that, we should look at our indicators and how the move.
RSI - We've come down below the yellow moving average. Usually when we are below the yellow line, we are dwn for some time. Watch to see which level it starts creating support.
MACD - This is a momentum indicator i use. A cross of blue line below orange is a bearish indicator. Also the histograms when they turn red is a bearish indicator as well. We are currently in the process of a bearish cross with red print. We need to watch this.
CONCLUSION: I believe ADA to be moving downwards from the pressure of the Daily BEARISH DIVERGENCE. With indicators showing bearish signs i believe this downward correction to be here for atleast the next couple of days if not a few weeks at most. This is not a bad thing. Overall trend of ADA however is bullish after confirming a breakout of MAJOR DOWNTREND RESISTANCE from all time highs of $3.00. (Look to the chart i posted below for more info).
Thanks for tuning in! If you liked this analysis. Please boost and follow! Comment below on your opinions of what you think and let me know if you agree or disagree.
I will be continuing to UPDATE about cardano, cryptos and more. Keep an eye out!
DISCLAIMER: This is not in anyway financial advise. I am not a financial advisor. EVerything expressed in my posts are my opinion and for educational purpose. Thanks

Cardano / ADAUSD - Outlook Long term Bullish, Short term BearishHi guys. Welcome to my TA analysis on Cardano. Compared to some cryptos im liking how the charts have been for ADA. Just FYI this is purely Technical Analysis, i do not dive into FA at all and base my trading discussions strictly on TA.
That being said, i do use FA to determine which projects are likely to have strong company dynamics and actual use case when trading cryptos as ive been burned heavy before.
I will also be looking to chart more cryptos moving forward as i believe we are at the beginning stages of the crypto bull market. Make sure to tune in for more info on that in my future analysis.
Lets dive in:
First lets look at PRICE ACTION:
Look at the numbered trend lines i have drawn.
#1 line = Is this major resistance downtrend or "bear market" resistance line that formed from ADA HKEX:3 top back in August 2021. \
We have BROKEN OUT and tested it as SUPPORT along with covergence of support forming line #2 this intermediate support trend from Jan 2023.
THIS IS GREAT TO SEE as this means we have have broken the downtrend we were in since 08-2021.
Now does this mean the bottom has formed? Its possible, YES at $0.23 but do notice we can still technically test line #1 and go below $0.23 cents or near it at the least for double bottom even. But that depends on ADA BTC pair relation and how the bull move shapes up in terms of BTC dominance.
#2 line - this is an intermediate support line formed from Jan this year. If we cant stay above line #4 , the red resistance line we can test it at any point as support, im in the camp that maybe thewhite circled area where the 200 Day moving average intersects line #2 is a potential area to look at.
line 2 along with orange arrow forms a upward channel. Notice here how Orange arrow is acting as resistance and todays candle is looking bearish with upper wick.
#3 line - This line is a short term support line where in the coming days we can test, especially if the price action is pushed down by orange arrow.
#4 line - This line was major support back in May 2022, then acted as major resistance recently in Feb. We have to now see how price action acts as we come down to test it. We want to STAY ABOVE.
In the short term i believe we will DEFINITELY test where Lines #3 & 4 MEET. If we can stay above, act as support and bounce up. solid area to Buy in. But remember this could be a temporary fake out to the upside, meaning we are bound to come down. I would need solid confirmation that we stay above these 2 lines.
BUT a major area i would look to enter more positions will be the 200 DMA and line #2. That seems like it would be major support.
INDICATORS:
1. Purple line is the 200 day moving average (dma). Notice how we are above the 200 DMA this is also a great sign as long as we stay above it. The thing to pay attention is how and if/when we react again with this in the near future. We need it to be SUPPORT. I would like it also to start curving upwards, which it may do as we are starting to flatten out.
2. RSI - Important to note we maybe forming a lower high. But price action formed a higher high. This is bearish divergence. Which could push price down, causing price action to interact with drawn lines.
Todays close is important, as we created a peak and are pointed down.
3. ADX and DI - Also shaping up to be bearish divergence. Where bullish momentum is decreasing but price action seems to form higher high recently. Notice the white circled area, the green line is pointing down, showing a decline in bullish momentum
BEARISH DIVERGENCE is when price action is moving up forming higher high shown by the ORANGE arrow but indicators are pointing down forming lower highs also shown by arrow. Price tends to move down over time.
CONCLUSION: I think overall ADA seems more bullish than other ALTS but remember that doesnt mean we can't see lower prices than 0.23 cents and still be in a bull market especially if BTC dominance is strong. It is therefore important to gauge at BTC dominance and BTCADA pairings when going for longer term trades. There are loads of positives for ADA, like breaking the major resistance that was formed during downtrend from HKEX:3 and testing it as support. There are also alot of support if ADA does move down which just means more buying opportunity especially since i believe we are in the makings of the new bull run. A MAJOR WARNING however and something to watch carefully is the BEARISH DIVERGENCE and if and when it plays out. That could mean short term price drops. Look to the support lines drawn and the 200 DMA. But overall i believe Cardano is starting its bullish run and am long ADA until proven otherwise.
Hope this helped. If you likes what i put out, Please boost, follow and comment. Let me know if you agree or disagree. Stay tuned for updates and more charts on crypto and other assets as well. Look below for related charts especially chart on BTC and recent analysis on another ALT>
DISCLAIMER: This is by no means financial advice. I am not a fiancial advisor. The info expressed here are only my opinion and for educational purposes. When trading please maintain your risk management and protect yourselves with stop loss.

ADAUSDT - All targets have been achievedAdhering to my plan and review of this altcoin, the executed position brings a result of 144% ROE on 20x leverage
Thank you all for your support, we will continue to search for other positions
ADAUSDT - trying to open LONG

Bearish ABCD pattern | ADAUSDAs the price has rejected from the potential reversal zone ( PRZ ) its is likely to reverse the trend from here.The price is now making LH and LL . Trade plan is mentioned in the chart. Manage your trades accordingly.

ADAUSDT IdeaADAUSDT | ADAUSD | CARDANO vs Tether
✅ ✅ Risk warning, disclaimer: the above is a personal market judgment and analysis based on published information and historical chart data on The trading view,
And only some of these analyzes are my actual real trades.
I hope Traders consider I am Not responsible for your trades and investment decision.

Cardano Slows Down after 70% Gain, Support at $0.38Past Performance of Cardano
Cardano prices are up 16% from last week's low and over 70% from Q4 2022 lows. Even though the primary trend is upward, the consolidation of the past few days within the February 15 bar can be a concern. The immediate resistance level is $0.42, while the support is $0.38. For the uptrend to resume, buyers must break above $0.42 with rising volumes, paving the way for more gains in the short term.
Cardano Technical Analysis
Cardano is bullish, as mentioned earlier. However, ADA prices are inside the February 15 and 16 trade range. The February 16 bar has higher trading volumes and reversed losses of the February 15. Since ADA prices are inside this bar's range, traders must have a clear definition before committing. If bears flow back, confirming losses of February 16, ADA may drop to $0.35 in a welcomed retracement. The uptrend remains valid as long as prices are above December lows at $0.23. Conversely, if there is demand today, ADA may roar above $0.42 and November highs, setting a new trend that may see it retest $0.52, or September 2022 highs.
What to Expect from ADA?
ADA holders are optimistic after the performance of the better part of February. Even so, trend definition in the short term is critical. That means Cardano bulls must clear $0.42 if ADA has bottomed up.
Resistance level to watch out for: $0.42
Support level to watch out for: $0.38
Disclaimer: Opinions expressed are not investment advice. Do your research.
