ADAUSD BUYWelcome . Cardano is positive despite the market downturn. The currency has breached the bearish pennant with. Re-test the area. It also formed a very positive candle on the daily chart. There is a lot of pressure from the buyers to push the market higher. to 0.4000 in the first stage. And level 0.5000 good luck. Note: If you like this analysis, please give your opinion on it. in the comments. I will be happy to share ideas. And click "Like" so that everyone can reach the post and benefit from it and get free content. Thank you
Cardanobtc

Cardano Channel 1D (ADA)Cardano has reached the demand area and the bottom of its channel in 1D, for investment I enter one step in this area.
make money ✌️💡

Cardano (ADA) formed bullish Butterfly for upto 13.50% moveHi dear friends, hope you are well and welcome to the new trade setup of Cardano (ADA) coin.
On a 4-hr time frame, ADA has formed a bullish Butterfly move for another price reversal.
Note: Above idea is for educational purpose only. It is advised to diversify and strictly follow the stop loss, and don't get stuck with trade

ADA/BTC Cardano is too weak stay above this historical trendlineToday, I analyze the BINANCE:ADABTC Weekly chart, Logarithmic scale. Observe where price is sitting at the time of writing. It is sitting at the crossing of two trendlines and the 0.5 Fibonacci line. This conjunction may serve as a good support for price, meaning that price would not go below 1500 Satoshi ever again. However, that's the extent of bullish factors that I could find on this chart. Let me detail my Bearish factors:
1. The volume across the entire timeline of ADA is almost non-existent when price is above the the 0.5 Fib line. Consider the 0.5 Fib line as a separator between two zones of price action. Any price action above it I call high , and below it, low . Price has traded high for a total of 33 months. It has also traded low for the same number of months. So the trade time between high and low is almost equal. However, the volume is enormously skewed towards the low price action. You can see that on the volume profile appearing on the right side of the chart. Low-price action has 5 times the trading volume of low-price action. Bear in mind that the price axis is logarithmic, so our 0.5 Fib line sitting at 1523 Satoshi does not stand exactly at the middle price between All-time high (8788 Satoshi) and all-time low (266 Satoshi). So I can easily say that 80% of trading volume has occurred in the lowest 20% of prices, and the highest 80% of prices have only seen 20% of the trading volume. Therefore, the high prices carry no significance. Trendlines mean almost much less above the 0.5 Fib line. Using that reasoning, I predict that the two lines crossing below the current price will not stand as support and that price will break below them.
2. The more touches in a bear market to a trendline, the more probable it will break on the next touch. This principle is also validated by descending triangles. I can't see an exact descending triangle pattern here, but price has been in a bearish trend for 6 months now drawing lower highs and lower lows.
But what about Fundamentals?
People get easily excited about news bites such as "Solidity is coming to Cardano", "Haskell can now run on browsers", "Cardano's Formal Verification can catch devastating flaws that cost Millions". The reality is the world is not that black and white. Most investors have absolutely no idea what any of these news lines mean. What really matters is the psychology of the market, i.e., how the market feels about these news, thus Technical Analysis!
On top of that, as a Haskell programmer and a Formal Verification specialist myself, I know full well the scalability challenges that come with such "positive" news. Ultimately, what drives price up is hype and survival instinct, not fundamentals. You can ride that wave up if you want, but when reality hits and the network clogs, some hack steals millions, or the hype withers away leaving Cardano once again a hulk in crypto space; it may be too late to implement your exit plan.
So, what next?
I anticipate price to revisit the lower rising trendline and stay in that zone to allow for redistribution/accumulation. In that phase, moving averages and oscillators like RSI will catch up. From there, we can revisit the Cardano chart to judge if it's ready for another boom.
Keep an eye on this chart. Access it here .


Cardano - BTC Dominance Drops: ALTS RALLYHi Traders, Investors and Speculators of the Chart📈📉
Cardano looks like it's gearing up for a big move; currently consolidating under the resistance zone just like back in 2021 (which is bullish ). Apart from this Fractal that played out two years ago over the same period; I'm expecting altcoins to shine as BTC takes a breather. We can see that BTC dominance is dropping, meaning alts will have a chance to rally:
Here's an update on Ethereum, also looking bullish :
_______________________
📢Follow us here on TradingView for daily updates and trade ideas on crypto , stocks and commodities 💎Hit like & Follow 👍
We thank you for your support !
CryptoCheck

ADAUSDT: Have the Bulls Finally Returned? 🫣| Jan. 20, 2023This week, we will stick to the 4-hour time frame to analyze ADA’s price action in detail.
The bulls have finally returned after a month of the bears maintaining a tight grip on the bulls. ADA has rallied by over 40% in the past two weeks after the sharp reversal earlier this month. The coin broke the stringent resistance at $0.3 and was able to extend the rally to $0.37 before pulling back.
After making good moves, ADA fell back to the support at $0.33. At the time of writing, it seems like the price has reversed from the support level, and we may see a continuation of the rally soon. If a strong reversal is seen from the current levels, the price will start approaching the resistance at $0.38 soon.
Traders must maintain caution as ADA is still close to the support and there are still chances of a breakdown. If a breakdown is seen, expect the price to fall to $0.30!
We will maintain a bullish outlook on ADA until it maintains its position above the support at $0.33.
The important price levels for this week are $0.33 and $0.38!

ADABTC 50% Drop Incoming?We've received a Sell signal through Crypto Tipster v2 on Cardano / Bitcoin on the longer term 2D chart - although there is a level of support right where the market is currently sat, if this level was to break the next support area is a whopping 50% below the current price.
The next few days will be critical to watch on this one, a small downward movement beyond this level of support will ultimately break downward for some serious Short profits.

ADAUSDT: Is It the Best Time to Buy ADA? 🫣| Nov. 25, 2022
This week, we will stick to the 4-hour time frame to analyze the price action in detail!
The bears clearly have had a tight grip on the bulls for the past few weeks as seen in the chart above. ADA has been continuously hitting 52-week lows, the recent one being hit on Monday.
Until we see the price reverse, it is risky to take a long position on ADA. Therefore, traders should avoid taking positions until ADA is able to reclaim the resistance at $0.34.
The price will show signs of strength only once it is able to sustain above $0.34. Until then, there is a chance of a new 52-week low being hit!
Once the resistance is reclaimed, we can expect the price to start approaching our short-term target marked on the chart at $0.38. This view will only be valid if the price is able to sustain above $0.34. We will maintain a bearish outlook on ADA until it is able to reclaim the resistance.
The important price levels for this week are $0.34 and $0.38!

ADA SHORT, macro triangle breakout incommingADA is showing strong bear bias for a potential macro triangle breakdown to 0.16-0.30 range.
Await confirmation for late entry, but for now the bias is bearish. Flip if needed.

ADAUSDT Now BEARISH🐻Future PARABOLIC🚀Hi Traders, Investors and Speculators
Ev here. Been trading crypto since 2017 and later got into stocks. I have 3 board exams on financial markets and studied economics from a top tier university for a year. Daytime job - Math Teacher. 👩🏫
A detailed video update on Cardano / ADAUSDT with 4 confirmations why I am leaning towards the bears SHORT-TERM :
🐻 Technical Indicator Phoenix Ascending which contains the LSMA , EMA and RSI ,
🐻 The Candlestick Analysis ,
🐻 Support zone and Resistance zone analysis,
🐻 The Bollinger Bands.
Considering that these four methods of speculating short term price action are all pointing bearish, we also take a look at the next possible bounce/ support zone for ADA.
NOTE that even though I am bearish short term, I do still believe that this makes for an excellent accumulation phase price . From these levels, the price can likely go PARABOLIC after after finding a bottom as it has previously after reaching lows.
Some altcoins do rally untimely during a bearish market, but it is usually the smaller market cap coins / micro caps that have mini rallies whilst BTC trades lower. Here are a few that I'm watching :
_______________________
📢Follow us here on TradingView for daily updates and trade ideas on crypto , stocks and commodities 💎Hit like & Follow 👍
We thank you for your support !
CryptoCheck

Are the ETH merge gamblers and speculators now moving on to ADA?The biggest update for cardano is coming soon, on 22 september the vasil update. Since all the ETH speculators and gamble made gains and secured them, they might be looking for the next scaling investment, could they focus on cardano next? Will we see big gains in the next few days/weeks?
Disclaimer : The information mentioned in my post should be taken with a grain of salt. They are my personal opinion and do not form facts. They are also not a call or recommendation to open trades, do trades or close positions.

ADA one-two, one-two Elliot WaveSuper bullish on ADA, 1-2 1-2, with a minimum target at 55 USD for the inner 1-2
ADAUSDT - Be Ready for a PARABOLIC AltSeasonHi Traders, Investors and Speculators 📈📉
Ev here. Been trading crypto since 2017 and later got into stocks. I have 3 board exams on financial markets and studied economics from a top tier university for a year. Daytime job - Math Teacher. 👩🏫
In today’s analysis, a quick look at Cardano / ADAUSDT . Like with most of the crypto markets, there has been a small relief rally / upside correction that balanced out the recently oversold RSI on most charts. By looking at our technical indicators, the upwards price action has been just enough to correct the oversold markets BUT not enough to signal a reversal. We know this, because we have not made a higher high or a clear bottom pattern. Instead, we have made a lower high, got rejected at the local resistance zone and continue to trade downwards.
It’s been my opinion that we will see our reversal during Q4, but in which one of the 3 months nobody knows. The good news, is that the end of the bearish market is near and this may be your final chance to accumulate at low prices – it’s a sale !
The good news, is that if you dollar-cost-average these last few range bound downs, you could stand a chance to make a profit of up to 200%, if you are patient enough and set your TP targets. More on dollar Cost Averaging HERE:
Also, this is what we’re looking for in a reliable bottom pattern:
Have a great weekend 🥂. I hope you enjoyed this post today! Please give us a thumbs up 👍
_________________
Follow us here on TradingView for daily updates and trade ideas on crypto , stocks and commodities Hit like & Follow
We thank you for your support !
CryptoCheck

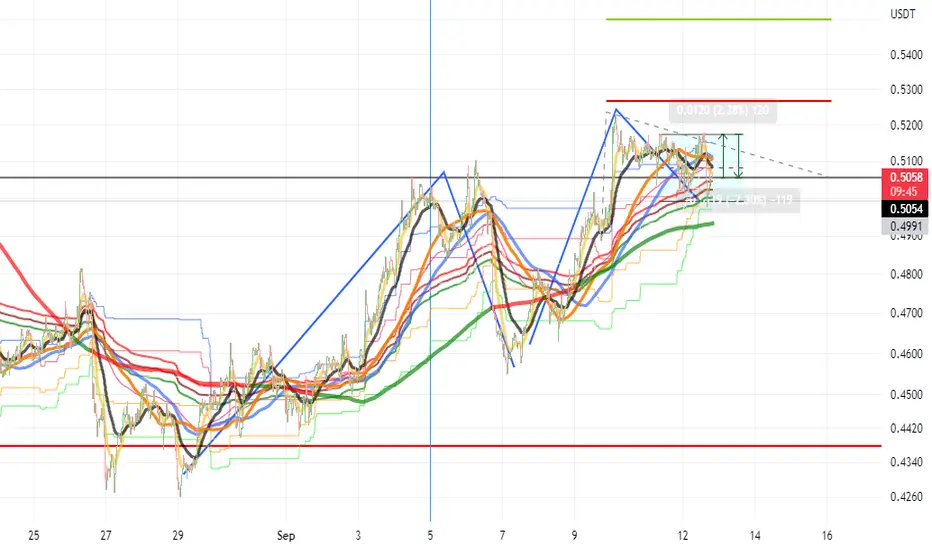
ADA\USDT 📐Ascending Triangle📐🇺🇸Hello friends👋.
📈Long: 5-10% of deposit
🔴SL: $0.4975
🟢TP: 0.6213$
Strongly squeezed under the level, an impulse is possible, now it is logical to enter a deal, without breaking through the upper border and fixing the price👌
Consider the risks!!!💢

ADA tradeHere's an idea for a short term trade on ADA/USD. Price ranged for almost one month in the 0.4 - 0.5 area. Being in the lower part of the range, I'm expecting a bouce at least to 0.382 fibonacci but I wouldn't be surprised it it spiket to 0.618 even.
Trade safe :)


ADAUSDT: Wait For Buys 🎯No one should be buying here, the very obvious slow down in price is a lure to attract buyers.
We still need to complete the compression and tap the weekly demand zone before we can consider buys.
If you want to get caught in this stop hunt, buy here.
If you want to join buys with the whales, wait for a liquidity grab THEN consider a buy.
The second approach is much more logical but can your emotions deal with patience?
Let me know what you think in the comment section 💬


Cardano ADA short Entry Range, Take Profits and Stop Losspreviews price target reached
ADA/USDT short
Entry Range: $0.45 - 0.49
Take Profit 1: $0.40
Take Profit 2: $0.37
Take Profit 3: $0.26
Stop Loss: $0.57


The Future of Cardano (ADA)Price gave buyers hope but that came to halt shortly after.
If we incorporate our same view of BTC into Cardano, then we should really see another sell-off before buyers combat it.
Because the demand price is trading at currently is so weak, we may see a drop off from here OR once the break and liquidity gets swept (As Illustrated)
I will keep you updated on my thought process and whether I enter or not.

ADA Logarithmic ChannelThis is the Cardano (ADA) Logarithmic Channel.
All lines on the chart represent support/resistances.
We could bounce at ANY of these Supports, and pull back from ANY of these Resistances.
My Dollar Cost Average buying are at these prices:
T1: $.90 - 1.00
T2: $.70 - $.80
T3: $.40 - $.44
This is not financial or investing advice. Do your own analysis and your own research.
