ADAUSD Is this 1W Golden Cross what the market needs??Cardano (ADAUSD) just formed a 1W Golden Cross this week, the first in its history, amidst a continuous bearish sequence since the December 02 2024 High. With its 1W RSI just below neutrality, this simply highlights the undervalued condition of this token relative not only to the rest of the high cap market, but also to its previous Bull Cycle.
As you can see, based both on 1W RSI and price action terms, we may be in a consolidation phase similar to September - November 2020, at the end of a Megaphone pattern. That pattern was the Accumulation vessel of the Cycle that led to the massive 2021 parabolic rally and the eventual Cycle Top / Higher High of the historic Channel Up.
According to that, we should be expecting a 1.236 Fibonacci extension test, targeting $5.000.
-------------------------------------------------------------------------------
** Please LIKE 👍, FOLLOW ✅, SHARE 🙌 and COMMENT ✍ if you enjoy this idea! Also share your ideas and charts in the comments section below! This is best way to keep it relevant, support us, keep the content here free and allow the idea to reach as many people as possible. **
-------------------------------------------------------------------------------
💸💸💸💸💸💸
👇 👇 👇 👇 👇 👇
Cardanosignals

CARDANO about to form its first ever 1W Golden Cross!Cardano (ADAUSD) is far from dead as not only has it staged a rebound on its 1W MA50 (blue trend-line) but is also close to forming its first ever Golden Cross on the 1W time-frame. Technically this is a similar set-up to November 2020 right after ADA held its 1W MA50, made a Higher Low on its 1W RSI (like today) and started to rise.
This rise ended up forming the top of the 7-year Channel Up just below the 1.236 Fibonacci extension from the previous Cycle High. Basically this whole Bull Cycle has been identical to the December 2018 - December 2020 and right now it appears that the market has started the final parabolic rally.
If the pattern approaches the 1.236 Fib extension again, expect the Cycle to peak around $5.000.
-------------------------------------------------------------------------------
** Please LIKE 👍, FOLLOW ✅, SHARE 🙌 and COMMENT ✍ if you enjoy this idea! Also share your ideas and charts in the comments section below! This is best way to keep it relevant, support us, keep the content here free and allow the idea to reach as many people as possible. **
-------------------------------------------------------------------------------
💸💸💸💸💸💸
👇 👇 👇 👇 👇 👇

Cardano AnalysisCardano ADA/USD Analysis
Cardano (ADA/USD) is currently trading at 0.788, having recently breached a critical support level. This breakdown has shifted the asset's technical structure, with the price now retesting the previously broken support zone, which has since turned into resistance. In technical analysis, such a retest of a breached support level often acts as a key confirmation point for the potential continuation of the prevailing trend. If the current candle closes decisively below this newly established resistance level, it could signal a resumption of bearish momentum, potentially opening the door for further downward movement.
The validity of this bearish outlook hinges on several factors, including the volume accompanying the price action and the broader market sentiment surrounding Cardano. Traders should remain vigilant for any signs of rejection or reversal patterns at this critical level, as these could negate the bearish thesis and indicate a shift in market dynamics.
In summary, while the current price action suggests a potential continuation of the downtrend, it is essential to approach the market with caution. We welcome your perspective on this analysis and whether you agree with the potential bearish outlook for Cardano. As always, prioritize responsible trading practices and robust risk management strategies.

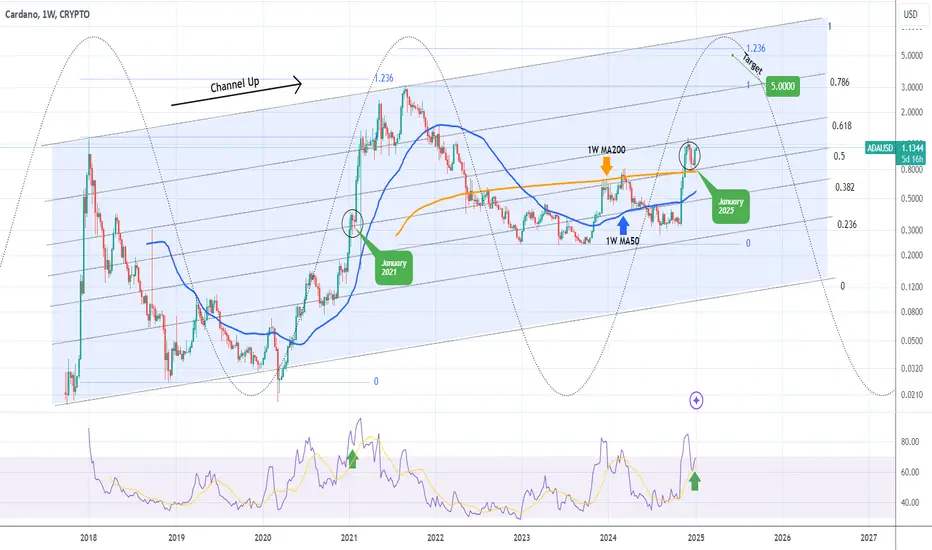
CARDANO Mega rally starting first to $3 then top expected at $5Last time we looked at Cardano (ADAUSD) we gave a confident medium-term buy signal (November 18 2024, see chart below):
Today, having seen a very strong closing to the year last week and especially since the price bounced off the 1W MA200 (orange trend-line), we are making a long-term call towards the top of the Cycle.
Technically ADA's historic pattern is a Channel Up and if we draw its Fibonacci levels, the price is currently within the 0.5 - 0.618 range. That is exactly where it was during the same stage of the previous Cycle in January 2021. As the 0.5 Fib held, once it closed a 1W candle above the 0.618, the price skyrocketed to the 0.786 Channel Fib and tested the previous All Time High (ATH).
We can see the amazing symmetry between the Cycles on the 1W RSI fractals too. As a result, our next immediate Target for ADA is near the previous ATH at $3. Beyond that, we expect the Cycle to top at $5, which is marginally below the 1.236 Fibonacci extension, which was where the August 2021 Cycle Top was priced.
-------------------------------------------------------------------------------
** Please LIKE 👍, FOLLOW ✅, SHARE 🙌 and COMMENT ✍ if you enjoy this idea! Also share your ideas and charts in the comments section below! This is best way to keep it relevant, support us, keep the content here free and allow the idea to reach as many people as possible. **
-------------------------------------------------------------------------------
💸💸💸💸💸💸
👇 👇 👇 👇 👇 👇
CARDANO 1D Golden Cross pushing for Resistance breakout to $1.40Last time we looked at Cardano (ADAUSD) was on September 24 (see chart below), when we called for the strongest buy signal in a year:
It couldn't have been more timely as we went from a 0.3690 price to 0.8200, a +120% rise. This High is also testing the March 14 2024 High, currently Resistance 2. The market just formed a 1D Golden Cross and last time it had one was exactly 1 year ago (November 18 2023). Soon after Resistance 2 broke and the price reached a little above the 2.0 Fibonacci extension. Even the 1D RSI is on a similar fractal.
As a result, once ADA closes a 1D candle above Resistance 2, we will target $1.400 (Fibonacci 2.0 extension).
-------------------------------------------------------------------------------
** Please LIKE 👍, FOLLOW ✅, SHARE 🙌 and COMMENT ✍ if you enjoy this idea! Also share your ideas and charts in the comments section below! This is best way to keep it relevant, support us, keep the content here free and allow the idea to reach as many people as possible. **
-------------------------------------------------------------------------------
💸💸💸💸💸💸
👇 👇 👇 👇 👇 👇

CARDANO flashing the strongest buy signal in 1 yearCardano (ADAUSD) just gave the strongest long-term buy signal possible on the 1W time-frame as the 1W LMACD is forming a Bullish Cross. That is the first such formation in almost 1 year (since October 09 2023), indicating that we have the most powerful buy signal at hand.
The 1W RSI has been ranging since May, practically for the majority of the time that ADA has been trading below its 1W MA50 (blue trend-line).
Basically as you can see all the above conditions are identical to the previous Bull Cycle, where a Bullish Megaphone emerged on a 1W LMACD Bullish Cross and after a 1W MA50/ MA100 Bullish Cross, the bottom was formed, while the 1W RSI was consolidating.
This time we have all these formations emerged again, so any week now, Cardano could start its new Parabolic Rally. With a Higher Highs trend-line setting a clear Resistance, we see a $5.00 price as a strong Target for the Cycle Top.
-------------------------------------------------------------------------------
** Please LIKE 👍, FOLLOW ✅, SHARE 🙌 and COMMENT ✍ if you enjoy this idea! Also share your ideas and charts in the comments section below! This is best way to keep it relevant, support us, keep the content here free and allow the idea to reach as many people as possible. **
-------------------------------------------------------------------------------
💸💸💸💸💸💸
👇 👇 👇 👇 👇 👇

ADA → Cardano to $0.40? or $1.40? Get your Longs Ready!ADA completed its 230% price increase since October 2023 and now appears to be finding some resistance. Should we short here?
How do we trade this? 🤔
Shorting is not ideal on the Daily timeframe. Since October 2023, ADA has put in three legs in a bull trend, a double-top reversal pattern that has come off of an ascending wedge (bearish pattern). We're now finding resistance below the Daily 30EMA with a gap down to the Daily 200EMA. This analysis screams a two-legged pullback to the 200EMA, likely in alignment with the Bitcoin halving that's about to happen in April 2024.
Short on the 1HR timeframe, but get your equity ready for a long position when ADA comes into contact with the $0.53-$0.57 price area. Look for a strong bull candle closing on or near its high off of the Daily 200EMA, this is our signal bar and a reasonable one to enter on with a 1:2 Risk/Reward Ratio, aiming for a conservative target of $0.775.
A confirmation bar should take us somewhere in the $0.60-$0.65 range. If we see this, given the crypto market's similar sentiment after the halving, it's reasonable to enter at a 1:2 risk reward aiming for the $1.20 area. It's reasonable to take half profits at 1:1 Risk/Reward and swing the latter half of your position to 1:2, 1:3, or even 1:4 Risk/Reward on this timeframe, depending on how the price action plays out.
This analysis is in alignment with my recent ADA Lifetime Analysis as seen here:
💡 Trade Idea 💡
Long Entry: $0.55
🟥 Stop Loss: $0.4375
✅ Take Profit #1: $0.663
✅ Take Profit #2: $0.775
⚖️ Risk/Reward Ratio: 1:2
🔑 Key Takeaways 🔑
1. Three legs in a bull trend
2. Double top reversal pattern which has come off of an ascending wedge (bearish pattern)
3. Finding resistance below the Daily 30EMA with a gap down to the Daily 200EMA.
4. Look for a 2-legged pullback to the 200EMA, likely in alignment with the Bitcoin halving that's about to happen in April 2024.
5. RSI is at 48.00 and Above the Moving Average, supporting the idea of a pullback to the 30.00 area below the Moving Average.
💰 Trading Tip 💰
It's reasonable to take half profits at the first resistance target in a long trade or the first support target in a short trade. Using a 1:1 Risk/Reward Ratio for your first target, you can move your stop loss up to your entry price, locking in profits. This allows you to watch the rest of the trade execute without worrying about losing money, which helps improve trading psychology and the equity in your account.
⚠️ Risk Warning! ⚠️
Past performance is not necessarily indicative of future results. You are solely responsible for your trades. Trade at your own risk!
Like 👍 and Follow to learn more about:
1. Reading Price Action
2. Chart Analysis
3. Trade Management
4. Trading Psychology

Ada sitting on support. What's next?From mid-October to December, BINANCE:ADAUSDT experienced a remarkable rally, surging by approximately 250%. However, after two unsuccessful attempts to surpass 0.7 in December, the coin began a retracement, eventually dipping below 0.5 at the onset of the new year.
The recovery from this recent decline appears feeble, marked by a lower high on our chart, and the coin reversed at the support zone.
Given the potential for a more significant correction in BTC, I anticipate that AdaUsdt will tread a similar path and breach the support level.
In such a scenario, a decline to 0.4 seems highly likely.

ADAUSD Is targeting 0.850 by the end of the year.Cardano (ADAUSD) is currently trading within the 1D MA200 (orange trend-line) and 1D MA50 (blue trend-line) for most of May. This consolidation is most likely the new Accumulation Phase for the next price jump and the reason is an old chart that we published last year, comparing the 2022/23 Cycle with 2018/19.
So far it has been remarkably similar, with the Bear Cycle being a decline of around -93% on both occasions, within a Channel Down pattern that bottomed on an Inverse Head and Shoulders. The first significant upside target in 2019 was the 0.5 Fibonacci retracement level. That is currently a little over 0.850 and since the Cycle has been following the previous one so closely so far, we see no reason not to continue to do so.
-------------------------------------------------------------------------------
** Please LIKE 👍, FOLLOW ✅, SHARE 🙌 and COMMENT ✍ if you enjoy this idea! Also share your ideas and charts in the comments section below! **
-------------------------------------------------------------------------------
💸💸💸💸💸💸
👇 👇 👇 👇 👇 👇

ADA/EUR 06/02/2023 Trade idea 10amUTC-5Hello everyone,
Im of opinion that unless we close above 0.3654xx EUR followed with confidence move above,
it would be smarter to short market considering where we was at January. So I would expect next move to at least 0.342xxx cents and then reconsidered possibilities of further falling or reversing.
IDEA would be invalid
if we move above 0.3654xx and close there with confidence,
it would be smart have Stop Loss above that price depending on your risk tolerance.
My is @ 0.370500€.
Best regards
Joe

Cardano is approaching strong ceilingCardano also had a nice run at the beginning of the year and after breaking above the falling wedge's resistance, the coin gained around 50%.
From my point of view, Ada is one of the weakest major coins and a rise to the strong resistance above 0.4 should be considered a good selling opportunity with and 1:3 R:R (at least)

CARDANO Historic Cup & Handle slowly starting the new BullCycle?Cardano (ADAUSD) is having a good start for the year as the price is about to hit the 3D MA50 (blue trend-line). This is the level that has been unbroken since November 15 2021, basically throughout almost the whole Bear Cycle. As you realize a break-out above it would be a major bullish development for Cardano. Such a break on January 07 2019, was what effectively confirmed the start of the previous Bull Cycle.
At the same time, the RSI broke above its Lower Highs trend-line, which is exactly what happened this week. As you see, based on the Jan 2019 fractal, an RSI pull-back now would mean short-term loss of strength for ADA but when a full 3D candle closed above the MA50, the price made the break-out towards the 3D MA200 (orange trend-line). Its target was the 0.382 Fibonacci and this is what we will target (0.6400), in case we get that candle closing above the MA50.
This time however, ADA has another strong pattern to support the idea of a new Bull Cycle and that is its historic Cup and Handle (C&H) pattern that has been trading in since January 2018. As you see, the current Bear Cycle (being within a Channel Down) can be viewed as nothing but the Handle of the Cup. Technically the target on such patterns in extremely high, which would be unrealistic based on its market capitalization, but holders can finally start believing a little more to new All Time Highs for ADA. For now take a quarterly step at a time and use the 0.382 Fib and 3D MA200.
-------------------------------------------------------------------------------
** Please LIKE 👍, FOLLOW ✅, SHARE 🙌 and COMMENT ✍ if you enjoy this idea! Also share your ideas and charts in the comments section below! **
-------------------------------------------------------------------------------
💸💸💸💸💸💸
👇 👇 👇 👇 👇 👇

Financial Wave. ADA(Cardano)Our priority scenario in ADA is the price growth to $0.2792 in wave (i), before the growth to this target, the price may roll back in the small wave iv to $0.2601, but not lower than $0.2521. If the price drops to this level, we’ll change our view on ADA.

ADAUSDT Major rebound to the 1D MA50, unbroken in over 1 month.*** ***
For this particular analysis on Cardano we are using the ADAUSDT symbol on the OKX exchange.
*** ***
The idea is on the 1D time-frame where ADA is following the general market bullish sentiment (led by Bitcoin), rising by more than +15% in a day and is about to hit the 1D MA50 (blue trend-line). This level has been unbroken since September 13. The first short-term bullish break-out was done today as in the meantime, the price broke above the (dashed) Lower Highs trend-line of the September 10 High.
A break above the 1D MA50, would be the second short-term bullish break-out and can target the top (Lower Highs trend-line) of the Falling Wedge pattern that is dictating the trend since the May collapse. A break above that level, if it coincides with a break above the 1D MA200 (orange trend-line), would be a medium-term bullish break-out and targets the August 15 High. The level that would shift the trend back to long-term bullish territory would be the 0.6900 May 13 High.
Note that an additional signal for a medium-term bullish break-out to pay attention to, would be the RSI (on the 1W time-frame) breaking above the 40.17 Resistance, which made a Double Top so far both on August 14 and September 11.
-------------------------------------------------------------------------------
** Please LIKE 👍, SUBSCRIBE ✅, SHARE 🙌 and COMMENT ✍ if you enjoy this idea! Also share your ideas and charts in the comments section below! This is best way to keep it relevant, support me, keep the content here free and allow the idea to reach as many people as possible. **
-------------------------------------------------------------------------------
You may also TELL ME 🙋♀️🙋♂️ in the comments section which symbol you want me to analyze next and on which time-frame. The one with the most posts will be published tomorrow! 👏🎁
-------------------------------------------------------------------------------
👇 👇 👇 👇 👇 👇
💸💸💸💸💸💸
👇 👇 👇 👇 👇 👇

ADAUSD Doesn't seem to be able to get out of its bearish trend.Cardano (ADAUSD) got rejected 6 days ago exactly at the top (Lower Highs trend-line) of the long-term Channel Down pattern that it has been trading in since the September 02 2021 market High. This is the 4th Lower High rejection of this structure and when that happened in the past, a strong rejection followed.
Cardano has been trading sideways for basically 3 months (since the June 18 low). As you see this has the potential to extend a green Channel if the price breaks above the Lower Highs. Until then, it would be best to sell again only if the 0.400 Support (July 13 Low) breaks and target the 2.0 Fib extension. A break above the Lower Highs though should extend this 3 month neutral trade and test first the 1W MA200 (red trend-line), which has been basically the Resistance during these 3 months, and secondly the 1D MA200 (orange trend-line) for the ultimate long-term trend test.
When ADA breaks and closes above the 1D MA200, then and only then we can consider a long-term shift of fortunes from bearish to bullish. The Bullish Cross on the MACD (on the 1W time-frame) could be an early indication of such a move.
--------------------------------------------------------------------------------------------------------
** Please support this idea with your likes and comments, it is the best way to keep it relevant and support me. **
--------------------------------------------------------------------------------------------------------

ADAUSD Moment of truth for CardanoCardano (ADAUSD) has suffered a strong pull-back along with the majority of the crypto market last week, dropping again below its 1D MA50 (blue trend-line) for the first time in almost 1 month. Still, it is so far contained within the short-term Channel Up that started after the July 13 Low.
The RSI on the 1W time-frame may be showing a smooth reversal to the upside since May 29 but if the July 13 Low breaks, the bearish dynamics of the long-term Channel Down may come into play again and as with the April 30 break, may lead to a Lower Low at or below the 2.0 Fibonacci extension, which is now at $0.275. As long as the Channel Up is sustained however, Cardano will most likely make a Channel Up Higher High right on time to test the 1D MA200 (orange trend-line) for the first time since November 24 2021!
Certainly this seems to be the moment of truth for ADA.
--------------------------------------------------------------------------------------------------------
** Please support this idea with your likes and comments, it is the best way to keep it relevant and support me. **
--------------------------------------------------------------------------------------------------------

ADAUSD needs to break the 1D MA50 in order to avoid 0.200.Cardano (ADAUSD) has had repetitive rejections (4 in total) on the 1D MA50 (blue trend-line) since May 31. In fact the last time we saw so many rejections within a long-term Channel Down, was during the previous Bear Cycle of 2018. The inability to sustain a break-out above the 1D MA50, led Cardano to the final hyper aggressive flush of November 2018 that ultimately formed the bottom of the Cycle.
Based on 1D RSI terms we also seem to be on the third (3) and final leg below the collapse, so if ADA holders want to avoid this, they need to see the price break above the 1D MA50 and sustain trading above it for a week at least. Otherwise the completion of a -93% drop from the top is possible at around 0.200.
--------------------------------------------------------------------------------------------------------
** Please support this idea with your likes and comments, it is the best way to keep it relevant and support me. **
--------------------------------------------------------------------------------------------------------

ADAUSD Comparison with 2018 shows the bottomCardano (ADAUSD) has been down for more than -87% since the September 2021 High and has been trading within a Channel Down ever since. This is similar to the pattern of the last Bear Cycle in 2018.
On this 1D time-frame analysis, the 1D MA50 is the blue trend-line and the 1D MA100 the green trend-line. Even though 2018 made a -93.50% dip from the moment the Channel Down started, in terms of 1D RSI and the Fibonacci extension that marginally broke 2.0 Fib, it appears that we in similar price action as early December 2018, which was the bottom of that Cycle. We might see one final dip towards 0.3000, in case ADA follows the candle structure of late Nov - early Dec 2018 but what is more important is that the next time the 1D MA100 breaks, we will most likely have a confirmed recovery and the start of the new Bull Cycle.
--------------------------------------------------------------------------------------------------------
Please like, subscribe and share your ideas and charts with the community!
--------------------------------------------------------------------------------------------------------

ADAUSDT the rejection levels it needs to overcome*** ***
For this particular analysis on CARDANO we are using the ADAUSDT symbol on the Phemex exchange.
*** ***
The idea is on the 1D time-frame with the 1D MA50 (blue trend-line), 1D MA200 (orange trend-line) and the 1W MA50 (red trend-line) displayed as key periods of the analysis. Cardano has rebounded on the 0.73750 Support last week, but yesterday suffered a strong sell-off along with the majority of the market. This came a day after the Fed rate hike of 0.50% (strongest since 2020) and the U.S. Initial Jobless Claims report.
Technically though, as long as the Support remains intact, there are more probabilities to build a base here and test the next two Resistance levels in line, the 1D MA50 and the Lower Highs trend-lines (both dashed and solid). However the short-term is limited to the Lower Highs trend-line so watch out for a rejection there. The long-term bearish sentiment may only be invalidated if the price breaks and closes a 1D candle not just above the Lower Highs trend-line but also the 1D MA200, which is keeping the price action below since November 21 2021.
The 1W MA50, which is usually the support on week-to-week rallies, has had already two clear rejections (December 27, January 18), so count this in as a Resistance. The natural targets after the 1D MA200 breaks though should be the Fibonacci retracement levels of 0.5 (around 1.51200), 0.618 (1.79125) and 0.786 (2.27990). Note that the 1D LMACD is on a Bullish Cross, which favors the upside, at least on the short-term. A 1D candle close below the 0.73750 Support though, may accumulate sellers into aggressive selling towards the -0.236 Fibonacci extension at 0.52550.
--------------------------------------------------------------------------------------------------------
** Please support this idea with your likes and comments, it is the best way to keep it relevant and support me. **
--------------------------------------------------------------------------------------------------------

ADA Long ScenarioBINANCE:ADAUSD Signal
Entry - $0.5
Target - $2
Invalidation - $0.1
Risk to reward ratio - 3.6
Technical confirmations
Price already reached 0.618 Fib zone and continue to decline.
We expect price to reach 0.786 and maybe 0.886 zones.
There's liquidity at $0.77 so it is a good target for price to continue falling.
Aroon indicator shows a strong bearish momentum on a daily timeframe and losing it's momentum on a weekly timeframe which indicates that the price is going to reverse soon.
Fundamental confirmations
Why should price reach Entry level?
ADA TVL fell from 323 to 199 million in one month.
Why should price reach Target level?
Cardano increased block size to enhance Dapp performance.
1 of top 3 coins to buy and hold for ever according to "Investorplace".
NFT and DeFi projects being built on the net.
Vasil Hardfork launch in June, 2022.
TVL rise from 822k million to 199 million since January 1, 2022.
During the Basho development phase, the ledger continues to optimize and scale for the growing demand. Along with parameter adjustments and node upgrades, Plutus capability continues to develop at a steady pace.
Disclaimer: We are expecting price to rise after the Vasil Hardfork launch.

CARDANO repeating Ethereum's 2017 break-out?Cardano (ADAUSD) had a major bullish break-out today as it broke above the Channel Down that has been holding since the September 02 2021 High. It remains to be seen if the 1D candle closes above it, but it already looks as if ADA is replicating Ethereum's (ETHUSD) bullish break-out in early January 2017.
It was when ETH broke above the 1D MA50 (blue trend-line) and its long-term Lower Highs trend-line (dashed line). See how the price action that led to this since March 2016 is also quite similar to ADA's price action since May 2021. Same Channel Down, followed by a Higher High, a near Support test and the start of the Lower Highs. Even the RSI fractals are similar.
The 1D MA200 (orange trend-line) on Cardano is currently at 1.558 but dropping fast. Do you think the pattern will continue to play out the exact way as ETH's 2017 and consolidate around the MA200 for a month and then start a parabolic rally? At least that's what ADA's holders would want to see.
--------------------------------------------------------------------------------------------------------
** Please support this idea with your likes and comments, it is the best way to keep it relevant and support me. **
--------------------------------------------------------------------------------------------------------

CARDANO can't get out of this death spiralADAUSD (Cardano) has been trading inside a Channel Down ever since its September 02 2021 All Time High (ATH). That is a significant amount of time it has been on a bearish trend and the pure structure of this Channel Down, doesn't seem to allow much room for hope, at least not yet.
Right now the price appears to have formed a bottom ever since the February 24 Lower Low of the Channel. The same sideways trend was last seen from December 04 to December 20 2021, when ADA again made a Lower Low and after this consolidation, it rebounded back to the 1D MA50 (blue trend-line) and its 0.5 Fibonacci retracement level, before eventually resuming the downtrend.
The similarities between the inner Channel's (dashed patterns) are obvious and this is also illustrated on the 1D RSI fractals which are identical. This time however, the 1D MA50 and the 0.5 Fib are not close to each other (0.974 and 1.115 respectively), so first target the 1D MA50 and if the price action gives a 1D candle close above it, then continue towards the 0.5 Fib (which seems it will make a perfect Lower High on the long-term Channel Down). On the other hand, a closing below the 0.750 Low, may extend the downtrend towards the -0.5 Fib extension and the 1M MA50 (red trend-line).
--------------------------------------------------------------------------------------------------------
Please like, subscribe and share your ideas and charts with the community!
--------------------------------------------------------------------------------------------------------

CARDANO, Develops Massive BROADENING-WEDGE-BOTTOM-FORMATION!Hello,
Welcome to this analysis about Cardano and the daily timeframe perspectives. The cryptocurrency market is changing day in and day out and besides that the divergence between the several different Cryptocurrencies also increases. This is why there are Cryptocurrencies that show up with more bullish structures, while others are neutral and others again show more bearish outlooks. In this case, it is necessary to differentiate the diverging setups and pick the ones with the most potential to take advantage of. In this case, I detected a major formation forming with Cardano with the worthwhile structure and this is why I detected all the important levels, structural formations, and upcoming determinations we need to consider.
Structural Developments:
As when looking at my chart now we can watch there how Cardano is building this massive broadening wedge bottoming formation. In this massive broadening wedge bottoming formation Cardano has formed the coherent wave count which consists of five waves from A to E and recently with the ending of the wave E Cardano has finalized this whole wave count and is now approaching the lower boundary of the massive broadening wedge bottoming formation in which a major structural support cluster is lying consisting of the lower boundary of the wedge formation and the descending support line. In this case, Cardano has good abilities to bounce within this zone as it is seen in my chart.
Upcoming Determinations:
Taking all these factors into the consideration there is a high potential given that Cardano manages to bounce in this structure and once this happened it will be highly decisive on how Cardano approaches the upper levels further because when Cardano manages to finally bounce above the upper boundary of the broadening wedge bottoming formation this will be the setup for an appropriate continuation and activation of the target zone which is marked in my chart in orange. Once Cardano has reached out to this zone it will be highly decisive on how Cardano moves on from there on and if there forms a setup from where Cardano can continue or main pullbacks firstly take place, it will be an interesting development ahead.
In this manner, thank you for watching the analysis, all the best!
"There are many roads to prosperity, but one must be taken."
Information provided is only educational and should not be used to take action in the markets.
