ADAUSD formed bullish BAT | Upto 40% move expectedHi guys and gals hope you are doing good, Cardano (ADA) is giving another long opportunity on 2 day chart and has formed bullish BAT pattern and entered in potential reversal zone and ready to move up at any time from here.
The dimensions of pattern:
After initial leg (X to A) the A to B leg is retraced between 0.382 to 0.50 Fibonacci and then B to C leg is projected between 0.382 to 0.886 of A to B Fibonacci projection area and last leg (C to D) is retraced between 0.786 to 0.886 Fibonacci and now the price action is moving in potential reversal zone of this bullish BAT and now we can expect bullish divergence at any time which will lead the priceline between 0.382 to 0.786 Fibonacci projection of A to D leg.
Buying And Sell Targets:
The buying and sell targets according to harmonic BAT pattern should be:
Buy between: $0.0393 to $0.0352
Sell between: $0.0493 to $0.0493
Stop Loss:
The potential reversal zone area which is up to $0.0352 can be used as stop loss in case of complete candle stick closes below this level.
Note: This idea is education purpose only and not intended to be investment advise, please seek a duly licensed professional and do you own research before any investment.
Cardanousd

CARDANO (ADAUSD) DailyDates in the future with the highest probability for price direction reversals

BREAKOUT CARDANO ON WAY!! THIS can be huge!!Cardano about to breakout as you see in the chart. the breakout can become huge.
I expect a breakout in cardano next time.
# only expecting, nobody know the future!

Cardano setting up for new ATH.Cardano team made serious progress with Shelley mainnet. Buy now, and start staking world most DECENTRALIZED cryptocurrency for financial freedom!

ADA/USDT - 15min - Flat Correction looks to me like ada is close to completing a Flat correction.
if we assume that its completed 5 waves up on the higher degree, then we have a conservative count that at least would give us an ABC for the X before the next leg down.
the bullish outlook would have the flat complete the 4th and begin a new impulse for the 5th, but i'm not betting on that count unless the conservative count is invalidated.

ADA is being retraced after one and a half month bullish moveIn Aug 2019 I posted an article where I revealed that the priceline of Cardano was forming a shark pattern.
RSI had still some cushion to move in oversold zone and moving average convergence divergence (MACD) was still strong bearish, therefore there was more possibility that the price action will definitely complete the final leg of Shark which was being formed at that time below was the article:
As per Fibonacci sequence the targets were as below:
Buy between: $0.04315 to $0.02760
Sell between: $0.05788 to $0.08991
As per above targets this trade had potential to produce upto 255% gains.
Finally we witnessed that since Dec 2019 to Jan 2020 the priceline of ADA moved up and sofar it has produced up to 138% profit.
Price Correction Started After One And A Half Month:
If we examine the price action of Cardano then it will be realized that since 1st Jan to 14 Feb 2020 there the ADA was moving up in a very bullish manner that there is not even a single red candle stick appeared during this period even it has broken down all simple moving averages from 25 to 200 during this period every professional trader was expecting a price correction move which the Cardano was not making even with every day the buying volume was more being increased that was a clear indication that bull has completely taken over the bears and they are in charge now.
The Moving Averages And Their Bullish Formation:
Now if we move one step back from 2 day to daily chart then here the simple moving averages with time period of 25, 50, 100 and 200 have almost formed an alligator’s bullish opened mouth there is only one move left and that is the golden cross between 100 and 200 SMAs once this bull cross will be formed we can witness a new and more powerful bull rally like once it was happned in April 2019 when Cardano gained more than 80% value from $0.5910 to $0.10687.
Similarity Of Moves Of Price Action:
Now if we switch back to 2 day chart again then in previous move we can see some resemblance with current move when the price action moved up without any price correction from 4TH Mar to 3rd April 2019 and then ADA dropped upto 0.618 (61.8%) Fibonacci level which is considered as ideal drop or retracement among professional traders and Cardano also had a 50 simple moving average support at this leve, and the price action took bullish divergence from this level achieved higher than previous high.
This time the price action is seems to be taking the same move as we can observe that it has moved up from jan to Feb 2020 without any correction and now it is being retraced.
Sofar it has achieved 1st level of ideal retracement upto 0.382 (38.2%) Fibonacci but this time the ADA is in more stronger position than previous move coz from Mar to April 2019 the price action did not have the 200 SMA support even at that time the 200 SMA moving down from a long distance above the price action but this time we have 200 simple moving average support between 0.382 to 0.50 (38.2% to 50%) Fibonacci level therefore this time there are more chances that the priceline will start upward move after taking bounce from 200 SMA and that moving average this time lies at $0.5492.
So most of the professional traders might set this 200 simple moving average as their stop loss and most of the traders may place their buying positions at this level by setting the same 200 SMA as their stop loss.
Conclusion:
At this time there are two decision making levels one is simple moving average 200 and the other one is Fibonacci level of 0.50 (50%) if the price action of Cardano will be successful to retest these levels as support and bounced from here then we may see more powerful bull rally which will lead to achieve an higher than the previous high but if the priceline won’t be successful in retesting these levels as support then we may see the drop up to 0.618 Fibonacci level which is at $0.04753.

#Cardano | USDT Breakout !#ADAUSDT
We notice that the price has breached the descending channel, and we expect a period of bullishness in the coming weeks for the #ADA coin
Do not hurry to buy, the price may go down to good places
Do not risk a large amount of your money
Please share your opinion in the comments box and do not forget to press the like button
Add to watchlist

💎 CARDANO/USD - Very bullish pattern right here! STRONG BUYHello everybody!🧑🏻🚀 If you like this chart THUMB UP!👍 CARDANO shows very strong pattern name "Ascending Triangle". Also we can see Stochastic RSI in the beginning of rising.
With a strong crypto market we can see the breaking of the triangle and jumping to the drew level!
Good luck! All targets on the chart!
___________________________________________________________________________________________________________
Subscribe to my channel and receive fruitful recommendations regularly!
😎 Here just clear and accurate ideas🎯! Max profit idea in crypto - 20%(BTC), Max profit in stock - 40%. Total profit more 300%. Trade my own funds. Consult privately🎩. Link to table with summary results: clck.ru

ADA price can be hit 0.1 short or long ?ADA price can be hit 0.1 short or long ? 80% price gain last 30 days

Possible 50% return on ADA CardanoWe see ADA testing the median line of the Inside Pitchfork, but nicely rejecting the downtrend.
If ADA can hold above the trend line it may shoot for the median line of the Original Pitchfork
for a 50% roi.
Possible targets to take profits are around:
- 0.063 at the 1:1 extension based of the proposed wave 1
- 0.066 around de negative 0.618 fib level
- 0.075 around the 0.382 of the impulse started dec. 2018
- 0.081 around the median line of an original pitchfork and a 1.618 extension

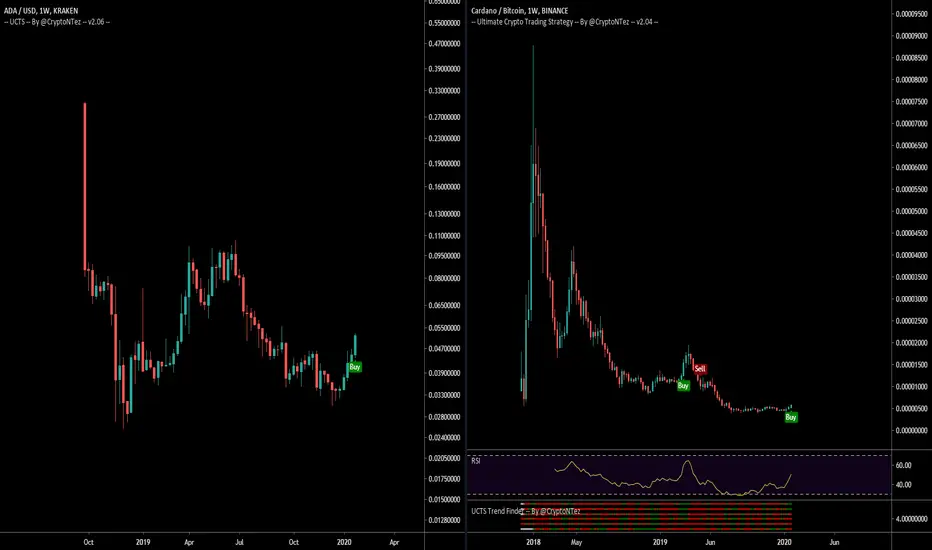
$ADA, UCTS Buy signals flashing on the weekly chart(/BTC & /USD)$ADA
UCTS Buy signals flashing on the weekly chart (both /BTC & /USDT)
👀👀
#ADA
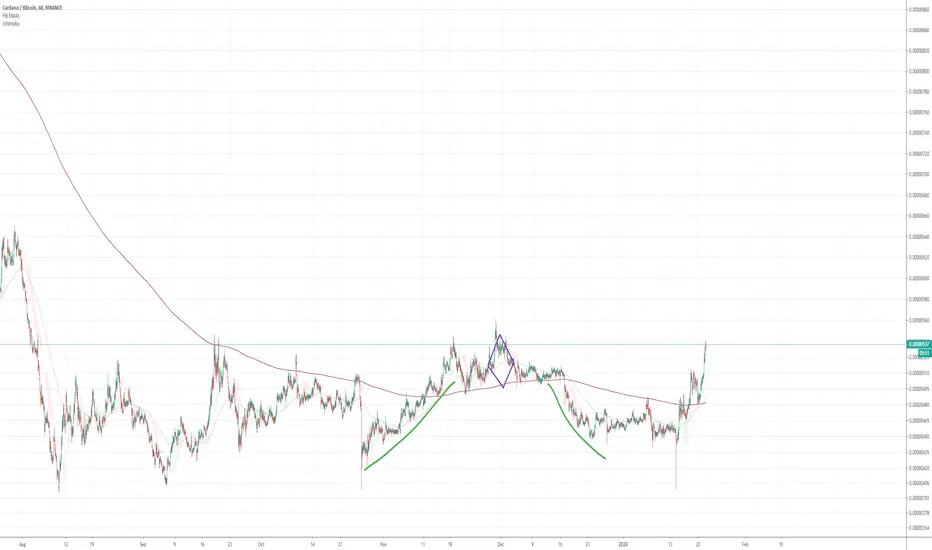
ADABTC Prolonged Diamond TopProlonged diamond top, some symmetry can also be observed which is common with diamond tops and bottoms. Little price action has been observed in ADABTC, will the recent move change this?
ADAUSD formed bullish Butterfly | Upto 42% bullish movePrice action of ADA / US Dollar has formed a bullish Butterfly and entered in potential reversal zone.
This PRZ area should be used as stop loss in case of complete candle stick closed below this area.
I have used Fibonacci sequence to set the targets:
Buy between: 0.030579 to 0.027430
Sell between: 0.033018 to 0.038963
Regards,
Atif Akbar (moon333)

ADAUSD formed bullish Shark | Upto 30% movePriceline of Cardano / US Dollar cryptocurrency has formed a bullish Shark pattern and entered in potential reversal zone.
This PRZ area should be used as stop loss in case of complete candle stick closes below this zone.
I have used Fibonacci sequence to set the targets:
Buy between: 0.03638 to 0.03371
Sell between: 0.03866 to 0.04393
Regards,
Atif Akbar (moon333)

ADA USDT - LongI believe ADA is completing a corrective B wave. C wave should break the corrective trend line afterwhich we should look forward to equal or high to previous rally.
My belief is that we should achieve 10c soon.
Again this is all depend on market conditions and BTC

ADAUSD formed bullish Gartley | Upto 15.5% bullish movePrice action of ADA / US Dollar has formed a bullish Crab and entered in potential reversal zone.
This PRZ area should be used as stop loss in case of complete candle stick closed below this area.
I have used Fibonacci sequence to set the targets:
Buy between: 0.036468 to 0.034954
Sell between: 0.037668 to 0.040523
Regards,
Atif Akbar (moon333)

ADAUSD forming bullish Crab | A good long opportunityPrice action of ADA / US Dollar is forming bullish Crab pattern and soon it will be entered in potential reversal zone.
This PRZ area can be used as stop loss point in case the complete candle stick closes below this area.
I have used Fibonacci sequence to set the targets:
Buy between: 0.035495 to 0.034474
Sell between: 0.036107 to 0.037879
Enjoy your profits and regards,
Atif Akbar (moon333)

ADAUSD formed bullish Crab | A good long opportunityPrice action of ADA / US Dollar has formed a bullish Crab and entered in potential reversal zone.
This PRZ area should be used as stop loss in case of complete candle stick closed below this area.
I have used Fibonacci sequence to set the targets:
Buy between: 0.22065 to 0.21907
Sell between: 0.22236 to 0.22581
Regards,
Atif Akbar (moon333)

ADA - SOON TO BE AT DECISION POINT - CryptoManiac101ADA / USD
Fractals indicate for decision point to come shortly
Consider waiting until resistance break for entry

ADAUSD formed bullish Cypher | A good long opportunityPriceline of Cardano / US Dollar cryptocurrency has formed a bullish Cypher pattern and entered in potential reversal zone.
This PRZ area should be used as stop loss in case of complete candle stick closes below this zone.
I have used Fibonacci sequence to set the targets:
Buy between: 0.043167 to 0.042398
Sell between: 0.043784 to 0.045267
Regards,
Atif Akbar (moon333)

ADA. ALL TARGETS ACHIEVED !! IM BACK FOR YOU MF, ROUND 2.ADA. IM BACK FOR YOU.
ALL TARGETS ACHIEVED ON LAST ANALYSIS.
Now we are presented with another gold opportunity.
We hit a double top.
Falling down towards previous resistance
This yellow zone should flip to support.
THIS is our entry zone.
Expecting strong wave off new support.
Targeting Triple top.
Followed by a new wave to spark pump into daily res block / 200 MA region.
Lastly, Im itching for that T4 Long term double top.
This baby is ripe.
Follow me,
Lets get this bread MF!
BUY NOW, PROFIT LATER.
______________________
XSR PREMIUM SIGNAL:
Entry: 501-505 sats
Target 1: 531 sats
Target 2: 545 sats
Target 3: 569 sats
Target 4: 629 sats
_____________________
Remember,
"WE DONT HIT STOP LOSS, WE HIT TARGETS"
- LL XSR <3

ADA !! IF YOUR NOT LONG, YOUR WRONG. BUY NOW, PROFIT LATER MF !!Ill keep this short and simple.
If your not long, your wrong.
ADA has triple bottomed in support.
Clear accumulation phase inside 400 sat region.
...Its time to shine ADA...
**There is a lower high downward trend showing its cards..
BUT!
We will break that wall down with ease.
Trust the process.
ADA PRIME XSR SIGNAL:
Entry: 470-475 sats
Target 1: 492 sats
Target 2: 507 sats
Target 3: 524 sats
Take all profit by T3, dont set a stop loss upon the T3 arrival, take the W home to bed with you.
Snuggle..cuddle... wait for the retrace.
Ill update chart upon profit destination :D
BUY NOW, PROFIT LATER !
Remember...
"WE DON'T HIT STOP LOSSES, WE HIT TARGETS!!"
- LL XSR <3

ADAUSD formed bullish Butterfly | A good long opportunityPriceline of ADAUSD / US Dollar cryptocurrency has formed a bullish Butterfly pattern and entered in potential reversal zone.
This PRZ area should be used as stop loss in case of complete candle stick closes below this zone.
I have used Fibonacci sequence to set the targets:
Buy between: 0.04147 to 0.04117
Sell between: 0.04171 to 0.04229
Regards,
Atif Akbar (moon333)
