BITCOIN =140-150kThe X-wave has formed in the form of a neutral triangle pattern, and eventually Bitcoin could once again touch $106,000 and move towards $140,000-150,000 with the completion of wave-e.
Good luck
NEoWave Chart
Cashdata-plotter

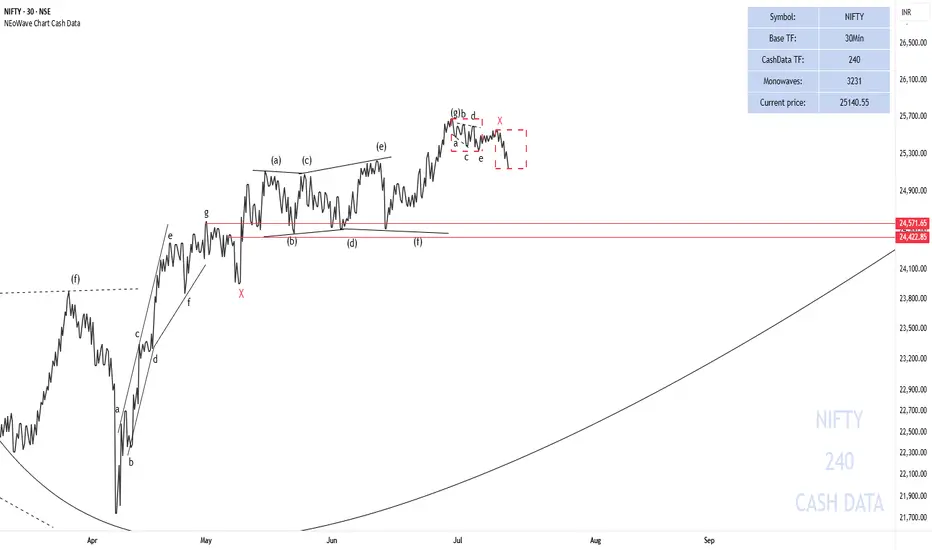
Will NIFTY make a price correction?
My first scenario is still valid and I think it is more likely to happen. It seems that Wave-g has ended from the second pattern and I think NIFTY50 will decline at least to the price range of the X-wave and there we need to check the waves again to see what pattern is forming. To confirm this scenario, a break below the key level of 25000 is very important.
I have also proposed a second scenario that this correction may be an X-wave and after that the price can eventually grow to 25680-26133 and spend time there to complete the third pattern. This scenario is also valid as long as the price remains above the level of 25000.
The price correction that is forming can be a double combination pattern like triangle - X - diametric or triangle - X - triangle.
Good luck
NEoWave Chart
Good luck
NEoWave Chart
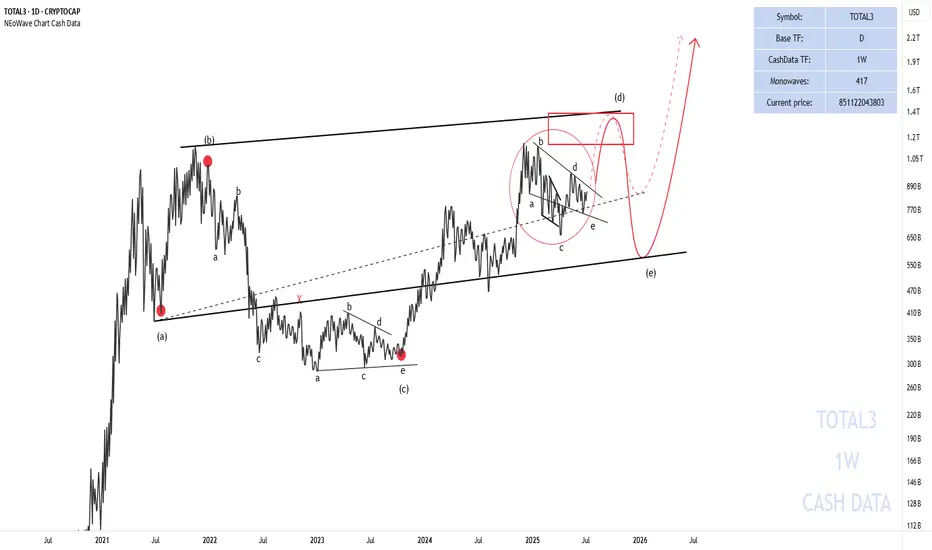
Has the Alt Season Started?Total 3 seems to be forming a neutral triangle (marked with a red circle) and will soon move towards the red box to complete wave-(d) of the higher degree triangle.
The price path is marked for you on the chart.
Good luck
NEoWave Chart
Cardano and Diametric Pattern
We are currently in wave-g of the Diamond Diametric and it could continue to 0.43.
After the completion of the Diametric, if the Double Combination pattern does not form, we expect an uptrend to form. (The post-pattern movement will show us whether the Diametric has completed or not).
Good luck
NEoWave Chart

BANKNIFTY is moving towards 59000The monthly Cash Data chart is forming a diametric pattern. Waves (a) through (f) have completed and we are currently in the middle of wave (g) of the diametric pattern.
This wave is moving towards 59,000

Silver correction is nearing its endSilver is completing a bow-tie diametric pattern, currently in wave-f. After the diametric completes, there is a potential for an upward trend to form.
Good luck
NEoWave Chart

Will Natural Gas Prices Increase?Weekly Cash Data shows a sharp downtrend that stopped at 2.05 and then formed a sideways trend. Given the size of wave-(c) and the time of the waves, it seems that a reverse contracting triangle pattern is forming.
Currently, wave-(d) has ended and wave-(e) has begun. Under normal circumstances, we expect this wave to decrease to the point indicated by the red arrow, and in terms of time, this wave can continue until the time range of August 12-September 12 unless a political or geopolitical event occurs that causes wave-(e) to be shortened.
So, to trade, you must have a strategy along with analysis.
Good luck
NEoWave Chart

Start of Wave-(b) and Neutral Triangle As I said in the second paragraph of the previous analysis, wave-(a) ended at 3500 and the gold price fell by 7% (over 2000 pips) and now wave-(b) has started.
1M Cash Data Chart
I think that a neutral triangle or a reverse contracting triangle is forming, with the completion of wave(b) we can somewhat understand which pattern is forming.
