CAT
Bullish Case CAT Long or calls 4-3 WeeksCat, was one of the best performers in the past, and even they are raising forecast, every single Quarter, and yet this stocks has been sold of because of china trade history, honestly i think that this stocks is clearly oversold, and cheap, and what i see right now is that this stock is heavy shorted, and could cause a short squeeze also hourly chart is telling me that broke down trend medium term, so i bougt calls ITM $130 that expire in dic 21 3 weeks, from now, honestly if there is even hope that this trade issue could resolve this stock is going to hit $140-145 by that period, so maybe is time to take some risk and go! If you are long the stock maybe stock loss at $130 GL to everyone!


Bitcoin Daily Update (day 262)I believe that it is possible to beat the market through a consistent and unemotional approach. This is primarily achieved through preparing instead of reacting. Click here to learn more about how I use the indicators below and Click here to get my complete trading strategy! Please be advised that I swing trade and will often hold onto a position for > 1 month. What you do with your $ is your business, what I do with my $ is my business.
My recent Bitcoin Bubble Comparison - 3 Day Chart led to the following calls: < $5,750 by 11/15/2018 & my prediction for the bottom is $2,718 by 1/20/19 | My Bitcoin Bubble Comparison - Monthly Chart closely mirrored my price and time targets | Calling for $35 ETH before the end of 2018.
Previous analysis: “the next daily fractal that I am seeing is at $4,265 and that is exactly where I am expecting the next selloff to find support.”
Position: Short BTC:USD from $6,353 (profit taken on 80% of position) | Short ETH:USD from $205.20 & $196.32 (profit taken on 70% of position) | Short EOS:BTC from 0.000808 | Short LTC:BTC from 0.00758
Patterns: Trying to break out of down trend from yesterday but having trouble.
Horizontal support and resistance: S: $4,020 - $4,193 | R: $4,428
BTCUSDSHORTS:There was that big spike I was waiting for. Looks like big players have been taking out large shorts over the past couple days.
Funding Rates: Longs pay shorts 0.1021% (holy cow)
Short term trend (4 day MA): Today’s candle didn’t even test the 4 MA
Medium term trend (9 day MA): Right in line with expected horizontal resistance at $5,000 - $5,200
Long term trend ( 34 day MA): Has just started to rollover
Overall trend: bear
Volume: Today’s volume was the most we have seen since July 24th. It is red but I am viewing the volume as bullish (at least for now) due to the hammer candle that closed. Price broke down below $4,200 and the selling volume really picked up. However support held strong at $4,000 and a bullish wick resulted. IMO this is effort exceeding result and we should get a bounce.
FIB’s: My FIB line at $4,262 has held strong. Have not seen a 4h candle close below.
Candlestick analysis: 4h and daily hammer candles on high volume is very bullish (at least for now)
Ichimoku Cloud: 15m cloud has been very helpful for resistance. Higher TF’s are not very useful right now.
TD’ Sequential: Daily r5 | 4h hit a r9 + s13 yesterday
Visible Range: Next average volume node is $3,619 - $4,366 | Next high volume node is $2,015 - $2,761
Price action: 24h: -9% | 2w: -32.2% | 1m: -31.36%
Bollinger Bands: Another close below the bottom band. Watch for price to close back inside and then return to MA which is > $5,750
Trendline: Price broke out of 15m channel from yesterday’s post and is trying to support a throwback
Daily Trend: Bearish
Fractals: From yesterday’s post: “the next daily fractal that I am seeing is at $4,265 and that is exactly where I am expecting the next selloff to find support.” So far that fractal held as support since price closed above.
RSI: All time lows on Daily
Stochastic: Pulling back after buy signal failed
Summary: I am very confident that we are going to bounce from $4,000 support. I have been eyeing this area for months due to the gap in volume at $5,000. I did start buying back some spot BTC’ at an average price of $4,225.
However I am not turning bullish / calling for a bottom and I want to make that very clear. I simply believe that there is a high probability that I will be able to sell at my profit targets of $5,000 & $5,750.
I have scaled out of my BTC:USD and ETH:USD shorts capitalizing on a very nice profit and leaving a portion in play just in case $4,000 breaks down. If that happens then I will have no problem holding onto my spot BTC' and if we do get a strong bounce then I will have no problem holding onto the small short positions that remain open.
If we do get a strong bounce then watch for a serious alt selloff. People will be FOMO’ing back into BTC’ and I expect support to evaporate very quickly. Capitalizing on BTC:USD and ETH:USD shorts and then putting that profit into alt:btc shorts while buying spot BTC as a hedge seems like a great trade over the next 1 - 24 hours. (for ex: short ETH:BTC, LTC:BTC, XRP:BTC, EOS:BTC and then buy spot BTC').

Trading the Dead Cat Bounce Pattern.The DJT daily chart corresponds to the chart published in the article "Trading the Dead Cat Bounce Pattern."

No Time for Comfort As Brakes Screech On the Oversold BounceAT40 = 35.5% of stocks are trading above their respective 40-day moving averages (DMAs)
AT200 = 34.8% of stocks are trading above their respective 200DMAs
VIX = 17.4
Short-term Trading Call: bullish
Commentary
Hold up. Pump the brakes. The bounce from oversold conditions just got more difficult as sellers forced buyers to come to a screeching halt.
The S&P 500 (SPY) fell 0.9% in what looks like a “close enough” failure at downtrending 50-day moving average (DMA) resistance. In a bit of good news, the index also bounced picture-perfect style off its 200DMA support. I will call it a stalemate.
{The S&P 500 (SPY) looks like it is caught in a trading range as buyers fail to punch through the previous peak or 50DMA resistance. The bounce from 200DMA support was a bit of good news.}
The tech-laden NASDAQ and the Invesco QQQ Trust (QQQ) were not as fortunate as the S&P 500. Both lost 200DMA support with the NASDAQ gapping down for a 1.7% loss and QQQ slicing through support for its own 1.7% loss. Adding insult to injury, at their intraday lows, both indices reversed their post-election gains.
{Momentum for the NASDAQ came to a screeching halt after gapping below 200DMA support.
The Invesco QQQ Trust (QQQ) bounced from its low of the day, but the buying was not enough to recover 200DMA support.}
The selling was not enough to rattle the volatility index, the VIX. The VIX only gained 3.8% and even fell sharply from its high of the day. The VIX still looks ready to continue its post oversold implosion. Accordingly, I bought a fresh tranche of put options on ProShares Ultra VIX Short-Term Futures (UVXY) with a 2-week expiration.
{The volatility index, the VIX, gained for the second straight day but could not even manage a close above Wednesday's intraday high.}
The currency markets showed some signs of stress in-line with a risk-off day. The Australian dollar (FXA) weakened and the Japanese yen (FXY). As a result, AUD/JPY suffered a notable pullback. I will not get concerned until/unless 200DMA support gives way. I used the pullback to build a slightly larger long position on AUD/JPY.
{AUD/JPY pulled back on a risk-off day across financial markets. The pair is still holding onto a bullish 200DMA breakout.}
A reversal like Friday’s makes bulls doubt their rationale for excitement just two days ago and gives bears reason for fresh skepticism. AT40 (T2108), the percentage of stocks trading above their respective 40DMAs, tells me to be cautious, but not to downgrade my short-term trading call of bullish. AT40 dropped back to 35.5% and is still in the early stages of a rebound from oversold conditions. AT200 (T2107), the percentage of stocks trading above their respective 40DMAs, only dropped to 34.8% from Wednesday’s peak of 37.4%. I am more inclined to think that the market will churn and digest gains from the rebound. I will reconsider the bearish case if the S&P 500 closes below its 200DMA support.
I stuck to my post oversold strategy of buying the dips and bought SPY call options. I plan to sell these into the next bounce. However, my core position in iShares Russell 2000 ETF (IWM) call options experienced a big setback. With just a week to go before expiration, Friday’s 1.8% pullback was enough to wipe out most of the profits in those call options. I will now need to sell into the next bounce rather than wait for what I still think is an imminent retest of 50DMA resistance.
{The iShares Russell 2000 ETF (IWM) lost 1.9% but bounced off its 20DMA support. }

GE isn't THAT badTargeting a short-term bounce on GE here, typically these blue chip stocks when in heavy over-sold territory at a minimum show some short-term recovery when fear and PERCEIVED risk is high. Good opportunity to play the bounce here.
Disclosure: I have no position in GE.

THE WEEK AHEAD: US MID-TERMS; SQ, MRO, ROKU, ATVI, HTZ, YELPUnless you've been living under a rock, you'll know that Tuesday is the U.S.'s mid-term elections. Polls will be open throughout the New York session and won't close until we're well into the Asian with polls closing on the East Coast first and then gradually progressing west through time zones. Actual results aren't likely to be known until at least 9 p.m. or so CST, so if you're going to play, you're potentially in for a long night. The only instrument probably worth looking at from a liquidity/volume standpoint for scalping around the time of election results is the E-mini S&P futures (or a corresponding proxy) and/or futures options, which is why I've posted a marked-up /ES chart here, which identifies fairly transparent, large time-frame horizontal support/resistance areas, so that when you drill down into lower time frames, you'll have those for context. Naturally, this is not as big of a deal as the general elections (if you recall, a really wild ride that was basically over by NY open), but may present some good scalping opportunities. On Tuesday night after NY close, I'll drill down a little more in time and mark up the chart a little further ... .
Aside from the elections, we've got some earnings on tap, too: OXY (96/34) and MYL (89/48) announce earnings on Monday after market close; LLY (82/29) and CVS (70/35) on Tuesday before market open; SQ (83/73), MRO (72/51), and ROKU (69/96) on Wednesday after market close; ATVI (85/46), DIS (73/26), HTZ (89/96), and YELP (83/72) on Thursday after market close. My preference in single name is for underlyings with a rank >70 and a 30-day >50, so I would lean toward playing SQ, MRO, ROKU, ATVI, HTZ, and/or YELP as volatility contraction plays. This is particularly nice here, since those all occur after the elections, which will allow the broader market to sort itself out first.
On the exchange-traded fund front: USO (100/32), XOP (70/37), EEM (73/26), IWM (65/24), and QQQ (62/26) round out the top implied volatility rank exchange-traded funds on my list.
Since I'm already in most of the exchange-traded funds (although I don't have any RUT on): CAT (78/36) already announced earnings, but still has some volatility left in it, as does NFLX (69/53), so I could see selling in a little premium in those if the post-election market just gives me nothing better to do ... .

$CAT retracement from ATHPrice ranging in the 116 area. Lets see if it holds 50% fib retracement level.

$CAT Techinically meaning: you can't mess with the market right now, you better step aside.
$CAT #Caterpillar

A Second Oversold Period Gives 200DMAs A Fresh ChallengeAbove the 40 (October 18, 2018) – A Second Oversold Period Gives 200DMAs A Fresh Challenge
October 19, 2018 by Dr. Duru
AT40 = 15.8% of stocks are trading above their respective 40-day moving averages (DMAs) – 2nd day of oversold period following 4-day oversold period
AT200 = 33.9% of stocks are trading above their respective 200DMAs (up 6 percentage points)
VIX = 20.1 (15% increase)
Short-term Trading Call: bullish
Commentary
The 200-day moving averages (DMAs) still feature prominently in the market’s now protracted struggle to slog through oversold trading conditions. Almost like magic, the S&P 500 (SPY) closed the day right on top of its 200DMA after a 1.4% loss.
{At the intraday low, the S&P 500 (SPY) almost completed a full reversal of the gains from the day of the oversold breakout. Buyers rallied just enough to close the index right at its 200DMA.}
The NASDAQ was not quite as fortunate. Its 2.1% loss on the day pushed it just below its 200DMA. The Invesco QQQ Trust (QQQ) lost 2.3% but stayed above its 200DMA support the entire day.
{The NASDAQ closed below its 200DMA for the 4th trading day out of the last six.}
The Invesco QQQ Trust (QQQ) lost 2.3% but is still holding onto 200DMA support and an abandoned baby bottom.}
Sellers added emphasis to the return of bearish sentiment with a return of the volatility index, the VIX, to the “elevated” level of 20.1. The VIX immediately went from looking poised to drop below the 15.35 pivot to looking like it is ready to launch higher than the last high.
{The volatility index, the VIX, gained 15% to close right at the 20 level which is considered the start of "elevated" readings.}
On the currency side, the Australian dollar (FXY) versus the Japanese yen (JPY) faded from 50DMA resistance but at least it did not make a new low. At the time of writing, AUD/JPY reversed the previous loss and thus printed a potentially bullish sign for Friday’s trading. (For more background on the relationship of AUD/JPY to the S&P 500 see “The Australian Dollar and Japanese Yen Are Still Useful S&P 500 Signals“).
{AUD/JPY is rallying in a direct reversal of the previous day's negative sentiment. AUD/JPY has yet to break down to a new 2018 low.}
AT40 (T2108), the percentage of stocks trading above their respective 40DMAs, dropped to 15.8% for a second day of this latest oversold period. The trading action is starting to look similar to the churn that occurred from April to May of this year as the S&P 500 bounced from and dropped to its 200DMA support while only once closing below that support level. A friend of mine helped me realize the high potential for the market to get stuck in another protracted period of churn until at least the mid-term elections in the U.S. (November 6, 2018). After all, almost a week into earnings season nothing has happened to break the market’s back or to assure buyers to continue a journey out of and away from oversold conditions. I will keep this scenario in mind if the market starts to frustrate both buyers and sellers.
When the S&P 500 first hit its 200DMA I bought a fresh tranche of call options. I prepared to buy a lot more if sellers washed out the close. After buyers started taking the indices off their lows, I hit the reset button on my volatility fades with puts expiring in 2 weeks on the ProShares Ultra VIX Short-Term Futures (UVXY). I also took profits on more hedges. The largest outstanding hedge was a fist full of put options on Caterpillar (CAT). This phase of oversold trading always puts my convictions and analysis to the test. While the stock market struggles to bounce out of oversold conditions, I have a strong temptation to try to time and game the setbacks with bearish positions. The problem is not just in getting caught with too many bearish positions when the market suddenly snaps back from an oversold stretch but also in taking away time from identifying the even more attractive upside opportunities.

VALEO - Is it the right time to enter ?On January 18, EURONEXT:FR stock price was around 66€, close to its all-time high. 9 months later, Valeo has been almost divided by 2 with the formation of a very specific type of technical price pattern. The "Dead Cat Bounce"
As defined by Helen Alpino, the dead cat bounce comes a time in a downtrend when bear traders decide to take profit. Bull traders believe that the downtrend has come to an end and that the bottom has been reached. This is what we have seen from March to May 2018 with a 50% retracement.
Technically, we can also clearly identified the Elliot Waves and we can now consider that we are in wave 5 . The fibonacci extension of Wave 1 is around the 2/2,272 which confirm the end of Wave 3. Finally, volumes are in increasing since June 18.
From now, several options can appears:
1. Wave 5 finishes the down trend around the support area (tested 2 times as you can see on the chart and we could expect a strong reaction.
2. We consider the Wave 1 to project the Wave 5 end which give us target around 27€
Q3 results (forecasted for end of October), strongly awaited by the market, will definetly give the trend for the next months.
My recommandation : Remain attentive to EURONEXT:FR . We arrive on the downtrend end where we could face a strong bull reaction

CBIS Pulse is faint but pulsing with research quivers...Watch CCI momentum with MACD here. . . future profits and earnings TBD. Await patents and studies. Expect they'll eventually have to sell the farm here to pay for all the cannabis / hemp studies. Ent Value / Mkt Value is 1.02. A new medical advisory board for new medical products. One patent issued 2017 for treatment of neurobahaviors and could lead to positive litigation...TBD. This is a watch and wait scenerio for entry...@pokethebear
Studies mainly on Endogenous cannabinnoid family, which are produced in our bodies, vs natural occuring phytocannabinoids from cannabis, or made synthetically. CBIS studies may be specific to proving scientific value as neuromodulators and their absorption/binding to the our bodies fatty lipid areas/tissues and possibly dosage. If there's a pHD in the room to help confirm wording here, but the study and health benefits of CBD, CBDA, CBG, CBGA, THC, THCA, 9-THC, 9-THCA, 8-THC and THCV. Aka proving the science to the F&DA each endocannabinoid does something specific (sleep aid, pain releif, epileptic med., ADHD/ADD med., reduce inflamation, anxiety, psoriasis (skin inflammation), slows bacterial growth, inhibit cancer cells (first study published), stimulate appetite, reduce vomiting/diarrhea, and several other benefits.

Bitcoin Bounce in effect?I see two targets as possible 'relative' highs
first target at $6547.00
second target at $6741.00
followed by continuation of trend to the down side
--if the maximum bounce is seen if price meets the $6741.00 target --> sell off to sub $6k to somewhere around $5950.00
---> followed by bounce to $6260.00 range
---> followed by the 5th wave down to range of $5750
this is strictly based on fractal or repeat of a previous price decline from an earlier time frame.
this is merely a thought exercise.

Bitcoin Daily Update (day 193)I believe that it is possible to beat the market through a consistent and unemotional approach. This is primarily achieved through preparing instead of reacting. Click here to learn more about how I use the indicators below and Click here to get my complete trading strategy! Please be advised that I swing trade and will often hold onto a position for > 1 month. What you do with your $ is your business, what I do with my $ is my business.
My latest Bitcoin Bubble Analysis led to the following predictions: 1 day - 28 days = < $5,750 | bottom prediction: $2,860 by 10/30
Previous analysis / position: “Still waiting on a bounce off support before continuing the draw down” / Short ETH:USD. Took profit on 33% of position improving my average cost basis to $317.37 per ETH.
Patterns: Descending triangle / 4h bear flag
Horizontal support and resistance: S: $6,126 - $6,166 | R: $6,200? | $6,380
BTCUSDSHORTS: Continuing to pull back after a slightly lower high.
Funding Rates: Shorts pay longs 0.0349%
12 & 26 EMA’s (calculate % difference): 12 = -8.04% | 26 = -8.69%
50 & 128 MA’s: 50 =11.36% | 128 = -13.73%
Volume: Current selloff is significantly above MA on 4h chart.
FIB’s: 1 = $6,039 | 0.886 = $6,300
Candlestick analysis: Prior 3 day candle engulfed the 3 before it. 4h hammer
Ichimoku Cloud: C clamp on the 4h
TD’ Sequential: 1h is currently on a 9. Daily is on a 4
Visible Range: 2 month lookback has point of control (POC) at $6,400. 3m-1y all have POC between $6,300 - $6,400. Expect that to become strong resistance.
BTC’ Price Spreadsheet: 12h = -3.98% | 24h = -3.94% | 1w = -13.76% | 2w = -7.63 | 1m = -7.78%
Bollinger Bands: Just about touched the bottom of the daily band on this last selloff. Bouncing from bottom 4h band.
Trendline: N/A
Daily Trend: Bearish
Fractals: Just broke through another down. Next one = $5,855 | Up = $7,437
On Balance Volume: Moving down with price, no div’s
ADX: ADX continues to move up while -DI and +DI continue to diverge, as would be expected.
Chaikin Money Flow: Moving down with price, it’s a little worrisome how far daily and weekly have to fall before becoming overold.
RSI (30 setting): W = 48.29 | D = 42.89 | Similar to CMF’ it’s a little worrisome how far daily and weekly have to fall before becoming overold.
Stoch: Weekly getting ready to make bearish crossover. Daily is reaching oversold territory.
Summary: When the markets start moving I like to pay close attention to the shorter term MA’s to give me an idea of when to expect consolidation and/or a correction to the upside. In one of my Telegram groups someone pointed out the 20 and 200 MA’s on the 4 hour chart and said to watch for the death cross.
I noticed that the price tends to retest the 200 MA before selling off again and think that will be a great area to place some orders to sell
The 4h bear flag breaking down on volume tells me that we may not make it back to that area. I always watch for the breakdown of the flag itself as well as horizontal support from the pole, both of with occured. Still having one third of my short position open on ETH makes me feel comfortable either way.
If you are not in a position and you didn’t sell the 4h bear flag then it is time to wait. If we get a bounce then you get a high percentage short. If we don’t get a bounce then you need to be okay with missing out on a move.
Today is Saturday, go outside and enjoy the beautiful summer weather! Even if you are in a position, set your stop loss and forget about it!


BTC in the channel. MAX Target $7500BTC jumped from lowwer channel into higher one. Previous resistances changed into support. The Dead Cat still flying until the next stronger resistance or breaking channel. RSI indicates a bit energy left in the air to glide up.

cat long or short ideaTime cycles seem to line up with dip buying chance if you want to get long or if you feel like a short could use them to time a top not an exact science. This trade has headline risk with being a trade war going on.

WHALES: Can guys kill two birds (or Kittens) with one pump? BTCOver the past weeks I have witnessed the first hand power of the almighty Catbox. I decided to try one myself. This is a highly speculative trade and will likely result in 100% failure. No financial advice here guys- just a dude playing with Microsoft paint on steroids.

Upcoming Death Cross on the 50 and 30 Week MA'sIt's not time to get too excited just yet. Still holding onto my $4,200 target in October. I am a bear until we get above $12,000 and trade above long term moving averages that are in a bullish posture. Won't be re-opening a short just yet, will be waiting to see how the MA's hold as resistance.

CAT LONG OR Short IdeaTrade wars is going to hurt it or not it's up to big money holding the stock. Boxes are where i see price hitting in the next week to two. Will investors pull money of this and other US leaders and start putting it to work in other markets? Which markets would you pick?

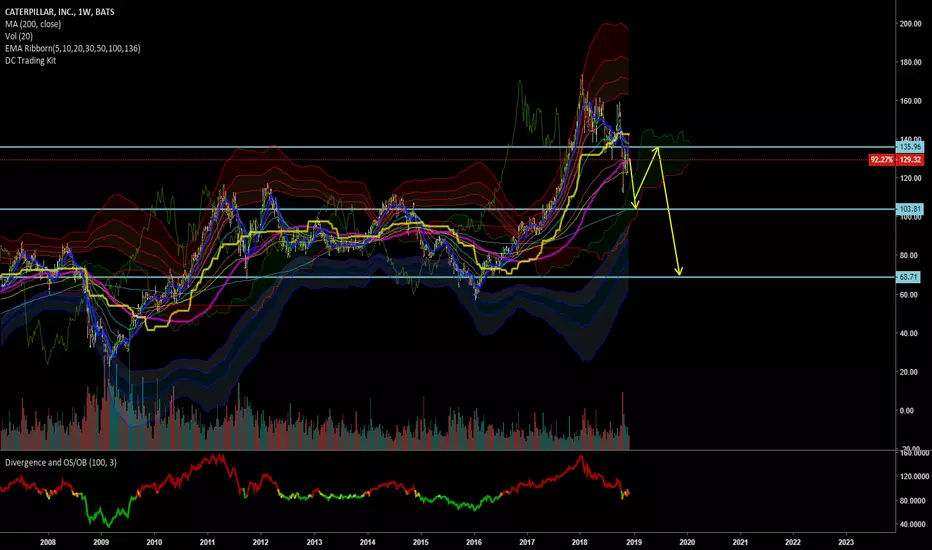
$CAT Entry position on parabolic uptrend line$CAT a dow stock had a large correction near the parabolic line support, alot of support going back to 2014 at e $118, best entry would be at $129 on the parabolic support line however all the FUD that has come from TRUMP and trade war fake news has already shown its effect and held up well around the $130 support line.
Recommended LONG at current price of $135 and dollar cost average in onto the lows of $120, if major support lines get tested and break at $119 sell, good place to place your stop losses.
I dont own any $CAT atm but entering position for a LONG TERM hold here at these levels dollar cost averaging down to the $120 supports.

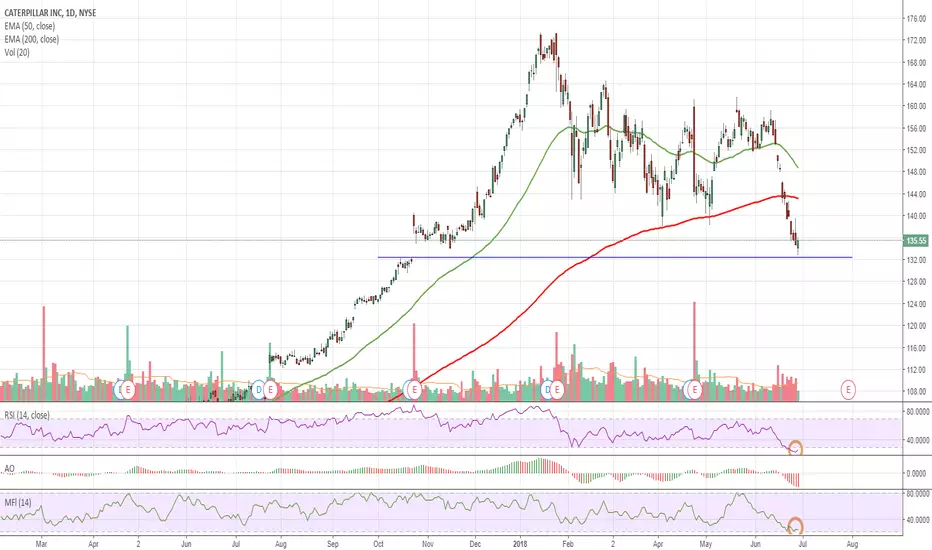
$CAT Oversold Catching Support$CAT Caterpillar looking oversold on the daily chart - catching support at gapfill around $132.50 today, already bounced nearly $3 intraday. Expecting continuation to at least $140 in the very near term, possibly further. Breaking through the 200d ema will be crucial for additional gains, may see some resistance there.
Note this stock has been one of the equities affected by trade war concerns, beware it could make a significant move in either direction with further trade war developments and/or POTUS tweets.
Note: Observation/opinion, not investment advice.