3/31 Watchlist + Notes SPY - Going into todays session, I mentioned that I had a bullish bias that I was only 75% confident in due to the downside gap that remains unfilled on the daily, and because we were sitting on a daily upper trendline. SPY gapped up for the second day in a row and closed green, confirming our overall analysis, but created a failed 2U, which leads me to believe that we could be overextended short term and may see some downside going into Friday's session. The weekly chart is strong and is showing that we are breaking out of this downtrend we have been in looking at the weekly chart. I have a feeling tomorrow could be a day of consolidation or pull back to try to fill in the small gap created in the daily from yesterday and today. Final Thoughts: I am Neutral/Bearish going into tomorrow. If we do see upside, I would imagine we peak at the 405 area on SPY. I can't Imagine we push too much higher until next week.
Watchlist+ Bias:
(No daily chart inside setups showed up on the scanner from today's session)
FDX - 3-1-2U weekly : Bullish. Looking to test 226.06 tomorrow/Monday
DOCU - 2-1 Weekly: Bearish
CAT - 2-1 Weekly: Neutral
Main Watch:
DOCU - Interesting setup with this one. DOCU has a 2-1 weekly that is still not broken out of, even this late in the week. It also has a 2-3-3 daily, which is what I am most interested in for this play. The 2-3-3 setup has created a big broadening formation. Today was a huge red engulfing day, which is why we have bearish bias going into tomorrow. Additionally, DOCU is in a pretty neutral place currently after being in a 14 Month downtrend, which tells us that we are now consolidating and looking to either continue further down or reverse according to longer timeframes. My targets to the downside are 56.01 and 55.24. I will only play downside, not upside.
Yesterday's Main Watches:
JNJ - (Status:) Loser (Personally Trade?) No
JNJ gapped up over yesterdays high during the premarket session, invalidating the setup because I usually do not play inside setups if we open above/below a long/short entry level. JNJ quickly fell back into yesterdays range and rejected yesterday's high a few times showing that it was weak to the upside. Overall just didn't play out how we wanted, but that's just part of trading
GOOG - (Status:) Winner (Personally Trade?) No
GOOG opened within yesterday's range, then broke yesterday's low, which was our entry short. GOOG immediately dropped down to our target at 100.28. It hit 100.29 before reversing. The main takeaway from this play is that it was nearly textbook perfect in terms of entry, and target. Cons ran just over 50% in a matter of 2 minutes. Unfortunately, this trade would have been very tough to realistically take due to how fast it moved and completed the move we wanted. Situations like this are sort of a win because we know our analysis was spot on, but the price action moving too fast was the only reason we couldn't capitalize on this trade.
Watchlist Stats For The Week:
3/4 on SPY Predictions
3/5 on Main Watch Plays
Top Winner: NVDA (75%+)
Personal Stats:
5/7 For The Week
Overall Green/Red?: Green
Personal Note: Most likely will not have time to trade tomorrow, but regardless if I do or don't, on Sunday night I will provide analysis about tomorrow's session and what I am looking at going into Monday
CAT

CAT Swing Long Reversal UPDATECAT is now bottoming for a SALE just in time for seasonal construction and agricultural upticks.
The long view is a long uptrend that started in September and ended with a lousy earnings report in
early February. The beatdown is now ending perhaps for fundamental reasons including CAT
has cash and down not need high-interest rate costs.
See the chart for the analysis. See also the previous idea. Check DE.
I see this as an intermediate-term swing long or investment or a good choice for a long expiration
call contract of options.

CAT Swing Long ReversalCAT has a downtrend 10% from its 30-day high.
However, fundamentally the industrial is holding up quite well.
The downtrend was inverse parabolic accompanied with
an appropriate volume pattern showing 3X relative volume
This is sometimes called the retirement trade pattern
or V-type pattern. CAT has dropped to three standard
deviations below the anchored VWAP /
This makes it undervalued well below fair value.
I see this as a good setup for a long swing trade or a call options
contract with the expectation of a 50% retracement of a
10# drop or a 5% price target For the call options I will
target the anchored VWAP at a strike of $243 about 12 DTE.

CAT - Technical Breakdown on watchCaterpillar is on the verge of triggering a bearish topping formation.
This stock has been a powerhouse during the rising rate environment.
if this market leader breaks down its signaling weakness in the economy and likely the industrial sector.

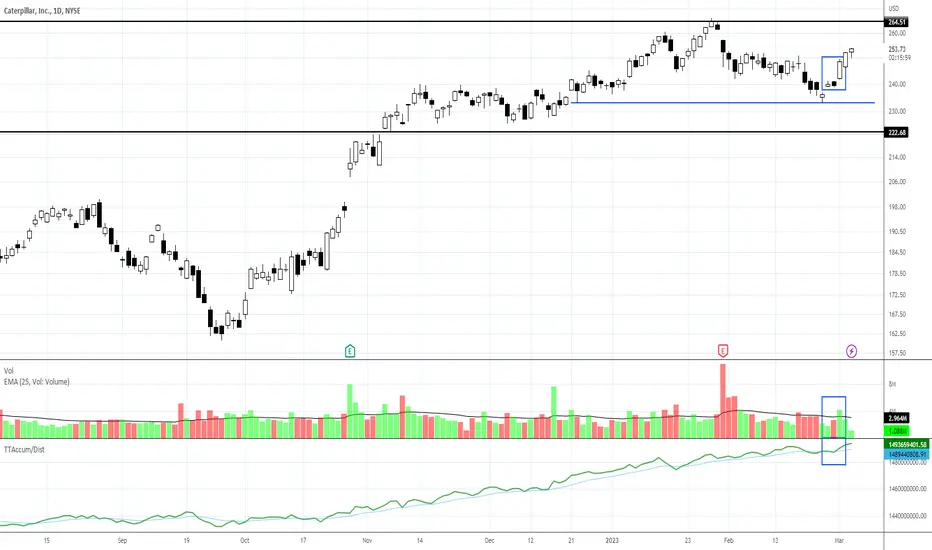
CAT: Range Bound Swing TradingCAT developed one of the entry signals I teach this week. The stock rebounded from testing the lows of the trading range. Hybrid indicators suggest large-lot buying is triggering in the lows of the range.
Point gain potential may be limited by the sideways trading range developing, but swing trading can be done within the range if you can catch the entry early in the upswing from the lows and plan to exit near the highs.
This trading range will need to compress near the highs to sustain a breakout to the upside.
CATERPILLAR SHORT 2 distinct possibilities, but the RR is great.
HIGHLY dependent on SnP and US30 ofcourse, broader market implications are always extremely important to keep an eye on.
Nonetheless, wouldn't be surprised to see the first position be a sweep of wicks and then retest of lows.
Second position would mean we sweep highs of wichs but also fill the gap above before we dump to retest lows.
Let's see.
NFA.

$CAT: low risk short ideaGood to try and short some stocks as well, here and there when buying things...In this case the stop is rather tight (see green dashed line) and downside ample, and as a bonus different to everything else out there.
Worth a shot, best of luck!
Cheers,
Ivan Labrie.

TSLA Relief Rally *Be Careful-(Short Term Bullish)***Warning Monday Jan 2nd (Market is Closed) - Q4 EV Deliveries - good report then TSLA will complete H&S pattern and continue Bullish Island Gap Reversal
Positive:
`TSLA is Very Oversold, we could see a continuation of this bounce up too 150-180 if production release is great on Monday.
-Bullish Chart patterns show inverse H&S pattern created by Island Gap Reversal.
LARGE Buying Volume strong-sign of institutional investment - this could be accumulation phase
Beginning of January tends to be positive for the stock market
NDX & SPX showing signs of upcoming relief rally (*before we make final leg down)
HYG & JNK Bonds are showing bullish divergence
Negative:
Monday possible less deliveries than expected -if is lack luster I can see TSLA dropping 7-12% to retest the low
China Covid Cases/ Shanghai Factory Slow production
Tesla is still in a Strong Bear Market pattern
Elon and Twitter Drama
Earnings report on the 23rd - with factory issues, supply issues - it does not look promising
Macro H&S Pattern puts the measured decline to $90-$80 range
Sentiment:
Short Term -Swing /Day Trading -I am only Bullish for the Short Term* (1-2 weeks) .
Long Term Investing: I am Bullish for Long Term (5 yrs) ....over-all I would choose the $109 area as 1st pt accumulation / $80 area second point / $60 area 3rd pt (TSLA will Grow 25% Sales YoY for next 5yrs) PEG ratio looking good

Bitcoin | Dead cat bounce?The trend drawn from the ATH level of 2011 looks like a pullback movement in the red line. Price can say that the sloping trend line is a pullback movement after it broke down in November of last year. As for the RSI indicator, as indicated by the red circle in the figure, the situation is very close to the scene of the sudden fall in the summer of 2015.
In general, the 15500 zone was the bottom of the bear market, and most traders are anticipating the market with the belief and hope that a bull run has begun. As far as I'm concerned, the bear market is not over and we expect to see another new bottom. This upward movement that has been going on since the beginning of the year is seen as a possible "Dead Cat's Reflection". It is too early to tell if this is the case, as the rate will prove to be a dead cat by breaking below the previous bottom.

CAT Short Good time for a starter position on CAT, the EV steam will wear off when the markets roll over.

ARKK Oversold for NowARKK is looking oversold for the time being. Looking for a nice DCB before seeing some capitulation sell off.

CAT - 9 lives, 1 left CAT sitting on the front steps of a very dangerous channel where historically we have seen blowoff tops and waterfall selling anytime we're here....
.... Complacency?


W Bottom to Momentum Run Example: CATWeekly Chart of CAT: this is one of the Dow components that is nearing its previous all-time high resistance levels. It is one of the first few Dow 30 stocks to challenge prior all-time high prices.
Caterpillar Inc. has been running with momentum that will now pause or stall at this level. Now, watch to see which support level holds as profit-taking continues.
This is NOT a trading range but an intermediate-term correction ending with a W bottom. Important to note the differences. A bottom after a correction tends to set up for momentum runs that can sustain longer than they do within a trading range.

CAT4HR RSI broke down along with price TL. Weekly RSI went up rather quickly and so did daily. Looking for a pull back to the first golden pocket and then maybe the 200 moving average if it dumps that hard.

CAT ShortCAT is up about 50% from its September low. Earnings also booth their performance, they are almost reached their all-time high. I think that CAT will retest EMA below to take a breath. I grabbed some puts for this underlying

CAT SELL++++CAT is overbought and approaching a triple top which is very strong resistance and difficult to achieve. Overbought on several indicators and time frames. Targets are $226 and $215 in short term and ADD every $5 increase in share price.

CATCAT breaks 238 and could head over to 245 which could be the top and then reverse down, but if this does break and hold 245 this could head over to 251 and 255. There is also a FVGAP which could be filled at some point. a Rejection at 238 will bring this down to 232, 226.

CAT Caterpillar Inc Options Ahead of EarningsLooking at the CAT Caterpillar Inc options chain, i would buy the $180 strike price Puts with
2022-12-16 expiration date for about
$6.71 premium.
Looking forward to read your opinion about it.

DEAD $CAT. Bearish on CATERPILLAR INC. Price just reached a previous support zone and failed to break above so Im going to assume it will act as a resistance zone and be looking for this to playout as a large retest after its previous rally. Usually this rising wedge pattern plays out by returning back to the bottom but with the $VIX being $2 short of $30 I womt assume that due to the amount of chop that could be experienced in the way down. Ill be looking for exit majority of position @ 173.11 and the rest @ 168.

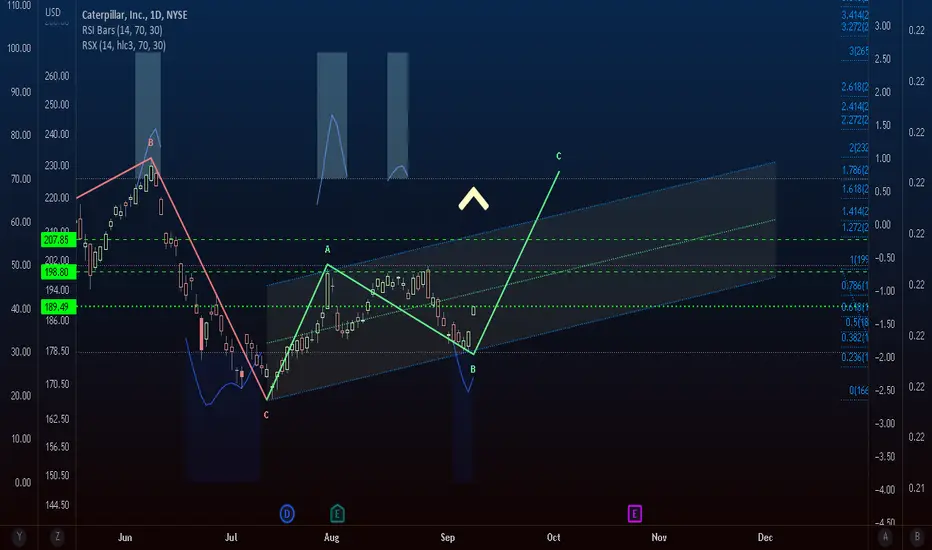
Caterpillarr moving it. CATFinal leg in a fractal. Fast and gap-ing form, indicative of an impulse. Betting on a Wave C, relying on Fibs to draw two goals.
We are not in the business of getting every prediction right, no one ever does and that is not the aim of the game. The Fibonacci targets are highlighted in purple with invalidation in red. Confirmation level, where relevant, is a pink dotted, finite line. Fibonacci goals, it is prudent to suggest, are nothing more than mere fractally evident and therefore statistically likely levels that the market will go to. Having said that, the market will always do what it wants and always has a mind of its own. Therefore, none of this is financial advice, so do your own research and rely only on your own analysis. Trading is a true one man sport. Good luck out there and stay safe.
SPY: Very bearish! What could make it bounce?• So far, SPY is heading to the next support at $360.69, indicating we have a few more bucks to drop, and there’s no technical evidence pointing to a reversal. In the daily chart, at least, there’s not a single bullish pattern yet;
• We see some open gaps (yellow squares), and they will become targets, in the future, if (and only if) SPY triggers a reaction;
• In the 1h chart we see a possible bullish structure, a Double Bottom chart pattern. Keep in mind, this pattern wasn’t triggered yet, and maybe SPY won’t trigger it at all, but it is important to keep in mind a scenario where it’ll break the $370.21;
• By triggering this Double Bottom, SPY would bounce back up to the $388 (its next target);
• In my view, I would prefer to see it bouncing after a retest of the $360, but this could work too;
• This wouldn’t be a true bullish reversal sign, and maybe would be just a Dead Cat Bounce, but could be the beginning of a true mid-term reversal. I’ll keep you guys posted on this.
Remember to follow me for more analysis like this! Keep in touch.

CAT - BEARISH SCENARIONThe CPI report released yesterday surprised the market participants with worse-than-expected results.
The higher inflation weakened the stock market and caused a huge sell-off.
Caterpillar Inc was not spared. The price dropped more than 4 % and closed below the 0.236 Fibonacci.
Continuation of the downtrend and re-test of the $ 167 support level is expected.
Risk Disclosure: Trading Foreign Exchange (Forex) and Contracts of Difference (CFD's) carries a high level of risk. By registering and signing up, any client affirms their understanding of their own personal accountability for all transactions performed within their account and recognizes the risks associated with trading on such markets and on such sites. Furthermore, one understands that the company carries zero influence over transactions, markets, and trading signals, therefore, cannot be held liable nor guarantee any profits or losses.
