CEI Camber Energy Bullish - BlackRock increased Ownership in it!On 5/7/2021 BlackRock Inc. reported 472,687 shares of CEI Camber Energy worth $0.49M, an increase of +47,268,600% and 1.891% ownership in the company.
If you do the math, they bought the shares at 1.03usd!
Now you have the opportunity to buy them lower than BlackRock Inc at 0.60usd!
Average daily Volume is 8,539,760
Market Cap is only 34Mil
Using the Fibonacci extension tool, my price target is 2.1usd!!
Now you tell me if it is a gem or not!
CEI
CEI Still StrongChart posted 6-8-202-9:37 am. I am back. I took last week off to go to Vegas. Looks like many of the calls played out. CEI continues to look very strong to the upside. We went from a shark pattern into a cypher pattern and have held the bounce point. The original call played out to 72 cents (see linked chart on original call). I am expecting to see higher prices from 71 cents. If it does retrace that's fine (place your stops to those who use them).. as long as we dont go below the D leg of the cypher I am bullish still. Target around 91 cents. CHEERS!
CEI Long IdeaOBV showing a wide discrepency vs spot. I am long here looking for a move possibly to .70s in the short term. Stop below the daily range its been in. Size appropriately.
CEI Trade SetupDeep value areas, stop loss at or below all time low, easy place to manage risk and simple targets based on previous highs.
May consider setting 1st target closer to 200MA (maybe $1.2) if your ok with lower R:R and concerned about pump-n-dump (which this one tends to do often)
Not really a valid harmonic, but close. Solid XABCD stuff tho, IMO
CEI Possible tradeHello traders,
As you can see CEI is in a very important support line, I expect to start climbing toward the green lines.
I will update every time it hit a green line.
*** This is not a financial advice, I'm still a beginner trying to share my Road here.
Thank you.
CEI coming back to life..Chart posted 5-26-2021 1.07pm - This is a very early call on CEI . I know this wont be a popular equity. This is a very small cap stock but great potential. Made a ton on it back in Nov 2020... But we are set to see some good swing up as it sold off pretty hard. Check the chart history.. and set stops here. But I think we are going to see some upside. I dont think I have my historical chart on this, but this is a small small formation.. and given price of the equity.. the gains can be real. Just set stops...
CEICamber Energy Inc (NYSEAMERICAN:CEI) Price should become explosive if this chart pattern is broken to the upside with volume. I would go long this stock on a move above $1.14 for a day trade.
CEII do believe Camber Energy Inc (NYSEAMERICAN:CEI) will bounce and with continued positive crude Oil news that bounce will turn into a significant trend higher. Add this merger/spec Oil name to your watchlist, this is a knife worth catching.
$CEI 133,442,000 Barrels of Oil Reserves PT $10.00As of March 31st, 2020 the company had an estimated proven oil reserve of 133,442,000 barrels of oil comprising of
54,850 million barrels of crude oil reserves - 43,955 million barrels of NGL reserves and 207,823 million cubic feet of natural gas reserves.
The company also has upcoming merger with the Viking Energy Group Inc. which is estimated to close within the next two months.
Camber EnergyStock Symbol: CEI
Getting candle cross on weekly, bounce around previous low.
This is looking like a shift in momentum to the upside.
Accumulation phase
Diversify and use 5% stoploss
----------------------------------------------------
We just realesed our new course! Follow our tradingview page and visit the link in our bio if you are looking for new strategy to add to your arsenal.
Use Promo Code: FIRST100 to receive $50 off of your course!
First come, first serve / Code valid for first 100 buyers. Normal price $99
---------------------------------------------------
Thank you for your continued support, God bless you though these times.
- Major League Trader
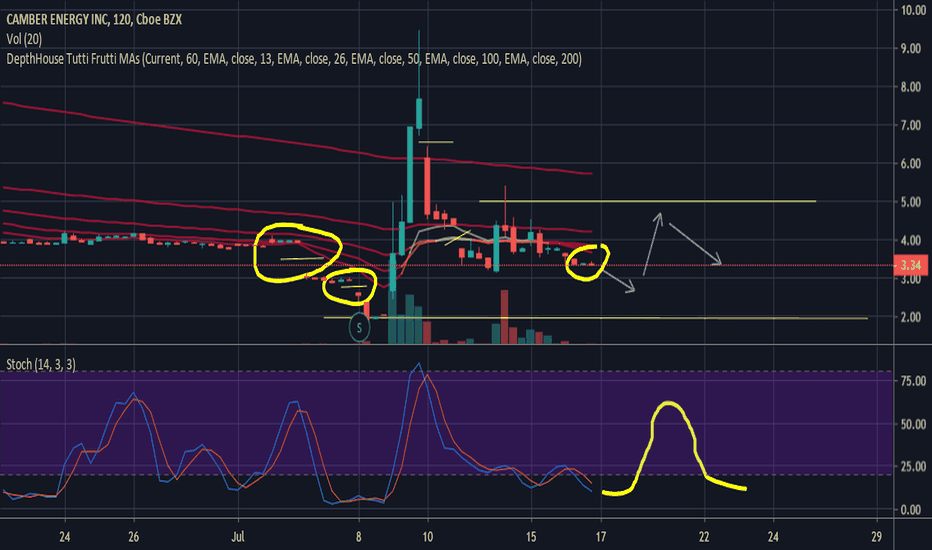
Update on #CEIThis is where resist or support will be confirmed for the next move. With the volume dying off it's possible to see another dip down. Looks like retrace from the massive $9 spike. Still confident it will increase over the next week-2 weeks. Breakout above $4.93 is going to be difficult.
Learning from a Loss #CEISo I got into this stock in a stupid place. I'm taking the opportunity to learn and hopefully this helps other people.
I knew beforehand NOT to enter during a sudden jump and did anyway. As quickly as it comes up, it can come down.
Mistakes aside. It's a learning experience. I have a light idea of what CEI will do next by noticing what it did before the jump.
My expectations are not another jump to $9. Rather, my expectations are a drop first. If you look at the yellow circled area you will notice two things:
A) It almost looks like little tiny Shooting Star Candlesticks. The wick is small, which to me means either indecision with buy/sell or a dropdown. If the wicks were really long like a traditional Shooting Star it's almost a bet it goes down.
B) The second note is it was the END of DAY. On the Market Open, a gap down to the lower price. If you look at 7/16/2019 on my chart you can see the exact same pattern as before the spike. The Stoch-RSI is bottomed out like before the spike. This is telling me it will gap down down July 16 into 17, 2019.
Recovering losses: Hypothetically let's say you entered at $7. Knowing this gap is about to happen you can save yourself at least some loss by not selling at a lower price when it gaps down. Rather, it would be much better to see if it will swing back up and gain some (probably not all) of the price. I've drawn a yellow line at $5 ad given a POSSIBLE movement of the Stoch-RSI as well as a POSSIBLE path the stock will take over the next few days. Should it recover to $5 you minimize your loss.
You could sell and just take the hit. Or you could ride it out. The problem with riding it out is the chance the pattern repeats and gaps down the following day making your loss worse. I would set a limit on acceptable loss. $1.92 would be a huge loss if it went to the previous low. Let's say at $3 I set my limit. Yours may be different (this is all hypothetical). If it hits my $3 and swings back up to $5 over the following days I can handle that.
This is all a learning experience for me (and us) so hopefully this helps someone using my own experience with this stock.
THIS IS NOT TRADING ADVICE: Just an example of what I've done: (As a side note my numbers were way different and losses were already taken and I've moved on.)
Will Support Hold For Round 2?Going to be watching CEI for continuation trade tomorrow, after hours we are sitting at support at 5.90, watching to see if we can hold here and break back above the median line and retest, for an entry long. Today Camber Energy, Inc. Announced the Acquisition of Lineal Star Holdings giving it the boost it needed to have the big run today, along with the announced stock reverse split 1-20 yesterday.
CEI Acquisition NewsNews today "May-15-19 08:00AM Camber Energy Announces that Lineal Star Holdings Has Entered Into A Letter of Intent to Purchase An Engineering and Procurement Firm". Shs Float 12.53M, Market Cap 3.69M. Watching for continuation.
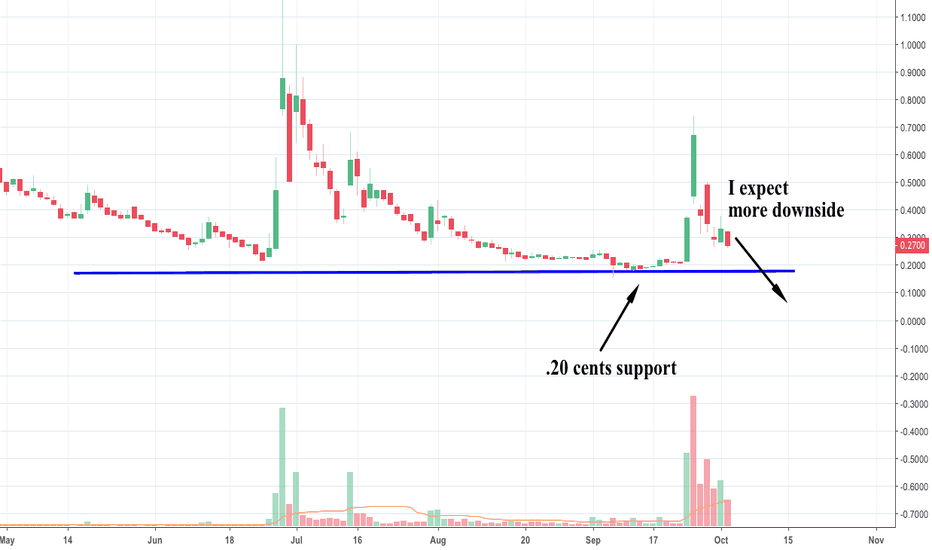
More Downside in Store for CEIBearish on this stock
clearly drifting towards support of around .20
expect a pop the closer you get to .20
ultimately; stock might breach support at .20
intermediate target = .15 cents.
CEI News of Debt SalesCEI along with other oil stocks were up in trading today. Looking at CEI levels here is where we stand for support and resistance based on its price history. The name of the game here is compliance. In order for CEI to be listed past august it needs to get its share price at $1 per share. In order to remain compliant they have sold off there debt and made there financials more attractive to investors. Volume for the day was enormous at about 24 million share. Bullish momentum continued into ah.
CEI - Swing Idea Risk/Reward - Possible reversalCEI Possible swing idea / momentum play
RSI divergence moving positive and is at 27.3
MACD is also moving closer to par level
Higher low
Short Float at 9%
Oil Sector Industry
Swing Entry - Risk 2-5c depend on entry
Enter at .60-.65
Price Target are in Green (I am usually looking for 10%+ move)
Stop loss 3c below support (which is the colored in orange in my price line)
4/11: Volume came in today and made NHOD .72 ; Oil number was good -- I think there will be more growth here.
finviz.com
DayTrade Entry:
Over .72 with volume
Stop loss .03-.05c
Remember to take profits when it hits 7-10% daily (or move your stop loss up)
Good luck!
CEI Day predictions (DAY TRADER)Hard to read atm. but I noticed a possible bullish chart movement just need to make sure that the premarket looks good with valid volume
ON WATCH


