#Celo coin market structure analysis#CELO
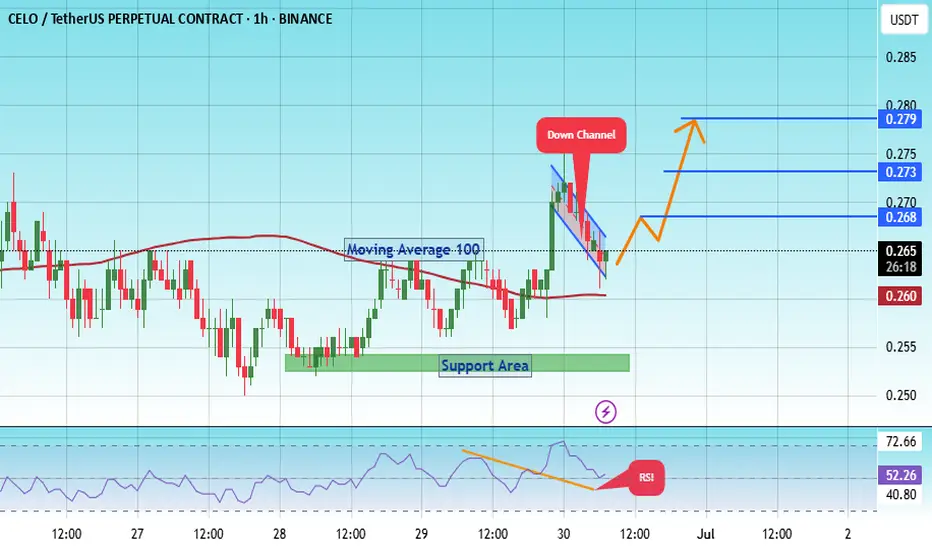
The price is moving within a descending channel on the 1-hour frame, adhering well to it, and is on its way to breaking it strongly upwards and retesting it.
We have a bounce from the lower boundary of the descending channel. This support is at 0.262.
We have a downtrend on the RSI indicator that is about to break and retest, supporting the upside.
There is a major support area in green at 0.253, which represents a strong basis for the upside.
Don't forget a simple thing: ease and capital.
When you reach the first target, save some money and then change your stop-loss order to an entry order.
For inquiries, please leave a comment.
We have a trend to hold above the 100 Moving Average.
Entry price: 0.265
First target: 0.268
Second target: 0.273
Third target: 0.279
Don't forget a simple thing: ease and capital.
When you reach your first target, save some money and then change your stop-loss order to an entry order.
For inquiries, please leave a comment.
Thank you.
Celo
#CELO/USDT Forming Descending Channel !#CELO
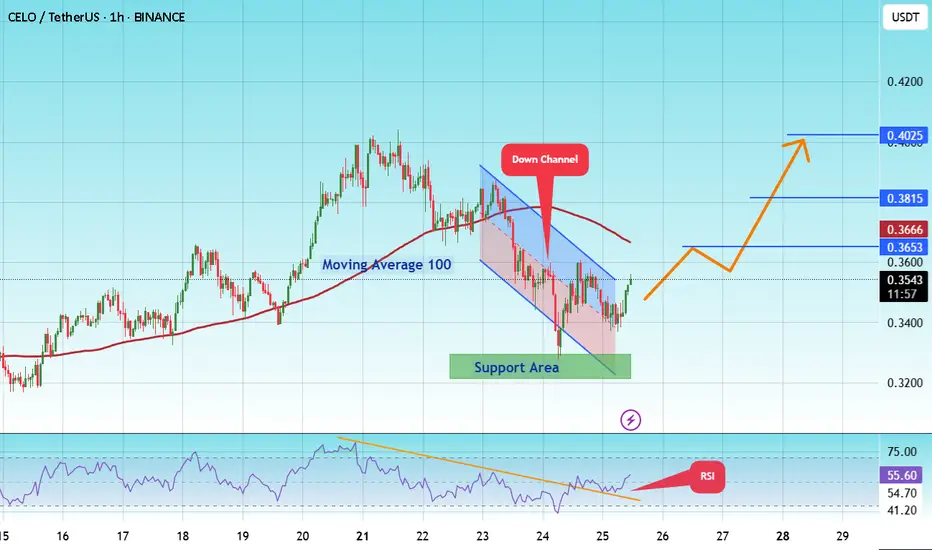
The price is moving within a descending channel on the 1-hour frame and is expected to break and continue upward.
We have a trend to stabilize above the 100 moving average once again.
We have a downtrend on the RSI indicator that supports the upward break.
We have a support area at the lower boundary of the channel at 0.3300, acting as strong support from which the price can rebound.
We have a major support area in green that pushed the price higher at 0.3233.
Entry price: 0.3539.
First target: 0.3653.
Second target: 0.3815.
Third target: 0.4025.
To manage risk, don't forget stop loss and capital management.
When you reach the first target, save some profits and then change the stop order to an entry order.
For inquiries, please comment.
Thank you.
CELOUSDT 1DCELO ~ 1D Analysis
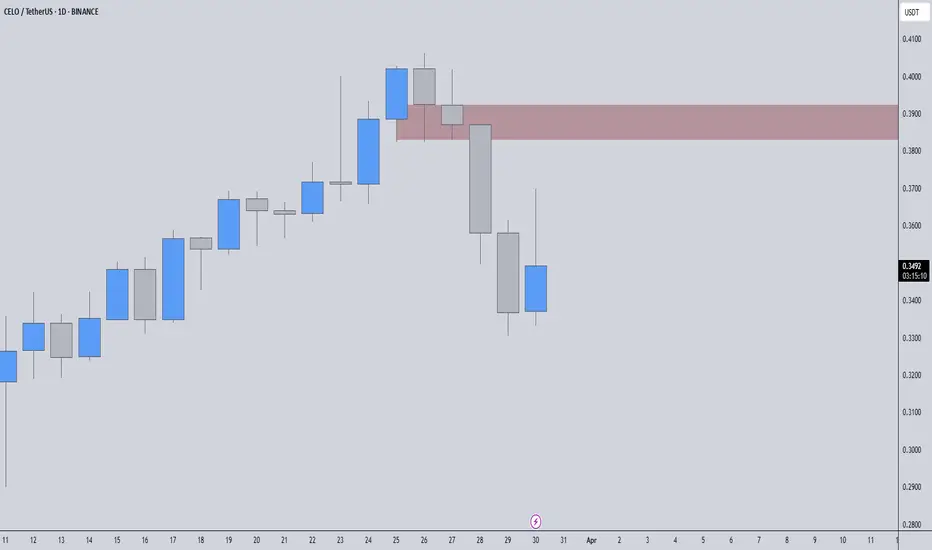
#CELO Buy gradually after successfully penetrating this resistant line with a short -term target of at least 10%+.

CELOUSDT – One of Today’s Highest Volume Gainers! CELOUSDT – One of Today’s Highest Volume Gainers! 🚨
🔴 Key Resistance Zone:
The red box marks a critical resistance level where we’ve historically seen strong selling pressure. This isn’t just any level—this is where liquidity gets tested, and weak hands get trapped.
📉 How to Approach It:
✔ Short Bias: If price fails to reclaim this level and gives a clean rejection, I will look for short setups with confirmation.
✔ Break & Retest: If price breaks above with volume and successfully retests, I might consider looking long, but only under strict conditions.
🔥 Why You Need to Follow This:
I don’t just pick random levels. I have secret protocols that give me the highest win rate here—these strategies are unknown to most traders, which is why they struggle while I dominate. You’ve seen it before, and you’ll see it again.
📌 Don’t Miss the Opportunity:
These markets move fast. If you want the best entries, follow closely because I post these levels in real-time. Most traders don’t understand these advanced techniques, but that’s why I’m here—to make sure you’re on the winning side.
📌I keep my charts clean and simple because I believe clarity leads to better decisions.
📌My approach is built on years of experience and a solid track record. I don’t claim to know it all but I’m confident in my ability to spot high-probability setups.
📌If you would like to learn how to use the heatmap, cumulative volume delta and volume footprint techniques that I use below to determine very accurate demand regions, you can send me a private message. I help anyone who wants it completely free of charge.
🔑I have a long list of my proven technique below:
🎯 ZENUSDT.P: Patience & Profitability | %230 Reaction from the Sniper Entry
🐶 DOGEUSDT.P: Next Move
🎨 RENDERUSDT.P: Opportunity of the Month
💎 ETHUSDT.P: Where to Retrace
🟢 BNBUSDT.P: Potential Surge
📊 BTC Dominance: Reaction Zone
🌊 WAVESUSDT.P: Demand Zone Potential
🟣 UNIUSDT.P: Long-Term Trade
🔵 XRPUSDT.P: Entry Zones
🔗 LINKUSDT.P: Follow The River
📈 BTCUSDT.P: Two Key Demand Zones
🟩 POLUSDT: Bullish Momentum
🌟 PENDLEUSDT.P: Where Opportunity Meets Precision
🔥 BTCUSDT.P: Liquidation of Highly Leveraged Longs
🌊 SOLUSDT.P: SOL's Dip - Your Opportunity
🐸 1000PEPEUSDT.P: Prime Bounce Zone Unlocked
🚀 ETHUSDT.P: Set to Explode - Don't Miss This Game Changer
🤖 IQUSDT: Smart Plan
⚡️ PONDUSDT: A Trade Not Taken Is Better Than a Losing One
💼 STMXUSDT: 2 Buying Areas
🐢 TURBOUSDT: Buy Zones and Buyer Presence
🌍 ICPUSDT.P: Massive Upside Potential | Check the Trade Update For Seeing Results
🟠 IDEXUSDT: Spot Buy Area | %26 Profit if You Trade with MSB
📌 USUALUSDT: Buyers Are Active + %70 Profit in Total
🌟 FORTHUSDT: Sniper Entry +%26 Reaction
🐳 QKCUSDT: Sniper Entry +%57 Reaction
📊 BTC.D: Retest of Key Area Highly Likely
📊 XNOUSDT %80 Reaction with a Simple Blue Box!
📊 BELUSDT Amazing %120 Reaction!
I stopped adding to the list because it's kinda tiring to add 5-10 charts in every move but you can check my profile and see that it goes on..
CELO LONGCelo has bounced every time it touched the lower range around $0.40, usually reaching at least $0.25.However, given the current market conditions, I expect either more downside or a sideways movement in the next few days.
The Stoch RSI is gearing up for a bullish cross on the weekly, but historically, the first cross is often followed by a negative one, before a second bullish cross that truly pushes the price higher. So while we might see some short-term upside, we should also be prepared for lower prices before a more significant rally kicks in.

CELOUSDT 1WCELO ~ 1W Analysis
#CELO This is key support for this coin. This loss of support will be a big pressure on this coin. Bounce from here Bullish will begin to hold back control.

CELOUSDT 1WCELO ~ 1W
#CELO If you still have Conviction on the coin,. This support block would be a very good buying place for now,. Buy from here with a minimum target of 20%+

CELO Journy to 2$ will be quick Don't miss CELO move as its about to break the heavy resistance from 1.0XX to 1.1XX ,
once its flip that area to support it will have Aniece Rally toward 2 $ Area
taking profit along the way will be great and DCA from here to lower if retrace will be even much better

CELO 1D. 100% Growth Potential You Can’t Ignore! 12/07/24BINANCE:CELOUSDT demonstrated strong performance in November 2024, driven by a strengthening market trend and strategic developments. Key growth factors include increased activity within the Celo ecosystem, boosted by a newly launched initiative aimed at improving network resilience and attracting developers. As part of this program, the platform announced support for projects in sustainable finance (DeFi) and microfinance, enhancing investor confidence in the ecosystem.
Technical analysis suggests a robust bullish global trend for CELOUSDT, supported by a steady daily trading volume exceeding $81 million and a 92.75% correlation with Bitcoin, making the token attractive for both short- and long-term trading strategies.
Trading Setup
Futures Entry Limits:
0.9773
0.9000
Take Profits:
1.2157
1.4030
1.8129
No stop loss recommended.
Spot purchases are also viable at current levels, with the option to accumulate further on dips. The growth potential exceeds 500%.
Adhere to proper risk management (1-2% of deposit per trade).
Wishing you profitable trades!

Can #CELO Bulls Maintain the Current Bullish Momentum Or Not? Yello, Paradisers! Is #CELOUSDT gearing up for a breakout or will we see a reversal? Let’s break down the current setup for #CELO and what it could mean for traders:
💎#CELO is showing a textbook cup-and-handle pattern on the daily timeframe, signaling a potential bullish continuation. Currently, the price is hovering around the $0.9437 level, with key resistance lying at the $1.10-$1.30 supply zone. A decisive breakout above this zone could spark a strong rally and attract fresh buyers into the market.
💎If #CELO clears the supply zone, the next target lies around the $1.80-$2.20 range, aligning with the measured move of this pattern. This breakout would confirm a major shift in market sentiment, signaling renewed strength for the bulls and marking a significant milestone for CELO’s recovery.
💎On the flip side, if the price fails to break above the supply zone, it could retest the support zone at $0.733. If the support zone also fails, such a move could trigger a selloff toward $0.58 demand zone, reinforcing bearish sentiment.
💎There should be a bounce from the demand zone. However, losing this level will transfer control to bears for a deeper retracement before any potential rebound.
Stay focused, patient, and disciplined, Paradisers🥂
MyCryptoParadise
iFeel the success🌴

celo is bullish there's high risk in this shit coin be carefull
be patient and don't be greedy
this is my analyse it's not a recomandation to buy or sell !!

CELO price is now on the verge of a foul #CELO price is now on the verge of a foul
But it is being stubbornly held and pushed upward with a “saw”, so there is a chance that it will be pushed to $0.95-1 or even $1.20-1.28 in this wave of growth
However, when making trading decisions, you should take into account the fact that the safe buy zone for OKX:CELOUSDT is in the range of $0.47-0.57
Sooner or later, the price will fall there again
_____________________
Did you like our analysis? Leave a comment, like, and follow to get more

CELO Potential Playout !CELO / USDT
This coin is providing a strong price action recently
What i see in chart is clear Adam & Eve potential formation .. the first strong target is neckline of this pattern which also is representing a strong weekly resistance
And if breakout happens there …more potential targets could be targeted

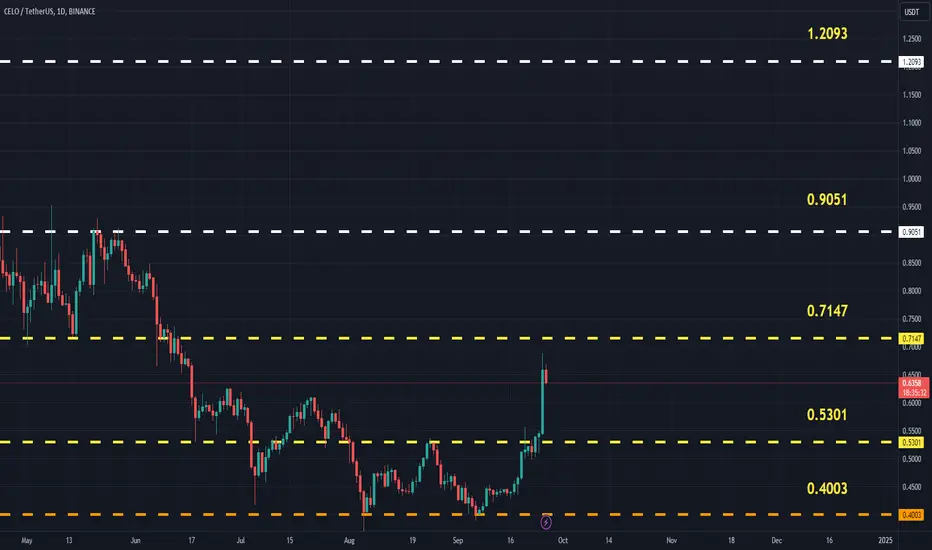
CELOUSDT (CELO) Updated till 26-09-24CELOUSDT (CELO) Daily timeframe range. it actually got a way lot space to cover. so steady retail interest into it can take the price far. close to 0.7147 a little bit volume can help it more. recent support at 0.5301.
CELO Daily Time FrameCELO is currently in a bearish trend and has been moving within a descending channel for approximately 141 days. The chart clearly shows the price making lower highs and lower lows, respecting the boundaries of this channel.
At the moment, the price is positioned near a critical juncture where it could potentially break out of this descending channel, signaling a reversal. For a bullish move to occur, CELO must break above the channel’s upper boundary. This resistance has acted as a barrier to the price, preventing any significant upward movement.
On the other hand, if the price fails to break this resistance and continues downward, it is likely to test the lower support of the descending channel.
Traders should monitor the price action closely, especially looking for a breakout above the descending channel, which would be a strong indicator of a potential bullish reversal. An increase in trading volume would provide further confirmation of this move.
Everything is on the chart.

CELOUSDT 1WCELO ~ 1W
#CELO We found a lot of #Altcoins hitting their bottom prices. one of which is NASDAQ:COIN #CELOUSD.
If you have Conviction on this Coin, Buying on this block will have very good risks and profits. At least short term profit of 20%+. Use a tight SL when this support block is successfully broken.

#CELO/USDT#CELO
The price is moving within a bearish channel pattern on a 12-hour frame and broke it upward after adhering to it significantly.
We have a downtrend on the RSI indicator, and it has been broken to the upside, and we have a trend to hold above
We have a major support level in green at .480
We have a trend of domes above the Moving Average 100
Entry price is 0.520
The first target is 0.680
The second goal is 0.780
The third goal is 0.940

#CELO Technical Analysis in 3-Day TimeframeHello everyone, I’m Cryptorphic.
For the past seven years, I’ve been sharing insightful charts and analysis.
Follow me for:
~ Unbiased analyses on trending altcoins.
~ Identifying altcoins with 10x-50x potential.
~ Futures trade setups.
~ Daily updates on Bitcoin and Ethereum.
~ High time frame (HTF) market bottom and top calls.
~ Short-term market movements.
~ Charts supported by critical fundamentals.
Now, let’s dive into this chart analysis:
CELO is in a downtrend and is currently holding the support level at 0.4674. The rebound shows a positive move for CELO, but to confirm the bullish trend, CELO must break out and close above the 50 EMA in the 3-day timeframe.
Key Observations:
- Primary Support: $0.4674.
- Lower Support: $0.3480.
- Primary Resistance: $0.730.
- Initial Target: $2.302.
DYOR, NFA.
Please hit the like button to support my content and share your thoughts in the comment section. Feel free to request any chart analysis you’d like to see!
Thank you!
#PEACE

Moving towards the triangle's breakout pointThe price of CELO is in a significant range and experiencing fluctuations after a recent drop. Within this triangle pattern, the price is oscillating between support and resistance levels. A key support zone has been identified, which could provide strong support and trigger positive reactions. A potential scenario involves breaking through the support zone and moving towards the triangle's breakout point.

CELO is currently oscillating below the key resistanceIn the four-hour chart, CELO is currently oscillating below the key resistance level at $0.9262. If this resistance level is broken, there is potential for an upward move towards the target of $1.0250, indicating a significant growth potential. However, if the price breaks below the ascending black trend line, it may enter a corrective phase.

CELOUSDT.1DThe daily chart for Celo (CELO/USDT) displays a price structure that is forming a descending triangle pattern, which is often interpreted as bearish. The price is consolidating, with resistance (R1) at $1.1449 and a flat support level (S1) that seems to have been tested multiple times.
The price at the moment of the chart was $0.8488, and if the price breaks below the support level, it could signal further downward momentum. The resistance line, currently at $1.1449, is the level to watch for a potential bullish reversal if the price were to break through.
The RSI is leaning towards the lower half at 43.25, suggesting that there might be more room for downward movement. The ADL line is relatively flat, suggesting that there is not a clear trend in terms of accumulation or distribution.
Traders might look for a break below S1 as a confirmation of the continuation of the bearish trend, possibly with a target set near the previous lows or lower. If the price breaks above the resistance line, it could invalidate the bearish pattern and suggest a potential change in trend, where R2 would be the next target. As with any pattern, confirmation with increased volume on the breakout would provide additional

Celo (cgldusd) Weekly chart indicates the double bottom breakout. . .has been validated. Now jsut waiting for price action to head to the full double bottom breakout target. In the current price zone, a mild correction before reaching the full target wouldn’t surprise me. In doing so it would help it create an inverse head and shoulders for its follow up bull pattern. Also a chance it just skips the correction and heads straight to the full target first. Either way I expect the target to be hit. *not financial advice*

#CELO/USDT#CELO
The price is moving in a bearish channel pattern on a 12-hour frame, which it adheres to perfectly.
We have stability above the moving average of 100.
We have an uptrend on the RSI indicator that supports the rise and is about to break higher
Entry price is 1.07
The first goal is 1.23
The second goal is 1.39
the third goal is 1.56
