AL JOUF CEMENT – BUY PLAN (TADAWUL: 3091)📈 AL JOUF CEMENT – BUY PLAN (TADAWUL: 3091)
✅ Current Status:
Price: 7.09 SAR
Action: Initial entry taken — some shares added to My portfolio.
🔍 Technical Overview:
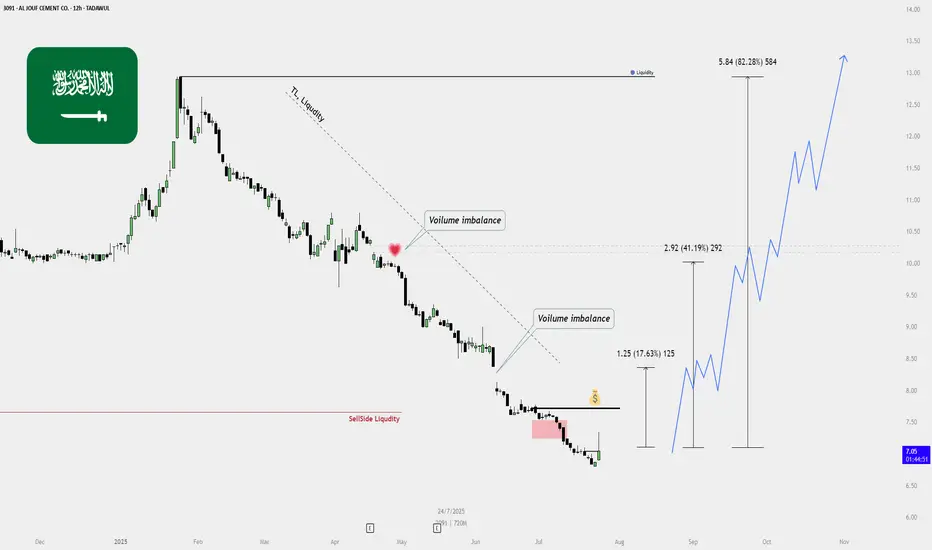
Sell-side Liquidity Cleared:
Previous lows taken out, triggering liquidity sweep.
Strong reversal suggests potential shift in market sentiment.
Volume Imbalances (Voids):
Bullish targets marked based on unfilled volume gaps:
📍 Target 1: 8.34 SAR (➕17.63%)
📍 Target 2: 10.01 SAR (➕41.19%)
📍 Target 3: 12.93 SAR (➕82.28%)
Trendline Liquidity Above:
Long-term descending trendline can act as a magnet for price, drawing it upward.
Bullish Confirmation:
Price has reacted from a bearish fair value gap.
Clean bullish engulfing and strong volume — suggests start of reversal.
🎯 Buy Strategy Breakdown:
Step Action
✅ Partial buy/entry completed (accumulation started)
📉 Wait for small pullback or bullish continuation to add more
🛡️ Stop Loss: Below recent swing low (around 6.50 SAR)
🚀 Targets: TP1 – 8.34, TP2 – 10.01, TP3 – 12.93
🔁 Re-evaluate plan if price closes below 6.70 with volume
Cement
ACC BULL waves started BIG Giant Ready to Roll !!!ACC daily counts suggested DUAL match for Eillot waves + Harmonics bullish Wave structure
both looks bullish implus started for this stock
LONG TERM investors get ready for good returns in future for 2 to 5 yrs
all charts shown to understand elliot waves theory + harmonics waves + gann theory + time theory
all charts are education purpose!!!!!
we don't any responsibilities for profit /loss

#ACPL is above green sky (strong bullish zone)#Acpl is now above green sky (Strong bullish zone). It is expected to cross 280 and 320 level.
Note: This is not a buy or sell call, trade at your own will. Use stop loss as per your strategy.

Power cement may double its valuePower cement may cross 20 and 25 level. Currently on 12. Note: this is not a buy sell call. Trade at your own will and use stop loss.

Flying cement is still in bullish zone Flying cement is still in bullish zone and may cross level of 29 again. This is not a buy sell call. Use stop loss too.

Play on LevelsImmediate Important Support lies around 125 - 128.
However, 135 - 145 is a Very Strong Resistance.
So Fresh Position is recommended either once
this level is crossed or at a Proper Support around 123-128
& then around 112 - 115
If it breaks 118, we may see more Selling pressure.

TADAWUL: 3050 (Southern Province Cement Co.)📈 TADAWUL: 3050 (Southern Province Cement Co.)
The stock has entered a long-term demand zone near 30.70–32.00, showing historical support. If this zone holds, a potential bullish reversal could take price first toward the 36.90 resistance, then to 44.00, with a final target around 46.35.
Trade Idea:
Entry: 32.00–33.00 (inside demand zone)
TP1: 36.90
TP2: 44.00
TP3: 46.35
SL: Below 29
Bias: Bullish (as long as price holds above 30.70)
Narrative: Accumulation in demand zone with a possible shift in trend.

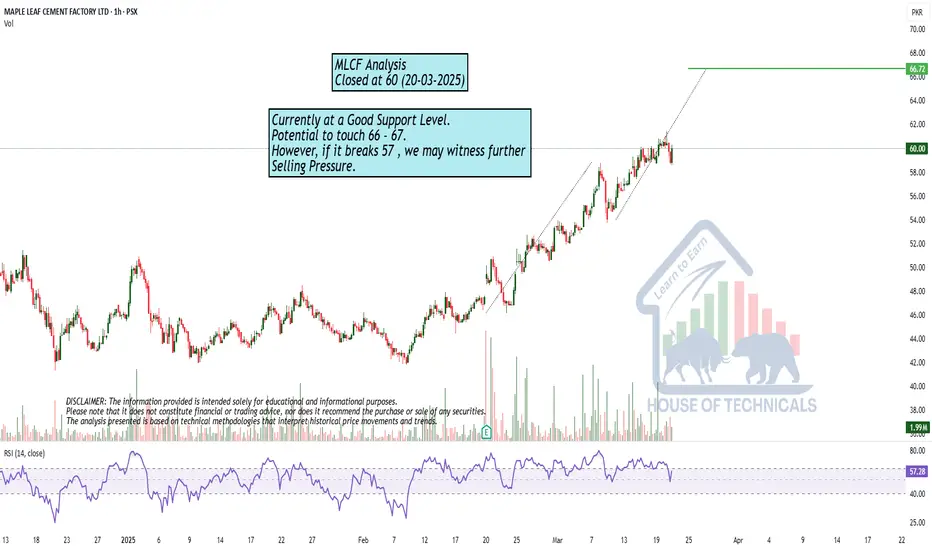
at Important Support LevelCurrently at a Good Support Level.
Potential to touch 66 - 67.
However, if it breaks 57 , we may witness further
Selling Pressure.
Still Bullish on Bigger Time Frames.Still Bullish on Bigger Time Frames.
Hidden Bullish Divergence has appeared.
Immediate Resistance lies around 186 - 189
Crossing this Level with Good volumes may
expose 197 - 200
Fresh Entry should be Triggered if 205 is Crossed
& Sustained; only then it may resume its Uptrend.

THCCL- PSX - Technical AnalysisTHCCL price has made a wedge which is an indication of price going up any time. RSI has already bounced from 30 and moving upwards. Klinger is just hinting at likely beginning of the bull run for this SCRIPT.
Fundamentally, from cement sector, this will show progress as sales will be substantial during post Ramadan and pre-monsoon (April ~July). Coupled with company has already shifted its power requirements to solar energy, therefore manufacturing cost cutting is eminent.
This SCRIPT can be kept in portfolio for investment point of view as well since prices are already very discounted.
Trade Values:
Buy-1 :189.58
Buy-2: 167.08
TP-1: 233.36
TP-2: 255.66
TP-3: 305.41 (For SWING TRADE 6 months Plus)
TP-4: 336.62 (For SWING TRADE 6 months Plus)
SL: 159.88

Still Bullish on Bigger Time Frames.Still Bullish on Bigger Time Frames.
Hidden Bullish Divergence has appeared.
Immediate Resistance lies around 186 - 189
Crossing this Level with Good volumes may
expose 197 - 200
Fresh Entry should be Triggered if 205 is Crossed
& Sustained; only then it may resume its Uptrend.

UPDATE PPC hit target up and now we have a down target to 3.60The PPC target worked well hitting R4.75 despite it taking some time.
But then, it was top heavy turned around and crashed like no tomorrow.
DUring the crash it formed a Rev Inv Cup and Handle and broke below the rim.
So here's the update with a new target.
Price<20 but >200
Rev Inv Cup and Handle
Target R3.65

Titan Cement: Impressive its progress in 2024Titan Cement (TITC) Group, the Titan of the Athens Stock Exchange, which was the first stock I bought as an investor in 1987, ended 2024 with a shower of new historical highs in its share value.
The group posted record sales in the nine-month period at 1.984 billion euros, up by +4.9% compared to the corresponding period last year. At the same time, it posted a strong increase of +14.6% in EBITDA profits, closing at 454.5 million euros, from 396.7 million euros in the nine-month period last year, while it also had a significant increase of +20.3%, to 237.8 million euros, from 197.6 million euros, in net profitability.
In 2025, we will also have the listing of Titan America on the New York Stock Exchange, thus giving significant goodwill to the group, while the raising of several hundred million dollars will further lower the already “wonderful” net debt / EBITDA ratio, which at the end of last September was at 1.10x.
From a diagrammatic point of view, the stock is moving within the strongly upward “S” channel governed by the two pivots of 2019. Here it is clearly visible that the stock has now taken an upward slope towards 44 euros, with a possible development of breaking the four-year channel with a move towards 48 to 50 euros.

Beginning of a DUOPOLY - Great OpportunityUltratech cement has approved an acquisition of 8.69% stake in Star cement for Rs 851 crore. As mentioned earlier in my post of August 26 that their is a possible chance of creation of duopoly in the cement sector after Adani's entrance in the sector it has been adamant after looking to the aggressive acquisitions made by Ultratech and Adani group. Till now Ultratech cement has taken stakes in Kesoram industries, India cements and Star cement while Adani Group has taken stakes in Ambuja, ACC, Sanghi Industries, Penna Cement and Orient Cement. As we know that Greenfield projects are limited due to limited natural resources, production capacity can only be increased and dominance can be maintained by acquiring small companies. Because of this tug of war share prices of small companies have surged significantly. Star cement has given a return of 40% in 2024. It's present capacity is 7.7 MTPA and plans to increase the capacity to 25 MTPA by 2030. Cement sector is going to be exciting in the coming years. Do keep a track and be updated about the sector.

ACC Ltd (NSE: ACC) Weekly Chart Analysis🔹 Channel Support and Resistance
The stock has been moving within an ascending channel since early 2022, creating a structured uptrend. Currently, it’s trading near the channel’s lower boundary, around ₹2,357. This zone has historically acted as a key support level, making it an area to watch closely for potential buying interest.
🔹 Descending Wedge Breakout
Recently, ACC broke out of a descending wedge pattern, a generally bullish formation, which suggests the potential for an upward move. The breakout is still in its early stages, so continued momentum will be critical in confirming the trend reversal.
🔹 Price Targets
First Resistance: ₹2,592.75 – If momentum sustains, this level aligns with a prior high and could act as a short-term target.
Channel Resistance: If the stock gains further strength, the upper boundary of the channel could offer the next significant resistance level.
🔹 Cement Industry Tailwinds
According to brokerages, Indian cement firms, including ACC, have seen successful price hikes in September, and there are plans for further hikes in October. This is generally positive for margins, adding fundamental support to the current technical picture.
🔹 RSI
The Relative Strength Index (RSI) shows an oversold condition that’s starting to turn upwards, suggesting possible accumulation at these levels.
📈 Conclusion: Watch for sustained support around ₹2,357 and an upward move towards ₹2,592. A close above ₹2,592 could indicate renewed bullish strength, especially with ongoing industry tailwinds from price hikes.

Power cement is flying to 11.5 level after flying over 8 levelPower cement monthly chart is showing these 2 important levels, It can go to 11.5 after crossing level of 8

Flying cement is crossing 8 level, Going to 11Flying cement is crossing 8 level mar and its next level will be near 12

PPC Limited 3 breakout patterns upside to R4.75W Formation has formed after 2 more breakout patterns before.
They are looking great for upside and the high probability trade is set with Price above both 20 and 200.
First target set at R4.75

Ramco Cement Ramco cement may have formed a LD pattern on Ew basis & may have completed the correction.. The new run could be fast & we can expect 1100-1500 levels in the next 4-6 months..
Stop loss 780

Cement sector- A duopoly?After Adani group bought ACC and Ambuja cements and became an impact player in cement sector of the country there is a chance of duopoly creation in the cement sector as was seen in the case of telecom sector when Jio entered the segment. Although such extreme duopoly will not be created in cement sector as the other regional cement will continue to operate. There is a chance that the plants of regional companies can also be bought as Ambuja and ACC were bought. So both Ultratech and Adani group cement companies should be looked upon and should be added to our personal portfolio keeping in mind the long term vision of the country. Please do your analysis and share your views in the comment section below.
Hope you like my idea.

Another 2 major BUY signals for PPC Limited to R4.75It's always great when you don't only get one Bullish breakout signal, but two more!
Another W Formation has formed along with a strong uptrend driving the price up.
So with this accompanied with Price>20 and Price>200 - make sit a HIGH probability analysis.
The first target remains at R4.60 and the second target at R4.75.
BULLISH

PPC target has been extended to R4.60W Formation formed on PPC.
The price broke out of the downtrend since January 2024.
and we have further confirmation with price above both 20 and 200MA.
The target has therefore been increased to R4.60.
With the new building of the malls in South AFrica and the property boom, I don't blame a company like PPC to have invested interest from the shareholders.

UPDATE: PPC shifted the analysis to upside target at R4.26W Formation formed on PPC and there has been a breakout of the downside since December.
The M Formation that formed I expected to breakdown never confirmed and so, the analysis has switched.l
It's not easy making analysis probabilities with low liquid penny stocks like PPC.
Funny I never thought PPC and Penny Stock would be in the same sentence but here we are and it shows how unpredictable markets are.
Price>20 and Price>200 - HPT
Target R4.26
