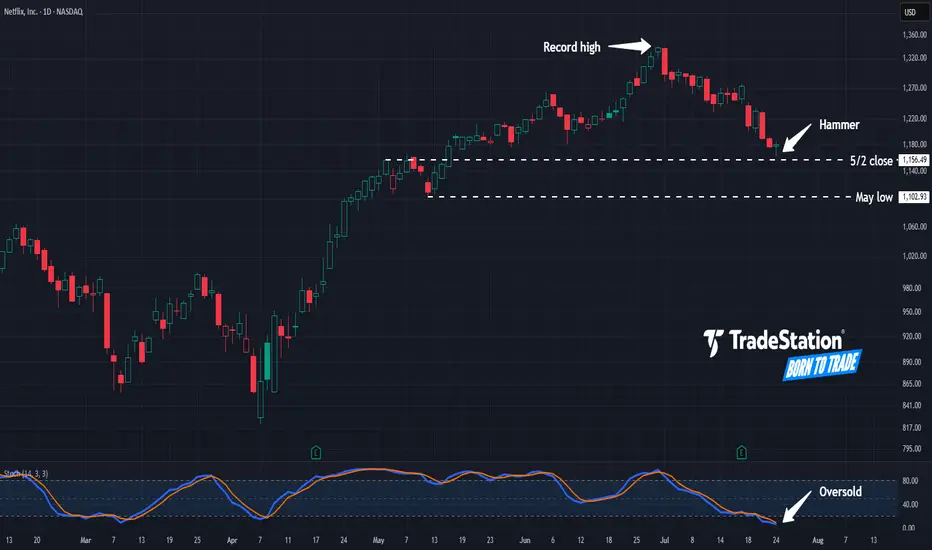
Hammer in NetflixNetflix has pulled back from record highs, and some traders may see potential opportunities in the streaming video giant.
The first pattern on today’s chart is the $1,156.49 level. It was a weekly close on May 2 and near the high the following week. NFLX is now showing signs of potential stabilization near that level. Is new support emerging?
Second, prices hit their lowest level in more than two months yesterday but rebounded. The resulting hammer candlestick pattern may be viewed as a bullish reversal pattern.
Third, stochastics have fallen to oversold territory.
Fourth, if the potential support at $1,156.49 breaks, traders may next eye the May low of $1,102.93.
TradeStation has, for decades, advanced the trading industry, providing access to stocks, options and futures. If you're born to trade, we could be for you. See our Overview for more.
Past performance, whether actual or indicated by historical tests of strategies, is no guarantee of future performance or success. There is a possibility that you may sustain a loss equal to or greater than your entire investment regardless of which asset class you trade (equities, options or futures); therefore, you should not invest or risk money that you cannot afford to lose. Online trading is not suitable for all investors. View the document titled Characteristics and Risks of Standardized Options at www.TradeStation.com . Before trading any asset class, customers must read the relevant risk disclosure statements on www.TradeStation.com . System access and trade placement and execution may be delayed or fail due to market volatility and volume, quote delays, system and software errors, Internet traffic, outages and other factors.
Securities and futures trading is offered to self-directed customers by TradeStation Securities, Inc., a broker-dealer registered with the Securities and Exchange Commission and a futures commission merchant licensed with the Commodity Futures Trading Commission). TradeStation Securities is a member of the Financial Industry Regulatory Authority, the National Futures Association, and a number of exchanges.
Options trading is not suitable for all investors. Your TradeStation Securities’ account application to trade options will be considered and approved or disapproved based on all relevant factors, including your trading experience. See www.TradeStation.com . Visit www.TradeStation.com for full details on the costs and fees associated with options.
Margin trading involves risks, and it is important that you fully understand those risks before trading on margin. The Margin Disclosure Statement outlines many of those risks, including that you can lose more funds than you deposit in your margin account; your brokerage firm can force the sale of securities in your account; your brokerage firm can sell your securities without contacting you; and you are not entitled to an extension of time on a margin call. Review the Margin Disclosure Statement at www.TradeStation.com .
TradeStation Securities, Inc. and TradeStation Technologies, Inc. are each wholly owned subsidiaries of TradeStation Group, Inc., both operating, and providing products and services, under the TradeStation brand and trademark. When applying for, or purchasing, accounts, subscriptions, products and services, it is important that you know which company you will be dealing with. Visit www.TradeStation.com for further important information explaining what this means.
Centered Oscillators
Can ChatGPT Predict Bitcoin’s Next Move? BITDPS’s AdvantageIn a digital world increasingly shaped by AI, the question arises: Can ChatGPT predict Bitcoin’s next move? Traders and investors alike are turning to AI-powered tools in search of an edge in the notoriously volatile crypto market. While ChatGPT and similar language models can offer valuable insights, the answer lies not in prediction, but in interpretation — and that’s where expert systems like BITDPS make the difference.
What Can ChatGPT Actually Do?
ChatGPT is a powerful language model capable of processing large volumes of historical data, technical indicators, and news sentiment. It can:
Analyze chart patterns and market signals
Interpret macroeconomic events and crypto news
Explain the logic behind price movements
Simulate different market scenarios
However, ChatGPT cannot "see the future." It does not have real-time data feeds or live market access. Its strength lies in context-based analysis and scenario building — tools that help human or automated decision-makers make more informed choices.
Why Bitcoin Prediction Is So Complex
Bitcoin’s price is influenced by a wide array of factors:
Global macroeconomic conditions (interest rates, inflation, dollar strength)
Crypto-specific events (ETF approvals, exchange hacks, regulatory crackdowns)
Investor sentiment and technical setups
Whale behavior and on-chain movements
This complexity means that no single model — not even ChatGPT — can consistently predict exact price points or timing. But combining ChatGPT’s pattern recognition with quantitative strategies, like those used by BITDPS, creates a powerful hybrid approach.
How BITDPS Profits in This Environment
At BITDPS, we don’t rely on “crystal ball” predictions. Instead, we use AI—including models like ChatGPT—for market interpretation, paired with our proprietary:
Quantitative trading algorithms
High-frequency execution models
Sentiment-driven strategy modules
These systems allow us to react in milliseconds to changes in volatility, liquidity, and trend direction. ChatGPT may offer insight, but BITDPS executes — fast, efficiently, and profitably.
Whether Bitcoin goes up or down, our AI-enhanced infrastructure identifies and acts on profitable opportunities, including arbitrage, momentum trades, and volatility spreads.
The Bottom Line
ChatGPT can’t predict the future — but it can help understand it. At BITDPS, we leverage that understanding, combine it with live data and automation, and turn it into profit. For traders and institutional clients looking to bridge AI insights with real market action, BITDPS delivers where theory meets execution.

Bitcoin Slips Under 200-Day Moving Average – Will the Downtrend Bitcoin (BTC), the largest cryptocurrency by market capitalization, recently slipped below its 200-day simple moving average (SMA)—a key technical indicator widely used by traders to assess long-term market trends. This breakdown has raised concerns among investors that the current correction could turn into a more sustained downtrend.
What Does the Break Below the 200-Day SMA Mean?
The 200-day SMA is traditionally viewed as the dividing line between bullish and bearish market phases. When BTC trades above this level, it signals strength and long-term bullish momentum. However, a drop below it is often seen as a warning sign that sentiment is shifting and sellers are gaining control.
As of writing, BTC is trading around $57,000, below the 200-day SMA, which stands near $58,400. Trading volumes have decreased, while technical indicators like the RSI and MACD are pointing to weakening momentum.
Reasons Behind the Decline
Several factors are contributing to BTC’s current downward movement:
Increased regulatory pressure – Recent actions by the SEC and other regulatory bodies targeting exchanges and token classifications have spooked markets.
Macroeconomic uncertainty – Market expectations of more hawkish monetary policy by the U.S. Federal Reserve, including possible interest rate hikes, have added to investor anxiety.
Decreased institutional interest, as capital flows shift back toward traditional assets like gold and bonds.
Profit-taking by large holders (whales), especially after the strong performance during the spring rally.
Will the Downtrend Continue?
From a technical perspective, the next key support zone lies around $54,000–$55,000. A breakdown below this area could open the door to $50,000 and possibly lower levels. On the flip side, if BTC quickly recovers and closes above the 200-day SMA, the move could turn out to be a false breakdown, preserving the broader uptrend.
Traders should watch for:
Volume on rebounds: A bounce accompanied by rising volume could signal renewed buyer interest.
Altcoin behavior: In periods of uncertainty, capital tends to flow out of altcoins and into BTC or stablecoins.
Fundamental catalysts, such as ETF approvals or major institutional investments, which could quickly shift sentiment.
Conclusion
The drop below the 200-day SMA is a bearish technical signal and could mark the beginning of a medium-term downtrend. However, given the volatility of the crypto market, a swift recovery is always possible. Investors should remain cautious, closely monitor key levels, and keep an eye on both macro and on-chain developments.

Hyperliquid AI Trading Launches to Revolutionize Crypto in 2025The launch of Hyperliquid AI Trading marks a major milestone in the evolution of digital markets. Positioned as an AI-native, fully on-chain trading platform, Hyperliquid is designed to offer high-speed, adaptive, and transparent execution — directly competing with centralized exchanges in efficiency and intelligence.
Within its first week, Hyperliquid processed over $3.7 billion in trading volume, highlighting early market interest. It leverages a proprietary AI engine that integrates real-time sentiment analysis, macroeconomic signals, and on-chain data to continuously optimize trading decisions.
“Hyperliquid arrives at the intersection of AI maturity and DeFi demand,”
says Lina Torres, Senior Analyst at Valtrix Group.
Key Features
AI-Driven Order Execution: Predicts slippage and market impact to route trades efficiently.
Sentiment-Aware Strategy Engine: Adjusts trading logic based on financial news and social signals.
Fully On-Chain Infrastructure: Offers transparency and verifiability for institutional-grade trust.
Self-Learning Models: Improves performance through continuous feedback.
Strategic Context
2025 has seen accelerating DEX adoption and a surge in institutional interest in DeFi. With the rise of spot crypto ETFs and maturing regulations, the market is ready for intelligent, decentralized infrastructure.
Valtrix Group forecasts that platforms like Hyperliquid could capture 8–12% of total DEX volume by Q4 2025, driven by algorithmic and high-frequency trading firms seeking smarter execution layers.
“This is not just faster DeFi — it’s smarter DeFi,”
notes Mark Evans, Chief Strategist, Valtrix Group.
Conclusion
Hyperliquid AI Trading signals a new era in crypto: one where artificial intelligence is fully embedded into decentralized finance. Its launch may set a precedent for the next generation of algorithmic trading infrastructure — agile, data-driven, and fully transparent.

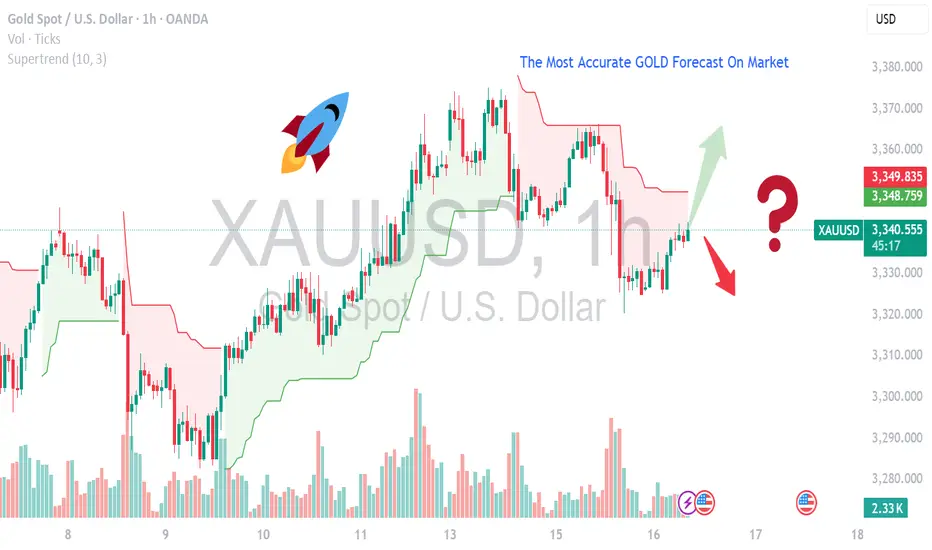
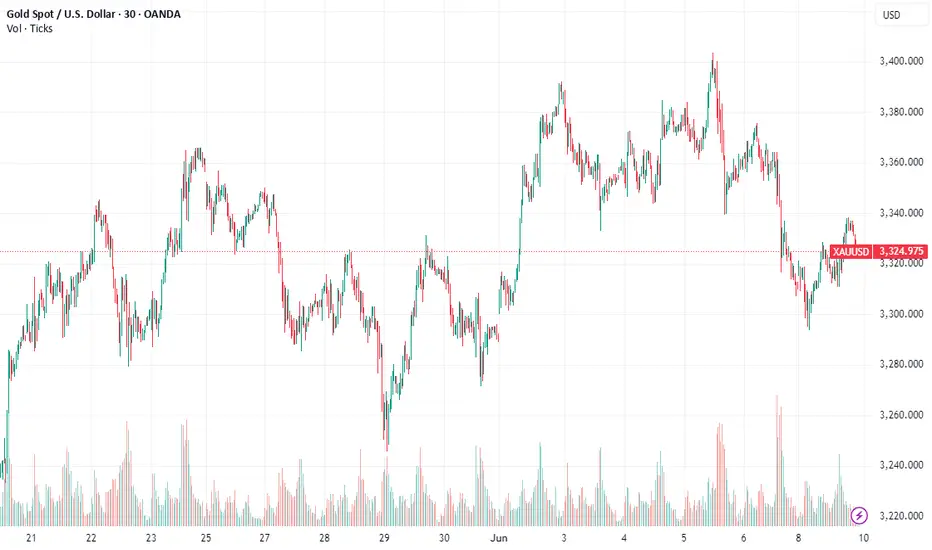
MOST ACCURATE XAUUSD GOLD FORECAST ANALYSIS MARKETCurrent Setup & Technical Outlook
Consolidation & Pennant Formation: Gold is building a bullish pennant and trading above its 50‑day MA — a classic continuation pattern suggesting a breakout toward new highs if momentum resumes .
Key Levels:
Support: $3,330–3,340 — confirmed by multiple technical sources .
Resistance/Breakout Zone: $3,360–3,375 — clearing this could trigger a rally toward $3,400+ .
Upside Targets: $3,390, then possibly $3,500–$3,535 per weekly forecast .
Alternate Bearish Scenario: A failure around the 0.618 Fibonacci resistance (~$3,374) and overbought RSI could spark a pullback to $3,356 or lower .
---
🧠 Fundamental Drivers
Inflation & U.S. Macro Data: Market awaits June CPI/PPI and Fed commentary — cooler inflation could boost gold via dovish expectations, while hotter data may strengthen the USD and weigh on bullion .
Geopolitical & Safe-Haven Demand: Trade tensions (e.g., tariffs) are keeping gold elevated near $3,350–$3,360 .
Central Bank & Real Yields Watch: Continued gold purchases and lower real rates are supportive, although mid-term easing in risks (like global trade) could curb momentum .
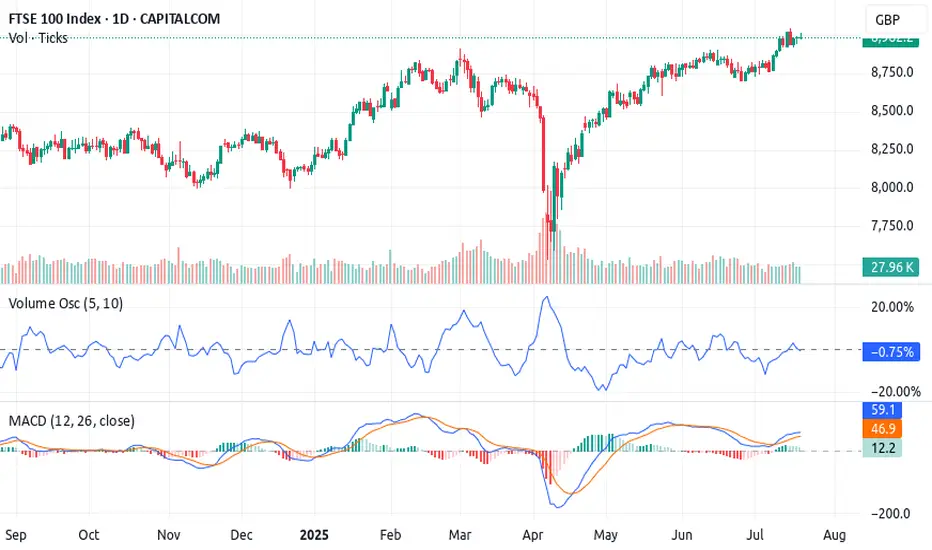
The 3-Step Rocket Booster Strategy – UK100 Bullish Breakout 🚀 The 3-Step Rocket Booster Strategy – UK100 Bullish Breakout Brewing
The UK100 Index is currently aligning perfectly with a high-probability setup I call the 3-Step Rocket Booster Strategy
— a momentum-based play designed to catch strong breakouts before the crowd reacts.
---
🔍 Strategy Breakdown:
✅ Step 1: Price above the 50 EMA
This signals short-term bullish momentum. The UK100 has cleared the 50 EMA decisively, with candles holding strong above it — suggesting buyers are stepping in aggressively.
✅ Step 2: Price above the 200 EMA
Now we’ve got long-term trend confirmation. The index is trending above the 200 EMA, meaning bulls have full control of the higher timeframe direction.
⚠️ Step 3: The Gap-Up with Volume Confirmation
Here’s the key — the "booster". We’re watching for a gap-up move , validated by a Volume Oscillator breakout . While
price has already lifted, the volume hasn’t exploded just yet — this is the final ignition phase before liftoff.
---
📈 Technical Indicators:
MACD: Bullish crossover active — momentum building
Volume Oscillator: Starting to curve upward, hinting at upcoming volume expansion
EMAs: 50 EMA > 200 EMA = confirmed bullish structure
Support Zones : Holding cleanly above recent resistance-turned-support, adding confluence
---
🟢 Trade Insight:
We are now sitting in the perfect entry zone — price is in the pocket before volume confirms . Once volume breaks out, we could see a parabolic move , especially if global market sentiment remains stable.
🎯 Potential Targets :
First target: Recent high (psychological + structural level)
Second target: Measured move based on gap range extension
Risk: A close below the 50 EMA invalidates the setup
---
🔁 Summary:
This setup ticks all three boxes of the 3-Step Rocket Booster Strategy .
The smart money is positioning before the volume shows up. The UK100 is a strong bullish candidate with low-risk entry and high reward potential — don’t ignore this one .
---
📌 Disclaimer: Always use proper risk management. Trade the setup, not the emotion.Use a simulation trading account before you trade with real money
Let me know if you’re tracking this setup too 👇
Zscaler May Be OversoldZscaler recently climbed to a three-year high, and now it’s pulled back.
The first pattern on today’s chart is the May 30 gap after earnings and revenue beat estimates. That may reflect positive fundamentals.
Second, the cybersecurity stock has retraced half the move following results. Stabilizing here may confirm direction is pointing higher.
Third, prices are trying to stabilize near the rising 50-day simple moving average.
Fourth, stochastics have dipped to an oversold condition.
TradeStation has, for decades, advanced the trading industry, providing access to stocks, options and futures. If you're born to trade, we could be for you. See our Overview for more.
Past performance, whether actual or indicated by historical tests of strategies, is no guarantee of future performance or success. There is a possibility that you may sustain a loss equal to or greater than your entire investment regardless of which asset class you trade (equities, options or futures); therefore, you should not invest or risk money that you cannot afford to lose. Online trading is not suitable for all investors. View the document titled Characteristics and Risks of Standardized Options at www.TradeStation.com . Before trading any asset class, customers must read the relevant risk disclosure statements on www.TradeStation.com . System access and trade placement and execution may be delayed or fail due to market volatility and volume, quote delays, system and software errors, Internet traffic, outages and other factors.
Securities and futures trading is offered to self-directed customers by TradeStation Securities, Inc., a broker-dealer registered with the Securities and Exchange Commission and a futures commission merchant licensed with the Commodity Futures Trading Commission). TradeStation Securities is a member of the Financial Industry Regulatory Authority, the National Futures Association, and a number of exchanges.
TradeStation Securities, Inc. and TradeStation Technologies, Inc. are each wholly owned subsidiaries of TradeStation Group, Inc., both operating, and providing products and services, under the TradeStation brand and trademark. When applying for, or purchasing, accounts, subscriptions, products and services, it is important that you know which company you will be dealing with. Visit www.TradeStation.com for further important information explaining what this means.

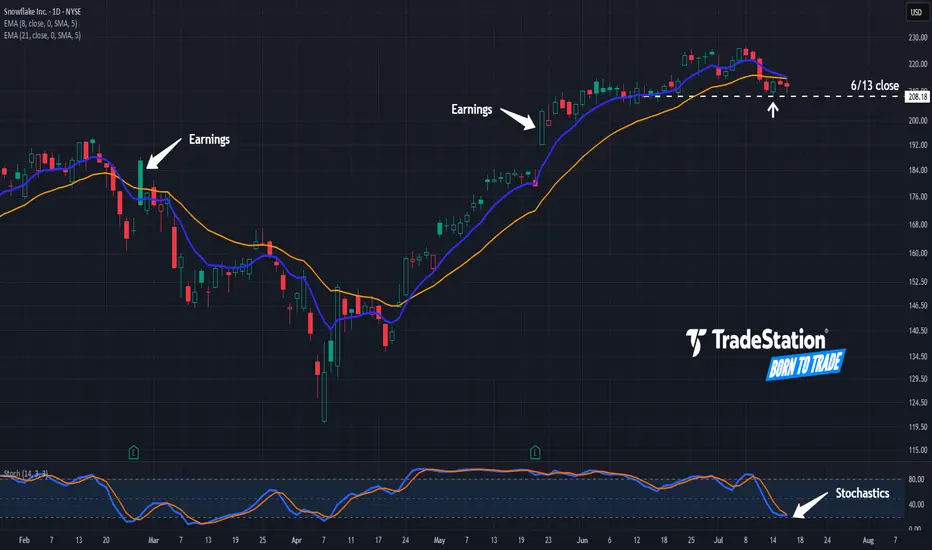
Snowflake Pulls BackSnowflake jumped to a new 52-week high last week, and now it’s pulled back.
The first pattern on today’s chart is the pair of price jumps after the last two quarterly reports. Those may reflect bullish sentiment in the software company.
Second is the June 13 weekly close of $208.18. SNOW appears to be stabilizing after revisiting that level, which may suggest support is in place.
Third, stochastics neared oversold territory and are now trying to turn higher.
TradeStation has, for decades, advanced the trading industry, providing access to stocks, options and futures. If you're born to trade, we could be for you. See our Overview for more.
Past performance, whether actual or indicated by historical tests of strategies, is no guarantee of future performance or success. There is a possibility that you may sustain a loss equal to or greater than your entire investment regardless of which asset class you trade (equities, options or futures); therefore, you should not invest or risk money that you cannot afford to lose. Online trading is not suitable for all investors. View the document titled Characteristics and Risks of Standardized Options at www.TradeStation.com . Before trading any asset class, customers must read the relevant risk disclosure statements on www.TradeStation.com . System access and trade placement and execution may be delayed or fail due to market volatility and volume, quote delays, system and software errors, Internet traffic, outages and other factors.
Securities and futures trading is offered to self-directed customers by TradeStation Securities, Inc., a broker-dealer registered with the Securities and Exchange Commission and a futures commission merchant licensed with the Commodity Futures Trading Commission). TradeStation Securities is a member of the Financial Industry Regulatory Authority, the National Futures Association, and a number of exchanges.
TradeStation Securities, Inc. and TradeStation Technologies, Inc. are each wholly owned subsidiaries of TradeStation Group, Inc., both operating, and providing products and services, under the TradeStation brand and trademark. When applying for, or purchasing, accounts, subscriptions, products and services, it is important that you know which company you will be dealing with. Visit www.TradeStation.com for further important information explaining what this means.
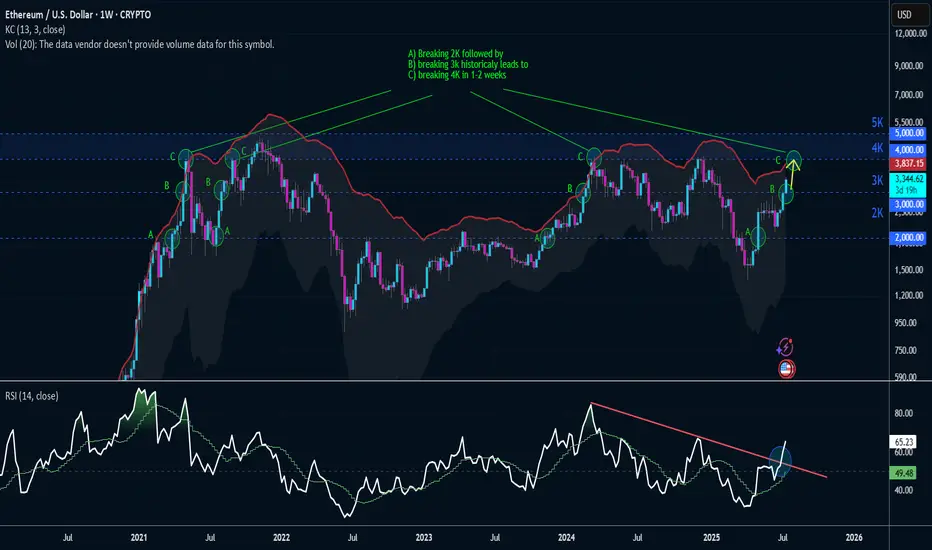
Next Stop -> 4K4 out of 4 historical times -> Ethereum has hit 4K in 1 to 2 weeks after breaking 2K and 3K sequentially.
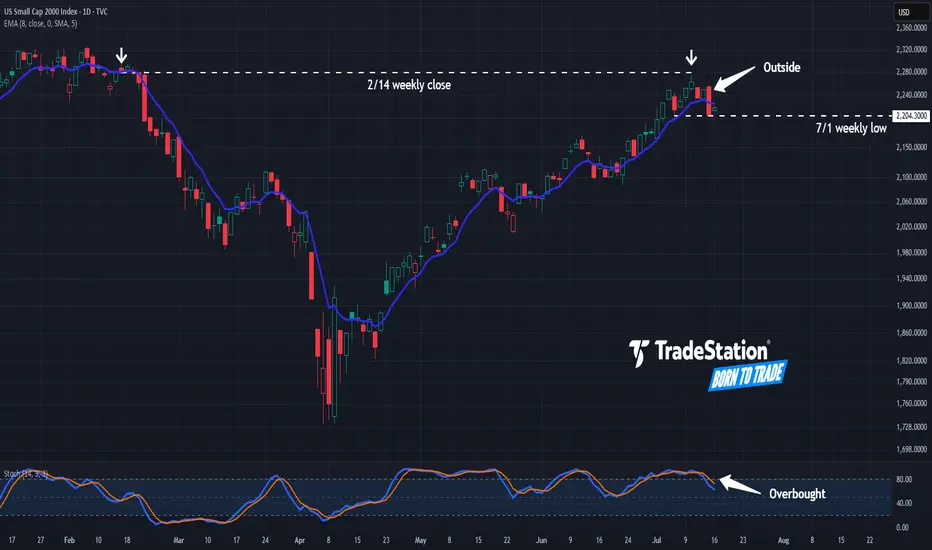
Have Small Caps Hit a Wall?The Russell 2000 has lagged the broader market for years, and now some traders may think it’s stalling again.
The first pattern on today’s chart is the February 14 weekly close of 2,280. The small cap index approached that level last Thursday but couldn’t hold. The resulting “shooting star” candlestick pattern, near a weekly level, may confirm that old resistance remains in place.
Second, RUT made a higher high yesterday and a lower low. That kind of bearish outside day is a potential reversal pattern.
Third, prices returned to a weekly low from July 1. Crossing below it could suggest support is breaking.
Fourth, stochastics are dipping from an overbought condition.
Finally, small caps are sensitive to borrowing costs. The 10-year Treasury yield has been making higher highs and higher lows on its weekly chart. Could further upside keep weighing on small caps?
TradeStation has, for decades, advanced the trading industry, providing access to stocks, options and futures. If you're born to trade, we could be for you. See our Overview for more.
Past performance, whether actual or indicated by historical tests of strategies, is no guarantee of future performance or success. There is a possibility that you may sustain a loss equal to or greater than your entire investment regardless of which asset class you trade (equities, options or futures); therefore, you should not invest or risk money that you cannot afford to lose. Online trading is not suitable for all investors. View the document titled Characteristics and Risks of Standardized Options at www.TradeStation.com . Before trading any asset class, customers must read the relevant risk disclosure statements on www.TradeStation.com . System access and trade placement and execution may be delayed or fail due to market volatility and volume, quote delays, system and software errors, Internet traffic, outages and other factors.
Securities and futures trading is offered to self-directed customers by TradeStation Securities, Inc., a broker-dealer registered with the Securities and Exchange Commission and a futures commission merchant licensed with the Commodity Futures Trading Commission). TradeStation Securities is a member of the Financial Industry Regulatory Authority, the National Futures Association, and a number of exchanges.
TradeStation Securities, Inc. and TradeStation Technologies, Inc. are each wholly owned subsidiaries of TradeStation Group, Inc., both operating, and providing products and services, under the TradeStation brand and trademark. When applying for, or purchasing, accounts, subscriptions, products and services, it is important that you know which company you will be dealing with. Visit www.TradeStation.com for further important information explaining what this means.
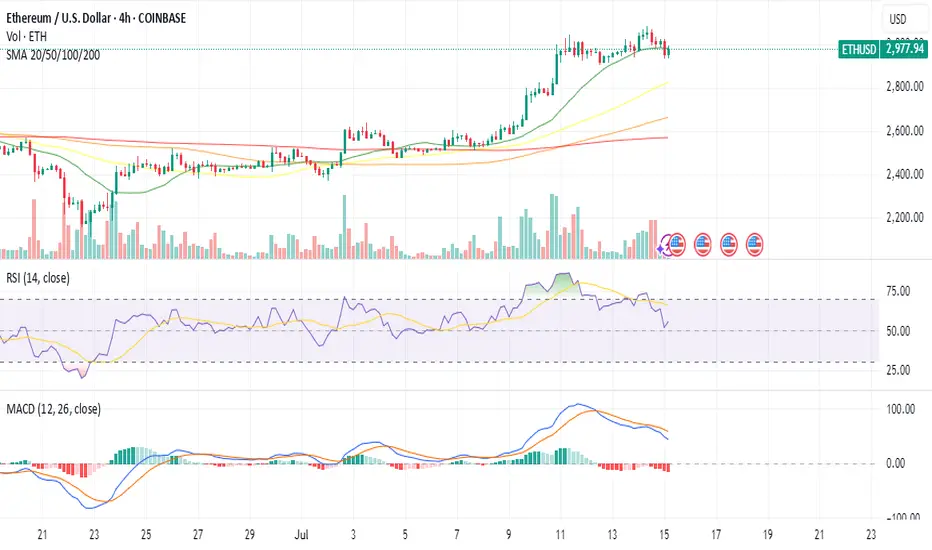
Ethereum Price Rejects $3K: Is A Deeper Correction Ahead?Ethereum's Precarious Perch: Price Stumbles at $3K as Long-Term Conviction and Quantum Threats Collide
The cryptocurrency community is intently watching Ethereum as the premier smart contract platform engages in a fierce battle around the psychologically crucial $3,000 mark. Following a promising surge that breached this barrier for the first time in several months, the upward momentum has stalled, giving way to a tense period of consolidation. This raises a pivotal question for investors and market observers alike: is a more significant correction on the horizon, or is this merely a strategic pause before the next major advance toward $3,200 and potentially higher valuations?
The recent price action has been a whirlwind for traders. Ethereum climbed with bullish determination, reaching heights near $3,080 before encountering substantial selling pressure that forced a retreat. This downturn has left the price hovering near the $2,940 level, trading precariously near its 100-hourly Simple Moving Average (SMA). Exacerbating the bearish sentiment, the price has broken below a key bullish trend line that had previously offered support at the $2,980 mark, a technical development that often signals the potential for further declines.
This short-term market turbulence, however, unfolds within a much broader and more intricate narrative. While hourly charts may be flashing warning signs, an analysis of long-term on-chain data reveals a story of strengthening fundamentals, underscored by a record amount of Ethereum being locked away by confident, long-term holders. In parallel, the Ethereum developer community, with co-founder Vitalik Buterin at the forefront, is proactively strategizing for a distant yet potentially existential threat: the "Quantum Apocalypse." This unique convergence of immediate bearish technical indicators, profound long-term bullish sentiment, and forward-thinking security planning creates a fascinating and unpredictable landscape for the pioneering blockchain platform.
The Short-Term Tug-of-War: A Correction Towards $2,900 or a Rally to $3,200?
In the immediate term, the market is a battlefield of competing forces. The inability to sustain a position above the $3,000 level has emboldened sellers, and key technical indicators are suggesting a cautious approach. The hourly MACD (Moving Average Convergence Divergence) is indicating a loss of momentum within the bullish zone, while the RSI (Relative Strength Index) has fallen below the 50 mark, suggesting that selling pressure could be gaining the upper hand.
Market analysts are now laser-focused on the $2,900 zone, viewing it as the primary line of defense for the bulls. If this support level can withstand the selling pressure, it could provide the necessary foundation for a fresh increase, enabling Ethereum to reclaim its lost ground and launch another attempt to conquer the $3,000 resistance. Conversely, a decisive break below this critical support could initiate a more substantial correction. In such a scenario, subsequent support targets would likely be found near $2,800, with the potential for further drops to the $2,720 or even $2,650 price points.
A particularly compelling theory circulating among analysts involves the concept of a "liquidity sweep." On-chain data indicates a significant concentration of liquidity—essentially, a large cluster of buy orders and stop-loss orders—residing just below the $2,900 level. Market dynamics frequently see price action gravitate toward these zones to trigger liquidations, effectively shaking out over-leveraged traders before a more sustained move in the opposite direction. Consequently, a brief dip below $2,900 to "grab" this liquidity would not be an unexpected development. Paradoxically, such a move could be the very catalyst required to fuel a durable rally toward the next major target: the $3,200 supply zone. This level is widely regarded as the next significant hurdle, a price ceiling where a large volume of sell orders is anticipated to be waiting.
The volatility surrounding key psychological levels like $3,000 is notoriously difficult to predict, as human emotions of fear and greed often drive exaggerated market reactions. For the time being, the short-term outlook remains uncertain, heavily contingent on whether the crucial $2,900 support can absorb the selling pressure or if a flush-out of liquidity is needed before the bulls can confidently reassert control.
The Bullish Undercurrent: Smart Money's Long Game and a Shrinking Supply
Looking beyond the volatile daily price charts reveals a powerful undercurrent of bullish conviction. A key metric that speaks volumes about long-term investor sentiment is the quantity of Ethereum locked in staking contracts, which has recently soared to a new all-time high.
Recent on-chain data indicates that nearly 30% of Ethereum's total supply is now staked on the network. As of mid-2025, more than 35 million ETH have been committed to validator nodes, a process that helps secure the network while allowing stakers to earn passive income. This trend, which has seen a notable acceleration in recent months, serves as a powerful indicator of long-term confidence. When investors, particularly large holders often referred to as "whales," stake their ETH, they are effectively removing it from the liquid, tradable supply. This reduction in available supply, frequently described as a "supply shock," means that any future increase in demand can have a more pronounced positive effect on the asset's price.
This staking activity is widely interpreted as "smart money" placing a long-term bet on Ethereum's continued growth and success. These are not day traders reacting to minor price swings but rather institutional investors and seasoned crypto participants who are focused on the bigger picture. Their actions signal a deep-seated belief that the intrinsic value of the Ethereum network—as the foundational layer for decentralized finance (DeFi), non-fungible tokens (NFTs), and a vast ecosystem of other applications—will continue to appreciate over time. This accumulation is not limited to staking; the number of wallets with no history of selling has also reached a record high, collectively holding over 22.8 million ETH.
This expanding pool of illiquid supply, driven by a firm belief in Ethereum's fundamental value proposition and its future roadmap, provides a strong counter-narrative to the short-term bearish technicals. It suggests that while the price may experience turbulence in the near term, a substantial and growing cohort of investors is prepared to hold through the volatility, thereby creating a solid foundation for future price appreciation.
The Existential Question: Can Ethereum Outsmart a Quantum Apocalypse?
While traders and short-term investors grapple with hourly charts and staking metrics, Ethereum's core developers are concentrating on a threat that is far more distant but infinitely more profound: the advent of quantum computing. The "Quantum Apocalypse" is a term used to describe the hypothetical future event—often called "Q-Day"—when a quantum computer becomes powerful enough to break the cryptographic algorithms that secure virtually all of our modern digital infrastructure. This includes blockchain networks like Ethereum and Bitcoin.
Such a powerful machine could, in theory, reverse-engineer a user's private key from their public key, which would grant an attacker complete and unfettered control over their digital assets. For a multi-billion dollar ecosystem built on the unwavering promise of cryptographic security, this represents an existential threat of the highest order.
However, the leadership within the Ethereum ecosystem, including co-founder Vitalik Buterin and the Ethereum Foundation, is not idly waiting for this threat to materialize. They are actively and transparently working to make the network quantum-resistant. Buterin has publicly addressed the issue, noting that prediction markets currently forecast the arrival of a cryptographically relevant quantum computer sometime between 2030 and 2035. This timeline provides a crucial window for the network to transition its security protocols to a more robust standard.
The strategy to neutralize this threat is multifaceted and is a core component of Ethereum's long-term development roadmap. Key initiatives include:
• Post-Quantum Cryptography: Researchers are diligently developing and testing new types of signature schemes that are designed to be resistant to attacks from both classical and quantum computers. Two of the most promising approaches are STARKs (Scalable Transparent Arguments of Knowledge) and lattice-based cryptography. STARKs, for instance, would allow users to prove ownership of their assets without ever exposing their private keys.
• The "Lean Ethereum" Roadmap: Buterin and fellow researcher Justin Drake have put forth a vision for a "Lean Ethereum" that aims to simplify the blockchain's base layer. This simplification would not only make the protocol easier to audit and secure but would also facilitate the integration of post-quantum-ready signatures and other advanced defensive measures.
• Emergency Hard Forks: In a worst-case scenario where a quantum threat emerges much sooner than anticipated, Buterin has suggested that an emergency hard fork could be deployed as a final line of defense. This would involve a network-wide upgrade where all users would be required to migrate their funds to new, quantum-resistant "smart" wallets, thereby rendering the old, vulnerable accounts obsolete.
Buterin remains cautiously optimistic about the network's ability to navigate this challenge. The proactive stance, the commitment to public and transparent research, and the multi-layered defense strategy all demonstrate a deep commitment to ensuring Ethereum's security for decades to come. This effort aims to transform a potential apocalypse into a manageable, albeit complex, technological evolution.
Conclusion: A Market at a Crossroads
Ethereum currently stands at a fascinating crossroads, a point where short-term technical uncertainty is juxtaposed with immense long-term fundamental strength and remarkable foresight. The immediate price action is a toss-up, delicately balanced on the crucial $2,900 support level. A sustained dip below this line could send prices into a corrective wave toward $2,800 or lower, possibly to sweep liquidity before a stronger and more convincing rebound. Conversely, if this support holds firm, it could empower the bulls to decisively conquer the $3,000 barrier and set their sights on the formidable $3,200 resistance zone.
When one zooms out from the daily noise, the picture becomes clearer and decidedly more bullish. The record-breaking amount of ETH locked in staking contracts paints a portrait of unwavering long-term conviction from sophisticated investors who are systematically reducing the available supply while simultaneously strengthening the network's security. This patient accumulation provides a powerful buffer against short-term market panic.
Looking even further into the future, Ethereum's leadership is already waging a quiet war against the quantum threat, meticulously laying the groundwork for a post-quantum world. This long-range planning, while not a direct factor in today's price movements, underpins the network's potential for longevity and resilience.
For the investor, the current dilemma—a rally to $3,200 or a pullback first?—is largely a matter of time horizon. The path of least resistance in the coming days and weeks remains ambiguous, clouded by liquidation levels and psychological barriers. But for those with a longer view, the on-chain data and the forward-thinking roadmap strongly suggest that Ethereum is not just building for the next bull run, but for the next generation of the internet. The current price turbulence, while unsettling, may ultimately be remembered as a minor tremor before a much more significant structural shift in value.
Monster Beverage: Breakout and PullbackMonster Beverage broke out to a new all-time high in May, and now it’s pulled back.
The first pattern on today’s chart is the March 2024 high of $61.23. The maker of energy drinks hesitated at that level in early May but pulled back to hold it last week. Has old resistance become new support?
Second, MNST is trying to stabilize at its rising 50-day simple moving average. That may reflect a bullish intermediate-term trend.
Third, the most recent dip pulled stochastics into oversold territory.
Finally, bullish price action after the last two earnings reports may reflect positive sentiment.
Check out TradingView's The Leap competition sponsored by TradeStation.
TradeStation has, for decades, advanced the trading industry, providing access to stocks, options and futures. If you're born to trade, we could be for you. See our Overview for more.
Past performance, whether actual or indicated by historical tests of strategies, is no guarantee of future performance or success. There is a possibility that you may sustain a loss equal to or greater than your entire investment regardless of which asset class you trade (equities, options or futures); therefore, you should not invest or risk money that you cannot afford to lose. Online trading is not suitable for all investors. View the document titled Characteristics and Risks of Standardized Options at www.TradeStation.com . Before trading any asset class, customers must read the relevant risk disclosure statements on www.TradeStation.com . System access and trade placement and execution may be delayed or fail due to market volatility and volume, quote delays, system and software errors, Internet traffic, outages and other factors.
Securities and futures trading is offered to self-directed customers by TradeStation Securities, Inc., a broker-dealer registered with the Securities and Exchange Commission and a futures commission merchant licensed with the Commodity Futures Trading Commission). TradeStation Securities is a member of the Financial Industry Regulatory Authority, the National Futures Association, and a number of exchanges.
TradeStation Securities, Inc. and TradeStation Technologies, Inc. are each wholly owned subsidiaries of TradeStation Group, Inc., both operating, and providing products and services, under the TradeStation brand and trademark. When applying for, or purchasing, accounts, subscriptions, products and services, it is important that you know which company you will be dealing with. Visit www.TradeStation.com for further important information explaining what this means.

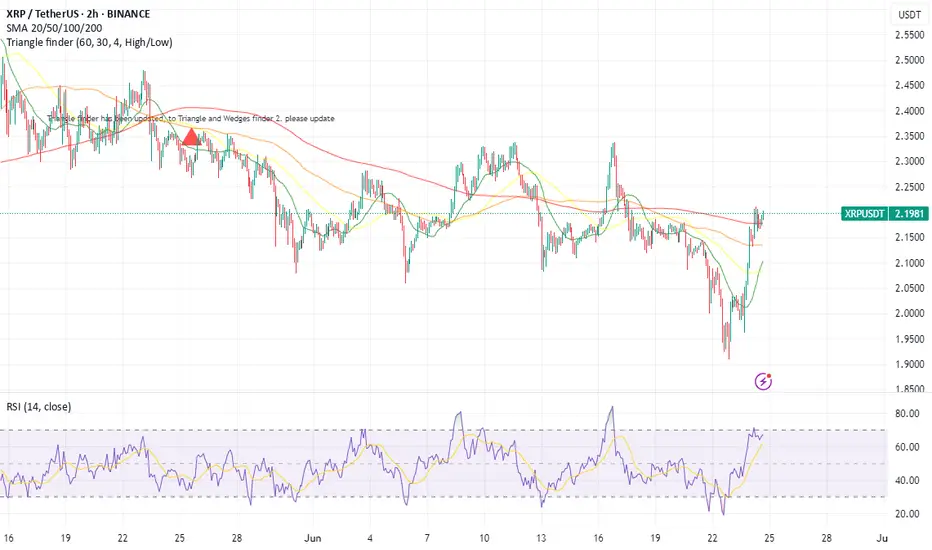
XRP Price Soars Past $2.15: Next Stop $2.38? XRP Price Prediction: What’s Next After Breaking $2.15 Resistance?
Ripple’s XRP has been making waves in the cryptocurrency market, recently breaking above the critical $2.15 resistance level and surging nearly 8% in the last 24 hours to trade at $2.18. With a further 9% climb in recent sessions and open interest jumping to $3.77 billion, the coin is showing strong bullish momentum. Analysts are now eyeing targets of $2.33 and even $2.38 in the near term. But what lies ahead for XRP after this breakout? Is this the start of a sustained rally, or could resistance at higher levels cap the gains?
________________________________________
XRP Price Action: Breaking Key Resistance at $2.15
XRP’s recent price surge has caught the attention of traders and investors alike. After trading in a consolidation range for weeks, the cryptocurrency initiated a fresh increase from the $1.92 zone, gaining momentum as it approached the $2.00 level. A significant development came when XRP broke above a key bearish trend line with resistance at $2.00 on the hourly chart of the XRP/USD pair (data sourced from Kraken). This breakout was followed by a decisive move past the $2.15 resistance, a level that had previously capped upward movements.
Currently, XRP trades above $2.18, sitting comfortably above the 100-hourly Simple Moving Average (SMA), a widely watched indicator of short-term trend direction. The price action over the last 24 hours shows an 8.2% increase, with some sessions recording gains as high as 14%, particularly following geopolitical developments like the Iran-Israel ceasefire, which boosted risk assets across markets. This recovery from the $1.90 low demonstrates strong buying interest and renewed confidence in XRP’s potential.
The immediate question for traders is whether XRP can sustain this momentum. The next resistance zone lies between $2.20 and $2.33, with some analysts even targeting $2.38 based on rising open interest and market volume. A close above $2.18 in the coming hours could signal the start of another leg up, while failure to hold this level might see a pullback toward $2.10 or lower.
________________________________________
Technical Analysis: Bullish Indicators and Key Levels to Watch
To understand XRP’s potential trajectory, let’s dive into the technical indicators and key levels shaping its price action.
Support and Resistance Levels
• Support: The $2.10 level, previously a resistance, now acts as a near-term support alongside the 100-hourly SMA. A break below this could see XRP test the $2.05 zone, with further downside potential to $1.92 if bearish pressure mounts.
• Resistance: The immediate hurdle lies at $2.20, a psychological barrier that has historically posed challenges. Beyond this, $2.33 emerges as a critical target, as breaking this level could confirm a short-term bullish continuation. Analysts also highlight $2.38 as a feasible target if momentum persists.
Moving Averages and Trend Indicators
XRP’s position above the 100-hourly SMA is a bullish sign, indicating that buyers are in control of the short-term trend. Additionally, the price recently crossed above the 50-hourly SMA during its 14% surge, further reinforcing the bullish outlook. The convergence of these moving averages suggests that a golden cross—a bullish signal where a shorter-term average crosses above a longer-term average—could be forming on lower timeframes, potentially attracting more buyers.
Relative Strength Index (RSI)
The RSI on the hourly chart currently sits around 65, indicating that XRP is approaching overbought territory but still has room to run before reaching extreme levels (above 70). This suggests that the current rally could extend further, provided no major negative catalysts emerge.
Volume and Open Interest
One of the most encouraging signs for XRP bulls is the surge in trading volume and open interest. Open interest in XRP futures has jumped to $3.77 billion, reflecting growing speculative interest and confidence in further price gains. High volume accompanying the breakout above $2.15 adds credibility to the move, as it indicates genuine market participation rather than a low-liquidity pump.
Symmetrical Triangle Pattern
On the longer-term charts, XRP has been forming a 334-day symmetrical triangle, a consolidation pattern often preceding major breakouts. Analysts predict that this pattern could resolve between July and September 2025, with potential targets ranging from $2 to $5 depending on the direction of the breakout. The recent move above $2.15 could be an early indication of bullish intent, though confirmation of a full breakout from the triangle remains months away.
________________________________________
XRP Price Prediction: Short-Term Outlook (Next 24-48 Hours)
Given the current momentum, XRP appears poised for further gains in the immediate term. Analysts predict a potential 7% move toward $2.33 within the next 24 hours if the price maintains its position above $2.18. This target aligns with the upper boundary of the recent trading range and represents a key Fibonacci retracement level from the prior downtrend.
However, traders should remain cautious of the $2.20 resistance zone, where selling pressure could emerge. A failure to close above this level on the hourly or 4-hour charts might trigger profit-taking, leading to a pullback toward $2.10 or $2.05. On the flip side, a decisive break above $2.20 with strong volume could pave the way for a test of $2.33 and potentially $2.38 in the coming days.
________________________________________
What XRP Users Are Talking About This Week: Rumors, Predictions, and Debates
The XRP community has been abuzz with discussions this week, fueled by the coin’s impressive price action and broader market developments. Here are some of the key topics dominating conversations on platforms like Twitter, Reddit, and crypto forums:
1. Geopolitical Impact on XRP: The recent Iran-Israel ceasefire has been credited with boosting risk-on sentiment across markets, including cryptocurrencies. Many XRP holders believe this event contributed to the 14% surge that saw the price reclaim $2.00, with some speculating that further de-escalation could drive additional gains.
2. Regulatory Clarity for Ripple: Ongoing debates about Ripple’s legal battle with the U.S. Securities and Exchange Commission (SEC) continue to influence sentiment. While a resolution seems closer than ever, with rumors of a potential settlement circulating, uncertainty remains a key concern. A favorable outcome could act as a major catalyst for XRP, potentially pushing it toward new highs.
3. Adoption and Utility: XRP users are excited about Ripple’s continued partnerships with financial institutions for cross-border payments. Recent announcements of pilot programs in new regions have fueled speculation that increased adoption could drive organic demand for XRP, supporting long-term price appreciation.
4. Price Predictions: Community predictions range from conservative targets of $2.50 in the near term to more ambitious forecasts of $5 or higher by the end of 2025. Much of this optimism hinges on the symmetrical triangle breakout expected next year, as well as broader market trends like the Bitcoin halving in 2024.
These discussions highlight the mix of optimism and caution within the XRP community. While the recent breakout has bolstered confidence, many users remain wary of external factors like regulatory developments and macroeconomic conditions that could impact the coin’s trajectory.
________________________________________
XRP Climbs 9% as Open Interest Jumps to $3.77B: Eyes $2.38 Target
XRP’s 9% climb in a recent session, coupled with open interest soaring to $3.77 billion, underscores the growing interest from both retail and institutional traders. Open interest represents the total value of outstanding derivative contracts, and its sharp increase suggests that market participants are betting on continued price movement—likely to the upside given the current trend.
This surge in open interest aligns with XRP’s break above $2.15, reinforcing the notion that the rally has strong backing. Analysts now eye a $2.38 target, which corresponds to the 61.8% Fibonacci retracement level from the previous major swing high to low. Achieving this target would require sustained buying pressure and a break above the $2.33 resistance, but the current market dynamics suggest it’s within reach if no major sell-offs occur.
However, high open interest also introduces the risk of volatility. If the price fails to break higher and sentiment shifts, a wave of liquidations could amplify downside moves. Traders should monitor funding rates on futures platforms to gauge whether speculative positions are becoming overly leveraged, as this could signal an impending correction.
________________________________________
Ceasefire Boosts XRP Recovery: Bullish Continuation
Above $2.33?
The geopolitical landscape has played a surprising role in XRP’s recent recovery. Following a low of $1.90 amid broader market uncertainty, the announcement of a ceasefire between Iran and Israel injected optimism into risk assets, including cryptocurrencies. XRP responded with a 14% jump to reclaim the $2.00 level, a move that has since solidified with the break above $2.15.
This recovery highlights XRP’s sensitivity to external catalysts. While technical factors like resistance levels and chart patterns drive day-to-day price action, macro events can act as significant tailwinds or headwinds. If the ceasefire holds and global markets remain stable, XRP could see continued buying interest from investors seeking exposure to high-growth assets.
The key level to watch now is $2.33. A break above this resistance with strong volume could confirm a short-term bullish continuation, potentially targeting $2.38 or higher. Conversely, if geopolitical tensions resurface or broader market sentiment sours, XRP might struggle to maintain its gains, with $2.10 acting as the first line of defense.
________________________________________
When Will XRP Price Hit All-Time High? Timeline Revealed
XRP’s all-time high (ATH) of $3.84, reached during the 2017-2018 bull run, remains a distant target for many holders. However, recent technical developments and market trends provide clues about when the coin might approach or surpass this level.
Symmetrical Triangle Breakout: July–September 2025
As mentioned earlier, XRP has been forming a 334-day symmetrical triangle on the weekly chart, a pattern characterized by converging trendlines as price swings narrow over time. Such patterns often precede significant breakouts, with the direction determined by market sentiment at the time of resolution. Analysts predict that this triangle could break between July and September 2025, offering a window for a major price move.
If the breakout is bullish, targets range from $2 (a conservative estimate based on prior resistance) to $5 (a more optimistic projection based on the triangle’s height). A $5 target would represent a new ATH, surpassing the 2018 peak by over 30%. This scenario assumes favorable market conditions, including a broader crypto bull run potentially triggered by the Bitcoin halving in 2024.
Factors Influencing an ATH
Several factors could influence whether XRP reaches a new ATH within this timeline:
• Regulatory Resolution: A positive outcome in Ripple’s SEC lawsuit could remove a major overhang, unlocking significant upside potential.
• Market Cycles: Crypto markets often follow cyclical patterns, with bull runs occurring every 3-4 years. If 2025 aligns with the next cycle peak, XRP could ride the wave to new highs.
• Adoption Growth: Increased use of XRP for cross-border payments through RippleNet could drive organic demand, supporting a higher price floor.
• Macro Environment: Favorable economic conditions, such as low interest rates or stimulus measures, could boost risk assets like XRP.
While predicting an exact date for an ATH is impossible, the July–September 2025 window provides a reasonable timeframe for a potential breakout. Investors should remain attentive to technical confirmation and external catalysts as this period approaches.
________________________________________
XRP Price Reclaims Key Resistance: Are More Gains on the Horizon?
XRP’s reclaiming of the $2.10 and $2.15 levels marks a significant milestone in its recovery from the $1.92 low. This move above key resistance zones suggests that bullish momentum is building, with the potential for further gains if higher levels are breached.
The price is now trading above $2.18, and a close above $2.20 could signal the start of a fresh increase. However, the $2.20-$2.33 range remains a critical battleground. Bulls will need to defend recent gains while pushing for a decisive break above these levels to confirm the next leg up. If successful, targets of $2.38 and beyond come into play, aligning with analyst predictions and Fibonacci extensions.
On the downside, a failure to hold $2.10 could see XRP retest lower supports at $2.05 or $1.92. Such a pullback would not necessarily invalidate the bullish trend but could delay the anticipated rally toward higher targets. Traders should use stop-loss orders and monitor volume trends to manage risk during this volatile period.
________________________________________
Long-Term XRP Price Prediction: $2 to $5 by 2025?
Looking beyond the immediate term, XRP’s long-term outlook remains optimistic, contingent on several key developments. The symmetrical triangle pattern, if resolved bullishly, could propel XRP toward $2-$5 by the end of 2025. This range accounts for both conservative and aggressive scenarios, with the higher end assuming a full market cycle peak and positive catalysts like regulatory clarity.
Even in a more cautious scenario, XRP appears well-positioned to reclaim its prior highs above $3 if adoption continues to grow and broader crypto sentiment remains favorable. Key drivers include Ripple’s expansion into new markets, potential listings on major exchanges post-SEC resolution, and technological upgrades to the XRP Ledger that enhance scalability and utility.
However, risks remain. Regulatory setbacks, competition from other payment-focused cryptocurrencies, and macroeconomic downturns could cap XRP’s upside. Investors with a long-term horizon should diversify their portfolios and remain adaptable to changing market conditions.
________________________________________
Conclusion: XRP’s Path Forward After $2.15 Breakout
XRP’s recent breakout above the $2.15 resistance has ignited optimism among traders and investors, with the coin now trading at $2.18 after an 8.2% surge in 24 hours. Technical indicators like the 100-hourly SMA and rising open interest of $3.77 billion support a bullish near-term outlook, with targets of $2.33 and $2.38 in sight if momentum holds. The geopolitical boost from the Iran-Israel ceasefire and ongoing community discussions about adoption and regulation further fuel the narrative of potential gains.
In the short term, XRP must overcome resistance at $2.20 to confirm the next leg up, while holding support at $2.10 to avoid a pullback. Looking further ahead, the symmetrical triangle pattern suggests a major breakout window between July and September 2025, with price targets ranging from $2 to $5—potentially marking a new all-time high if conditions align.
While challenges like regulatory uncertainty and market volatility persist, XRP’s current trajectory indicates that more gains could be on the horizon. Traders and investors should stay vigilant, monitoring key levels, volume trends, and external catalysts to capitalize on this evolving opportunity. Whether XRP sustains its rally or faces a correction, one thing is clear: the cryptocurrency remains a focal point of excitement and speculation in the ever-dynamic crypto market.
Wake-Up Time for Walmart?Walmart has snoozed for months, but some traders may think it’s waking up.
The first pattern on today’s chart is the price range on either side of roughly $95. The retail giant peaked at that level in early December and is back near the same location more than six months later. That indicates a period of consolidation has occurred.
Second, a weekly low of $93.43 developed near the bottom of the range. WMT held it last week and bounced, which may suggest support is in place.
Third, stochastics have rebounded from an oversold condition and prices are bouncing at the 100-day simple moving average. Those signals may imply a longer-term uptrend remains in effect and is reasserting itself.
Finally, traders looking to the upside may notice the February 20 gap around $100. WMT probed that level in early June before backing down. Is another test coming?
Check out TradingView's The Leap competition sponsored by TradeStation.
TradeStation has, for decades, advanced the trading industry, providing access to stocks, options and futures. If you're born to trade, we could be for you. See our Overview for more.
Past performance, whether actual or indicated by historical tests of strategies, is no guarantee of future performance or success. There is a possibility that you may sustain a loss equal to or greater than your entire investment regardless of which asset class you trade (equities, options or futures); therefore, you should not invest or risk money that you cannot afford to lose. Online trading is not suitable for all investors. View the document titled Characteristics and Risks of Standardized Options at www.TradeStation.com . Before trading any asset class, customers must read the relevant risk disclosure statements on www.TradeStation.com . System access and trade placement and execution may be delayed or fail due to market volatility and volume, quote delays, system and software errors, Internet traffic, outages and other factors.
Securities and futures trading is offered to self-directed customers by TradeStation Securities, Inc., a broker-dealer registered with the Securities and Exchange Commission and a futures commission merchant licensed with the Commodity Futures Trading Commission). TradeStation Securities is a member of the Financial Industry Regulatory Authority, the National Futures Association, and a number of exchanges.
TradeStation Securities, Inc. and TradeStation Technologies, Inc. are each wholly owned subsidiaries of TradeStation Group, Inc., both operating, and providing products and services, under the TradeStation brand and trademark. When applying for, or purchasing, accounts, subscriptions, products and services, it is important that you know which company you will be dealing with. Visit www.TradeStation.com for further important information explaining what this means.

Pullback in GE AerospaceGE Aerospace has been rallying, and now it’s pulled back.
The first pattern on today’s chart is the steady advance in April and May that established GE at its highest levels since 2001. Is an accumulation phase underway?
Second is the May 23 close of $232.79. The industrial stock tested and held it yesterday after lingering above it all last week. That could mean new support is in place.
The pullback also represented approximately a 50 percent retracement of the move following the breakout.
Next, stochastics are turning up from an oversold condition.
Finally, the 8-day exponential moving average (EMA) has stayed above the 21-day EMA. That may reflect a bullish trend.
Check out TradingView's The Leap competition sponsored by TradeStation.
TradeStation has, for decades, advanced the trading industry, providing access to stocks, options and futures. If you're born to trade, we could be for you. See our Overview for more.
Past performance, whether actual or indicated by historical tests of strategies, is no guarantee of future performance or success. There is a possibility that you may sustain a loss equal to or greater than your entire investment regardless of which asset class you trade (equities, options or futures); therefore, you should not invest or risk money that you cannot afford to lose. Online trading is not suitable for all investors. View the document titled Characteristics and Risks of Standardized Options at www.TradeStation.com . Before trading any asset class, customers must read the relevant risk disclosure statements on www.TradeStation.com . System access and trade placement and execution may be delayed or fail due to market volatility and volume, quote delays, system and software errors, Internet traffic, outages and other factors.
Securities and futures trading is offered to self-directed customers by TradeStation Securities, Inc., a broker-dealer registered with the Securities and Exchange Commission and a futures commission merchant licensed with the Commodity Futures Trading Commission). TradeStation Securities is a member of the Financial Industry Regulatory Authority, the National Futures Association, and a number of exchanges.
TradeStation Securities, Inc. and TradeStation Technologies, Inc. are each wholly owned subsidiaries of TradeStation Group, Inc., both operating, and providing products and services, under the TradeStation brand and trademark. When applying for, or purchasing, accounts, subscriptions, products and services, it is important that you know which company you will be dealing with. Visit www.TradeStation.com for further important information explaining what this means.

MercadoLibre Pulls BackMercadoLibre rallied to new highs last month, and some traders may see an opportunity in its latest pullback.
The first pattern on today’s chart is the $2,374.54 level. MELI first touched that price on February 21 after reporting strong earnings. The stock gapped above the level in May on another strong quarterly report and has now retested it. Will the old resistance emerge as new support?
Second, price gains after the last two quarterly reports may reflect positive fundamental sentiment in the Latin American e-commerce company.
Third, stochastics have dipped to an oversold condition.
Check out TradingView's The Leap competition sponsored by TradeStation.
TradeStation has, for decades, advanced the trading industry, providing access to stocks, options and futures. If you're born to trade, we could be for you. See our Overview for more.
Past performance, whether actual or indicated by historical tests of strategies, is no guarantee of future performance or success. There is a possibility that you may sustain a loss equal to or greater than your entire investment regardless of which asset class you trade (equities, options or futures); therefore, you should not invest or risk money that you cannot afford to lose. Online trading is not suitable for all investors. View the document titled Characteristics and Risks of Standardized Options at www.TradeStation.com . Before trading any asset class, customers must read the relevant risk disclosure statements on www.TradeStation.com . System access and trade placement and execution may be delayed or fail due to market volatility and volume, quote delays, system and software errors, Internet traffic, outages and other factors.
Securities and futures trading is offered to self-directed customers by TradeStation Securities, Inc., a broker-dealer registered with the Securities and Exchange Commission and a futures commission merchant licensed with the Commodity Futures Trading Commission). TradeStation Securities is a member of the Financial Industry Regulatory Authority, the National Futures Association, and a number of exchanges.
TradeStation Securities, Inc. and TradeStation Technologies, Inc. are each wholly owned subsidiaries of TradeStation Group, Inc., both operating, and providing products and services, under the TradeStation brand and trademark. When applying for, or purchasing, accounts, subscriptions, products and services, it is important that you know which company you will be dealing with. Visit www.TradeStation.com for further important information explaining what this means.

Broadcom Dips After EarningsBroadcom is pulling back after reporting quarterly results, and potential buyers may be waiting.
The first pattern on today’s chart is the price zone between the late-May weekly low of $221.60 and the February high of $237.93. This may be an initial area where traders look for support.
Second, the 21-day exponential moving average (EMA) is approaching from below. That may suggest the chip stock’s short-term trend is still bullish.
Third, Wilder’s Relative Strength Index (RSI) is dipping from an overbought condition. A reading closer to the midpoint around 50 could potentially satisfy investors worried about chasing.
Finally, AVGO is an active underlier in the options market. (Its average daily volume is about 240,000 contracts in the last month.) That could make it easier for traders to take positions with calls and puts.
Check out TradingView's The Leap competition sponsored by TradeStation.
TradeStation has, for decades, advanced the trading industry, providing access to stocks, options and futures. If you're born to trade, we could be for you. See our Overview for more.
Past performance, whether actual or indicated by historical tests of strategies, is no guarantee of future performance or success. There is a possibility that you may sustain a loss equal to or greater than your entire investment regardless of which asset class you trade (equities, options or futures); therefore, you should not invest or risk money that you cannot afford to lose. Online trading is not suitable for all investors. View the document titled Characteristics and Risks of Standardized Options at www.TradeStation.com . Before trading any asset class, customers must read the relevant risk disclosure statements on www.TradeStation.com . System access and trade placement and execution may be delayed or fail due to market volatility and volume, quote delays, system and software errors, Internet traffic, outages and other factors.
Securities and futures trading is offered to self-directed customers by TradeStation Securities, Inc., a broker-dealer registered with the Securities and Exchange Commission and a futures commission merchant licensed with the Commodity Futures Trading Commission). TradeStation Securities is a member of the Financial Industry Regulatory Authority, the National Futures Association, and a number of exchanges.
Options trading is not suitable for all investors. Your TradeStation Securities’ account application to trade options will be considered and approved or disapproved based on all relevant factors, including your trading experience. See www.TradeStation.com . Visit www.TradeStation.com for full details on the costs and fees associated with options.
Margin trading involves risks, and it is important that you fully understand those risks before trading on margin. The Margin Disclosure Statement outlines many of those risks, including that you can lose more funds than you deposit in your margin account; your brokerage firm can force the sale of securities in your account; your brokerage firm can sell your securities without contacting you; and you are not entitled to an extension of time on a margin call. Review the Margin Disclosure Statement at www.TradeStation.com .
TradeStation Securities, Inc. and TradeStation Technologies, Inc. are each wholly owned subsidiaries of TradeStation Group, Inc., both operating, and providing products and services, under the TradeStation brand and trademark. When applying for, or purchasing, accounts, subscriptions, products and services, it is important that you know which company you will be dealing with. Visit www.TradeStation.com for further important information explaining what this means.

Silver & Gold Surge: SLV Inflows & GLD TargetsThe precious metals market is currently experiencing a significant surge, with both silver and gold capturing the attention of investors worldwide. This rally is underpinned by a confluence of factors, ranging from robust investment inflows into exchange-traded funds (ETFs) to evolving macroeconomic landscapes and persistent geopolitical uncertainties. The iShares Silver Trust (SLV) ETF has witnessed an unprecedented influx of capital, signaling a strong bullish sentiment for the white metal, while gold, represented by the GLD, is poised for a potential rebound, with analysts eyeing key price levels. Understanding the intricate dynamics driving these movements is crucial for anyone looking to navigate the contemporary financial markets.
SLV ETF Inflows Surge: Silver's Accelerated Rally
The iShares Silver Trust (SLV), the world's largest silver-backed exchange-traded fund, has recently recorded its most substantial inflows in years, marking a pivotal moment for the silver market. Last week alone, the SLV ETF saw weekly inflows surge by $451 million, a dramatic increase from previous weeks, pushing its year-to-date inflows to over $458 million and its total assets under management to more than $17 billion. This remarkable accumulation of capital into SLV signifies a profound shift in investor sentiment, reflecting a strong conviction that silver prices are set for continued appreciation. When investors pour money into an ETF like SLV, it directly translates into the fund acquiring more physical silver, thereby tightening supply and exerting upward pressure on prices. This massive inflow is not merely speculative; it indicates a broad-based belief among both institutional and retail investors in silver's potential.
Several key factors are fueling this accelerated rally in silver prices. One significant driver is the record-breaking surge in gold prices. Historically, silver has often been referred to as "poor man's gold" due to its similar safe-haven properties but lower price point. When gold experiences a substantial rally, silver often follows suit, as investors look for a more affordable alternative within the precious metals complex. Gold's recent ascent to nearly $3,500 per ounce has undoubtedly created a halo effect for silver, drawing in capital from those seeking exposure to precious metals without the higher entry cost of gold.
Another compelling reason for silver's outperformance is its perceived undervaluation relative to gold. The gold/silver ratio, which measures how many ounces of silver are needed to buy one ounce of gold, had peaked at around 106 when gold was surging. However, this ratio has since dropped significantly to around 92, indicating that silver has begun to catch up, suggesting it was previously undervalued. This rebalancing of the ratio has encouraged investors to shift their focus towards silver, anticipating further narrowing of the gap.
Beyond its role as a monetary metal and safe haven, industrial demand plays a uniquely critical role in silver's price dynamics, distinguishing it from gold. Silver is an indispensable component in numerous high-tech and green energy applications due to its exceptional electrical conductivity, thermal properties, and reflectivity. The renewable energy sector, particularly photovoltaic (PV) solar panels, consumes substantial amounts of silver, with each panel containing approximately 20 grams of the metal. The global push towards decarbonization and the increasing adoption of solar energy are creating an insatiable demand for silver. Additionally, its use in electric vehicles (EVs), electronics manufacturing, 5G technology, and medical devices further bolsters its industrial consumption. Reports indicate that global silver demand reached 1.2 billion ounces in 2024, driven by these industrial applications, with a significant supply deficit projected to continue. This robust and growing industrial demand provides a strong fundamental floor for silver prices, making it less susceptible to purely speculative swings.
Geopolitical tensions and economic uncertainties also contribute to silver's appeal as a safe-haven asset. In times of global instability, investors tend to flock to tangible assets like precious metals to preserve wealth. While gold typically garners more attention in such scenarios, silver also benefits from this flight to safety. The ongoing geopolitical developments and concerns about inflation continue to reinforce the attractiveness of both gold and silver as hedges against economic volatility and currency depreciation.
From a technical analysis perspective, silver's rally appears robust. The iShares Silver Trust (SLV) has broken above significant resistance levels, such as $31.75, which had previously acted as a ceiling. The ETF is trading well above its 50-day and 100-day Exponential Moving Averages (EMA), indicating a strong bullish trend. While the Relative Strength Index (RSI) has moved closer to overbought levels, the overall trend remains bullish, and the MACD indicator continues to signal upward momentum. Analysts suggest that if these technical indicators hold, silver could target the $40 mark in the near future. The breadth of participation from both institutional and retail investors, coupled with increasing trading volumes, suggests that this rally has stronger foundations than typical short-term spikes.
Furthermore, expectations of potential interest rate cuts by the US Federal Reserve are also providing tailwinds for precious metals. Lower interest rates reduce the opportunity cost of holding non-yielding assets like silver and gold, making them more attractive to investors. The anticipation of such policy shifts often prompts investors to front-run these decisions, leading to increased demand for precious metals.
GLD ETF Weekly Forecast: Gold's Rebound Potential
While silver commands attention with its recent surge, gold, represented by the GLD remains the cornerstone of the precious metals market. Gold recently hit record highs, touching nearly $3,500 per ounce, before experiencing a slight retreat due to profit-taking and some strengthening of the US Dollar. However, analysts are now forecasting a potential rebound, with a target of $3430 on the cards for the current week, indicating that the bullish sentiment for gold remains largely intact.
GLD is influenced by a diverse array of factors, making its price movements complex yet predictable to those who understand its drivers. One of the primary factors is gold's status as a safe-haven asset. During periods of economic uncertainty, political instability, or market volatility, investors traditionally turn to gold to preserve capital. Recent geopolitical tensions, such as the ongoing conflict in Eastern Europe, have consistently driven inflows into gold, as it acts as a hedge against global crises.
The strength or weakness of the US Dollar plays a crucial role in gold's price. Gold is primarily priced in US Dollars, meaning that a weaker dollar makes gold comparatively cheaper for buyers holding other currencies, thereby increasing demand and pushing prices up. Conversely, a stronger dollar can make gold more expensive, potentially dampening demand. While there has been some recent dollar strength, the overall sentiment regarding the dollar's long-term trajectory and its inverse relationship with gold remains a key determinant.
Interest rates and monetary policy, particularly from the US Federal Reserve, significantly impact gold prices. As a non-yielding asset, gold becomes less attractive when interest rates are high, as investors can earn better returns from interest-bearing assets. Conversely, lower interest rates reduce the opportunity cost of holding gold, making it more appealing. The anticipation of future rate cuts by central banks often provides a strong impetus for gold rallies.
Inflation and deflationary pressures also influence gold's appeal. Gold is widely regarded as a hedge against inflation. When the purchasing power of fiat currencies erodes due to rising inflation, investors often turn to gold to protect their wealth. Conversely, in deflationary environments, gold's appeal as a store of value can also increase. Recent inflation data, such as the Consumer Price Index (CPI) and Producer Price Index (PPI), are closely watched for their potential impact on gold's trajectory.
Central bank reserves and their purchasing trends are another significant, albeit often overlooked, factor. Central banks globally hold gold as a reserve asset to diversify their portfolios and safeguard against financial turmoil. Increased gold purchases by central banks signal a broader institutional confidence in gold and can significantly impact its demand and price.
Supply and demand dynamics in the physical gold market, including mining production, recycling, and demand from jewelry and industrial sectors, also play a role. While new supply from mining is relatively small compared to the total existing stock, changes in production levels can still influence prices. Investment demand through ETFs and other financial products further contributes to the overall demand picture.
From a technical standpoint, gold's recent retreat from its $3,500 peak has led to some profit-taking. However, key support levels are being tested, and analysts are looking for a rebound. The immediate resistance levels are around $3340-$3345, with a more significant hurdle at $3400. A decisive break above these levels, particularly $3400, could pave the way for a retest of the $3430 mark and potentially higher, towards $3500 and even $3600. The current bias for gold remains bullish, with buying opportunities identified at key pivot levels. The market is closely watching economic reports, such as the upcoming CPI data, as well as geopolitical developments, which could act as catalysts for gold's next major move.
The Interplay Between Gold and Silver
The intertwined fortunes of gold and silver are a recurring theme in the precious metals market. While both are considered safe-haven assets, their individual characteristics lead to nuanced differences in their price drivers. Gold is predominantly viewed as a monetary asset and a store of value, making it highly sensitive to macroeconomic indicators, interest rates, and geopolitical stability. Silver, while sharing these attributes, also benefits significantly from its extensive industrial applications. This dual nature often makes silver more volatile than gold, as it reacts to both investment demand and industrial cycles.
The recent outperformance of silver, as evidenced by the massive SLV ETF inflows, suggests a market correction where silver is catching up to gold's earlier gains. The narrowing gold-silver ratio indicates that investors believe silver was undervalued and is now reasserting its true worth. This dynamic creates a powerful feedback loop: as gold rallies, it draws attention to the precious metals sector, prompting investors to look for relative value, which often leads them to silver. As silver then accelerates, it further validates the strength of the broader precious metals market.
The current environment, characterized by persistent inflation concerns, ongoing geopolitical tensions, and the global push towards green energy technologies, provides a fertile ground for both gold and silver. Gold offers a traditional hedge against uncertainty, while silver provides exposure to both safe-haven demand and the booming industrial sector. The significant institutional inflows into SLV underscore a growing recognition of silver's unique position at the intersection of finance and industry.
In conclusion, the precious metals market is currently in a robust uptrend, driven by a powerful combination of investment demand, safe-haven appeal, and fundamental industrial growth. The unprecedented inflows into the SLV ETF signal a strong bullish outlook for silver, fueled by its undervaluation relative to gold and its critical role in emerging green technologies. Concurrently, gold, despite recent fluctuations, maintains a strong bullish bias, with analysts forecasting a rebound to key price levels, supported by its enduring safe-haven status and macroeconomic tailwinds. For investors, understanding these intertwined dynamics and monitoring key economic and geopolitical developments will be paramount in capitalizing on the ongoing rally in both gold and silver. The message is clear: the precious metals are shining bright, and their current momentum suggests further upside potential.
Altcoins in Focus: Aptos, KAIA, and Ravencoin (RVN)Amid Bitcoin’s rapid growth and renewed interest in Ethereum, investors are increasingly turning their attention to altcoins—alternative cryptocurrencies showing strong potential for sharp gains. As of early June 2025, Aptos (APT), KAIA, and Ravencoin (RVN) stand out for their price surges and growing interest from major exchanges and analysts.
Aptos, a next-generation blockchain platform developed by former Meta (ex-Diem) engineers, has secured its place among the top 50 by market cap. In recent days, the token broke through a resistance level at $9.20, signaling a possible continuation of the uptrend. Its appeal lies in its scalability and its unique MoveVM architecture, which makes it attractive for developers in DeFi and NFT applications.
KAIA, a new token in the AI and metaverse ecosystem, gained over 15% this week following a Binance listing and integration with several major Web3 projects. Investors see KAIA as a potential “new Render,” focusing on neural computation and digital identity infrastructure.
Ravencoin (RVN), a long-time presence in the crypto space, is regaining popularity. With its focus on asset tokenization and copyright protection on the blockchain, RVN surged 14% after announcing partnerships with several independent music platforms.
The rise of these altcoins demonstrates that there is room in the crypto world not just for the giants, but also for innovative, purpose-driven projects capable of capturing market and user interest.

Zcash (ZEC) Explodes 12% Amidst Privacy Coin Rally: Is $300 the With ZEC recovering from $30 to hit $50 and the privacy sector gaining momentum, we delve into the catalysts, challenges, and the bold analyst prediction for Zcash's future.
The cryptocurrency market, a realm of perpetual motion and often unpredictable surges, has recently cast its spotlight on a specific niche that champions user anonymity: privacy coins. Leading this charge, Zcash (ZEC) has registered an impressive 12% gain, a move that has not only gladdened the hearts of its holders but also signaled a broader resurgence in coins designed to obscure transactional data. This rally, which has also seen contemporaries like Monero (XMR) post decent gains, underscores a growing interest or perhaps a renewed appreciation for financial privacy in the digital age.
Zcash, in particular, has demonstrated robust recovery. After languishing at a low of approximately $30 in February, the ZEC token has battled its way back to the significant $50 mark. This psychological and technical level is often viewed by traders as a crucial pivot point. The bullish sentiment is further amplified by a crypto analyst's bold prediction: should Zcash manage a sustained breakout, its price could target an ambitious $300. Such a forecast, while speculative, invites a deeper examination of Zcash's fundamentals, the current market dynamics for privacy coins, and the potential trajectory for ZEC. What exactly is fueling this ascent, and what hurdles might Zcash face on its path to potentially higher valuations?
Understanding Zcash: The Science of Shielded Transactions
To appreciate the current price action and future potential of Zcash, it's essential to understand its core value proposition. Launched in October 2016 by the Electric Coin Company (ECC), spearheaded by Zooko Wilcox, Zcash emerged from the Zerocoin protocol, aiming to address the privacy limitations inherent in Bitcoin. While Bitcoin transactions are pseudonymous (linked to addresses, not direct identities), the public nature of its blockchain means that with enough analysis, transactions can often be traced back to individuals or entities.
Zcash offers a solution through its pioneering use of zk-SNARKs (Zero-Knowledge Succinct Non-Interactive Arguments of Knowledge). This advanced cryptographic technique allows one party (the prover) to prove to another party (the verifier) that a statement is true, without revealing any information beyond the validity of the statement itself. In the context of Zcash:
• Shielded Transactions: Users can send ZEC through shielded addresses (z-addresses). When a transaction occurs between two z-addresses, the sender, receiver, and amount are all encrypted on the blockchain. Zk-SNARKs are used to prove that the transaction is valid (e.g., the sender has sufficient funds, no double-spending) without disclosing the sensitive details.
• Transparent Transactions: Zcash also supports transparent addresses (t-addresses), which function similarly to Bitcoin addresses. Transactions between t-addresses, or between a t-address and a z-address, will have some or all transaction details publicly visible.
•
This optional privacy is a key differentiator for Zcash. Users can choose the level of privacy they require for each transaction. While this flexibility can be seen as an advantage for regulatory compliance and exchange listings, it has also been a point of debate, with some privacy purists arguing that optional privacy is not as robust as mandatory privacy (like Monero's).
The development of Zcash is primarily driven by the Electric Coin Company, with funding initially derived from a "Founder's Reward" where a portion of the block rewards for the first four years was distributed to founders, employees, advisors, and the non-profit Zcash Foundation. This model has since evolved, with community governance playing an increasing role in funding development through new development funds.
The Recent Price Surge: Deconstructing the 12% Jump and the Road from $30 to $50
Zcash's recent 12% price increase is significant not just in its magnitude but also in its context. The climb from a February low of around $30 to the current $50 level represents a more than 66% increase in a relatively short period. This recovery can be attributed to several
interconnected factors:
1. Broader Market Recovery: The entire cryptocurrency market has seen periods of bullish sentiment in recent months. As market leaders like Bitcoin and Ethereum gain, investor confidence often spills over into altcoins, including Zcash. A rising tide tends to lift all boats.
2. Privacy Coin Sector Momentum: There's a discernible trend of renewed interest in privacy coins. Monero, often seen as the flagship privacy coin, has also experienced positive price action. This collective movement suggests a sector-specific catalyst.
o Regulatory Concerns & Censorship Fears: Increased discussions around Central Bank Digital Currencies (CBDCs), financial surveillance, and potential censorship of non-custodial wallets or certain types of transactions may be driving users towards tools that offer greater financial anonymity.
o Geopolitical Instability: In times of global uncertainty or conflict, individuals may seek ways to protect their assets and transact without oversight from potentially unstable or authoritarian regimes. Privacy coins can be perceived as a tool for financial sovereignty.
o Desire for Fungibility: True fungibility means that each unit of a currency is interchangeable with any other unit of the same currency. Bitcoin's transparent ledger means that coins can be "tainted" if they were previously involved in illicit activities, potentially leading to them being rejected by exchanges or merchants. Shielded Zcash aims to provide stronger fungibility.
3. Technical Breakout: The move above key resistance levels on price charts can trigger further buying. For ZEC, overcoming resistance points between $30 and $45 likely attracted technical traders. The $50 mark itself is a significant psychological level. If ZEC can firmly establish $50 as support, it could build a base for further upward movement.
4. Narrative Resurgence: The "privacy narrative" in crypto tends to ebb and flow. It appears to be currently in an upswing, with influencers and media outlets paying more attention to the sector. This increased visibility can attract new investors.
5. Zcash-Specific Developments (Potentially): While not explicitly mentioned in the prompt, ongoing development work by the ECC and the Zcash Foundation, such as improvements to zk-SNARKs (like the Halo Arc upgrade which removed the need for a trusted setup for shielded transactions using the Orchard shielded pool), wallet usability enhancements, or progress on scalability solutions like Proof-of-Stake research, can contribute to positive sentiment over time.
The Analyst's Call: Can Zcash Realistically Target $300?
The prediction that Zcash could target $300 represents a 500% increase from its current $50 level. While such gains are not unprecedented in the volatile crypto market, achieving this target would require a confluence of highly favorable conditions.
Factors that could support such a rally:
1. Sustained Crypto Bull Market: A $300 ZEC is highly improbable without a broader, powerful bull run across the entire cryptocurrency asset class. If Bitcoin were to reach new all-time highs and altcoin season truly kicks in, ZEC could be a significant beneficiary, especially if the privacy narrative remains strong.
2. Major Adoption Catalysts:
o Institutional Interest: If institutions begin to see value in privacy-preserving digital assets, either for their treasuries or for offering privacy-focused financial products, Zcash could attract significant capital inflows.
o Merchant Adoption: Increased acceptance of ZEC (particularly shielded ZEC) for payments would enhance its utility and demand.
o DeFi Integration: If Zcash can be effectively and privately integrated into the Decentralized Finance (DeFi) ecosystem, it could unlock new use cases and demand.
3. Technological Breakthroughs: Further advancements in Zcash's technology that enhance privacy, scalability, or user experience could make it more attractive. For instance, reducing the computational requirements for generating shielded transactions or enabling private smart contracts could be game-changers.
4. Regulatory Clarity (Favorable): This is a double-edged sword. While crackdowns are a risk, clear and favorable regulations that acknowledge the legitimate uses of privacy coins could remove uncertainty and encourage investment. If Zcash's optional privacy model is seen as a compliant way to offer privacy, it might thrive.
5. Weakening of Competitors or Strengthening of ZEC's Unique Selling Proposition: If Zcash can more effectively articulate its advantages over other privacy solutions or if competitors face significant setbacks, ZEC could capture a larger market share.
6. Supply Dynamics: Like Bitcoin, Zcash has a finite supply (21 million coins). As issuance decreases over time due to halvings (Zcash had its first halving in November 2020), reduced new supply coupled with increased demand can lead to price appreciation.
Challenges and Headwinds on the Path to $300 (and Beyond)
Despite the bullish outlook, Zcash faces significant challenges:
1. Regulatory Scrutiny and Delistings: This remains the most significant threat to privacy coins. Governments and regulatory bodies worldwide are wary of technologies that could facilitate money laundering, terrorist financing, or tax evasion.
o FATF "Travel Rule": The Financial Action Task Force (FATF) guidelines require virtual asset service providers (VASPs) like exchanges to collect and share sender and receiver information for transactions above a certain threshold. This is difficult to implement for inherently private transactions.
o Exchange Delistings: Several major exchanges have delisted Zcash (especially its shielded functionality) or restricted its trading in certain jurisdictions due to regulatory pressure or an abundance of caution. Further delistings would severely impact liquidity and accessibility.
2. Competition: The privacy coin space is competitive.
o Monero (XMR): Monero uses a different approach (ring signatures, stealth addresses, RingCT) to provide mandatory privacy. It has a strong community and is often favored by privacy advocates for its "always-on" privacy.
o Newer Privacy Technologies: Other projects are exploring different privacy solutions, including Layer 2 privacy protocols on more scalable blockchains (e.g., zk-rollups on Ethereum that can offer privacy).
3. The "Optional Privacy" Dilemma: While intended as a feature for flexibility, Zcash's optional privacy means that the actual "anonymity set" for shielded transactions (the number of other shielded transactions yours is mixed with) can be smaller if most users opt for transparent transactions. This can, in theory, make shielded transactions less private than if privacy were mandatory and universally adopted on the network. The Zcash community and developers are actively working to encourage greater shielded adoption.
4. Perception and Misinformation: Privacy coins are often unfairly associated solely with illicit activities. Overcoming this negative perception and highlighting legitimate use cases (e.g., protecting commercial trade secrets, personal financial security, dissidents in oppressive regimes) is an ongoing challenge.
5. Scalability and Usability: While zk-SNARKs are powerful, generating shielded transactions has historically been more computationally intensive than transparent ones, leading to slower transaction times or higher fees on less powerful devices. Significant strides have been made with upgrades like FlyClient and the Orchard shielded pool, but continuous improvement is needed for mass adoption.
6. Development Funding and Governance: Ensuring sustainable funding for ongoing research, development, and ecosystem growth is crucial. The Zcash community's ability to effectively govern and allocate resources from its development fund will be key to its long-term success.
What Next for ZEC? Key Areas to Watch
Given the current momentum and the ambitious price targets, several factors will determine Zcash's trajectory:
1. Shielded Adoption Rate: The most critical internal metric for Zcash is the proportion of transactions that are shielded. Increased shielded usage strengthens the network's privacy guarantees and demonstrates the utility of its core technology. Initiatives like the ECC's focus on wallet usability for shielded transactions are vital.
2. Regulatory Developments: Any news related to regulations concerning privacy coins will heavily impact ZEC. Investors should closely monitor pronouncements from major regulatory bodies (SEC, FATF, European regulators, etc.).
3. Technological Roadmap Execution: The successful implementation of planned upgrades, particularly those related to scalability (like potential Proof-of-Stake implementation, which the ECC is researching), interoperability, and enhanced privacy features, will be crucial. The Zcash community recently approved a new roadmap focusing on making Zcash a proof-of-stake chain and introducing Zashi, a new Zcash-focused wallet.
4. Exchange Landscape: The willingness of major exchanges to continue listing ZEC and support its shielded withdrawals/deposits is paramount for liquidity and accessibility. Any new listings or, conversely, delistings will be significant market-moving events.
5. Broader Crypto Market Sentiment: Zcash's fate is still largely tied to the overall health of the cryptocurrency market. A sustained bear market would make significant price appreciation very difficult, regardless of Zcash's individual merits.
6. Institutional Narrative: If a narrative emerges where institutions begin to value or require on-chain privacy for certain operations, Zcash could be well-positioned if it can navigate the regulatory complexities.
7. Community Engagement and Development Activity: A vibrant and active community, along with consistent development contributions, signals a healthy project. Tracking developer activity, community discussions, and governance proposals can provide insights into the project's long-term viability.
Technical Analysis Snapshot (Hypothetical)
While a deep dive requires real-time charts, here's a general technical outlook based on the described price action:
• Current Level ($50): This is a key psychological and potential resistance/support level. A sustained break above and holding this level as support would be bullish.
• Next Resistance Levels: If $50 is overcome, traders would look for previous swing highs or Fibonacci extension levels. These could be in the $60-$70 range initially, then potentially $90-$100 (a previous significant area of activity for ZEC).
• Support Levels: If ZEC fails to hold $50, previous resistance levels around $40-$45 might act as support, followed by the $30 low.
• Moving Averages: Traders will watch if ZEC can stay above key moving averages (e.g., 50-day, 200-day). A "golden cross" (50-day MA crossing above 200-day MA) would be a strong bullish signal.
• Volume: Increased trading volume accompanying price rises is a sign of strong buying interest and validates the move.
• Relative Strength Index (RSI): An RSI moving into overbought territory (>70) might suggest a short-term pullback is due, but in strong uptrends, assets can remain overbought for extended periods.
The analyst's $300 target would likely involve breaking through multiple significant resistance zones established during previous bull markets.
Conclusion: Cautious Optimism for Zcash in a Privacy-Aware Future
Zcash's recent 12% price jump and its recovery to $50 are encouraging signs for the project and the broader privacy coin sector. The renewed interest in financial privacy, coupled with a generally improving crypto market, provides a favorable backdrop. The analyst's $300 price target, while ambitious, highlights the explosive potential that well-positioned altcoins can exhibit during strong bull cycles, especially those with unique and compelling technology.
However, the path forward for Zcash is fraught with challenges, predominantly regulatory uncertainty. The very feature that gives Zcash its value – privacy – is also its greatest vulnerability in the eyes of many global regulators. The project's ability to navigate this complex landscape, potentially by emphasizing its optional privacy as a compliant solution or by fostering a decentralized ecosystem resilient to censorship, will be paramount.
Investors and enthusiasts should monitor the adoption of shielded transactions, the progress on Zcash's technological roadmap (including the move to Proof-of-Stake and Zashi wallet development), the evolving regulatory environment, and the overall health of the crypto market. While $300 remains a speculative target, Zcash's robust technology and the enduring human desire for privacy ensure it will remain a significant and closely watched player in the digital asset space. The "what next" for ZEC will be a dynamic interplay between technological innovation, market sentiment, and the global conversation around financial privacy and freedom.
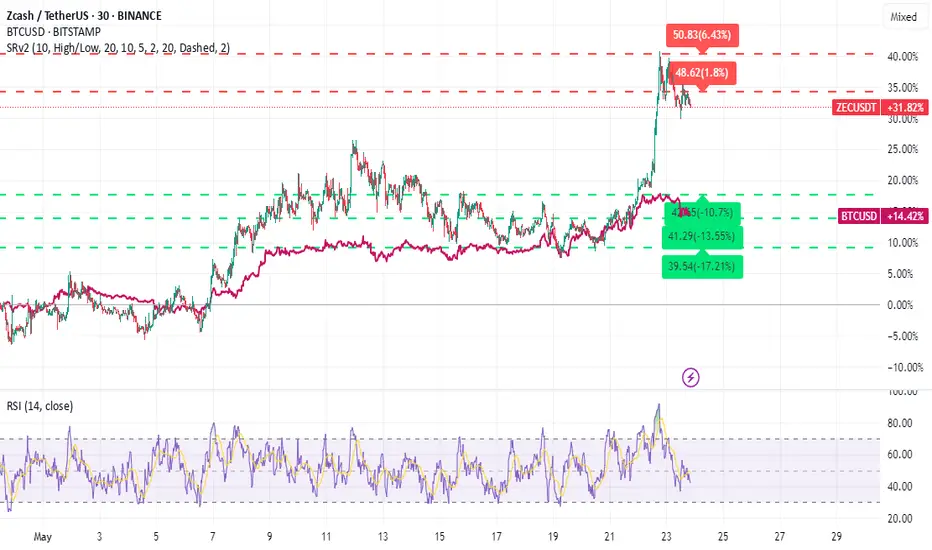
Las Vegas Sands May Show Signs of PeakingLas Vegas Sands bounced sharply in recent weeks, but some traders may think its longer-term downtrend will resume.
The first pattern on today’s chart is the decline from mid-December through early April. The casino stock retraced half that move before stalling. It also seems to be hitting resistance at a weekly close from March 21.
Second, the 50-day simple moving average (SMA) is under the 100-day SMA. Both are declining. That may be consistent with a longer-term downtrend.
Third, the stock has fallen back below its 8-day exponential moving average. That may suggest its short-term trend is no longer bullish.
Finally, stochastics are dipping from an overbought condition.
Check out TradingView's The Leap competition sponsored by TradeStation.
TradeStation has, for decades, advanced the trading industry, providing access to stocks, options and futures. If you're born to trade, we could be for you. See our Overview for more.
Past performance, whether actual or indicated by historical tests of strategies, is no guarantee of future performance or success. There is a possibility that you may sustain a loss equal to or greater than your entire investment regardless of which asset class you trade (equities, options or futures); therefore, you should not invest or risk money that you cannot afford to lose. Online trading is not suitable for all investors. View the document titled Characteristics and Risks of Standardized Options at www.TradeStation.com . Before trading any asset class, customers must read the relevant risk disclosure statements on www.TradeStation.com . System access and trade placement and execution may be delayed or fail due to market volatility and volume, quote delays, system and software errors, Internet traffic, outages and other factors.
Securities and futures trading is offered to self-directed customers by TradeStation Securities, Inc., a broker-dealer registered with the Securities and Exchange Commission and a futures commission merchant licensed with the Commodity Futures Trading Commission). TradeStation Securities is a member of the Financial Industry Regulatory Authority, the National Futures Association, and a number of exchanges.
TradeStation Securities, Inc. and TradeStation Technologies, Inc. are each wholly owned subsidiaries of TradeStation Group, Inc., both operating, and providing products and services, under the TradeStation brand and trademark. When applying for, or purchasing, accounts, subscriptions, products and services, it is important that you know which company you will be dealing with. Visit www.TradeStation.com for further important information explaining what this means.

BTC Hits New All-Time High: Is a $128K Blow-Off Top Next?Bitcoin's Meteoric Ascent: New All-Time Highs Fuel $128K "Blow-Off Top" Predictions Amidst Unprecedented Adoption
The digital gold rush of the 21st century is reaching a fever pitch. Bitcoin (BTC), the pioneering cryptocurrency, has not only shattered previous records but is now tantalizingly close to new, stratospheric all-time highs, with analysts eyeing a potential "blow-off top" as high as $128,000. This electrifying surge, which saw BTC climb to within 1.5% of new peaks as bullish sentiment decisively overcame final resistance, is underpinned by a confluence of factors: soaring institutional and retail adoption, particularly in the United States, booming ETF inflows, growing political and regulatory support, and a shifting macroeconomic landscape that increasingly favors non-traditional assets. As of May 21, 2025, Bitcoin has firmly established itself above the $109,000 mark, a testament to its resilience and burgeoning mainstream acceptance.
The recent price action has been nothing short of spectacular. Bitcoin bulls have been relentlessly "grilling sellers," pushing the price to historic milestones. On May 21, 2025, Bitcoin etched a new all-time high (ATH) above $109,000, a landmark achievement that notably placed 100% of BTC holders into profit. This surge saw Bitcoin's market capitalization briefly surpass that of e-commerce giant Amazon, a symbolic victory highlighting its growing financial clout. Specific figures around this period include a climb to a record $109,302, and another peak at a historic $109,500, demonstrating the intense buying pressure and bullish conviction in the market. Analysts are now recalibrating their upside targets, with many calling for $116,000 as the next significant milestone on the path to even loftier valuations.
This bullish momentum isn't occurring in a vacuum. It's the culmination of years of development, increasing understanding, and a series of pivotal events that have collectively propelled Bitcoin into the financial limelight.
The American Bitcoin Boom: Adoption Surpasses Gold, Institutions Dive In
One of the most compelling narratives driving Bitcoin's current rally is its explosive growth in the United States. A staggering 50 million Americans now own Bitcoin, a figure that notably surpasses the 37 million gold holders in the country. This demographic shift signifies a profound change in investment preferences, particularly among younger generations who are increasingly comfortable with digital assets. Bitcoin is no longer a niche interest for tech enthusiasts; it's becoming a recognized component of diversified investment portfolios across a broad swathe of the American population.
The institutional embrace within the US is equally, if not more, impactful. US firms now hold an astonishing 94.8% of the Bitcoin reserves held by publicly traded companies globally. This concentration underscores the confidence American corporations have in Bitcoin as a treasury reserve asset, a hedge against inflation, and a potential source of significant returns. Furthermore, the United States is solidifying its position as the global epicenter of the Bitcoin industry, with 40% of all Bitcoin companies headquartered domestically. This robust ecosystem of miners, exchanges, wallet providers, and ancillary service companies fosters innovation and provides a strong foundation for continued growth.
The advent and subsequent success of Bitcoin Exchange Traded Funds (ETFs) have been a game-changer. These regulated financial products have opened the floodgates for a new wave of capital, allowing retail and institutional investors to gain exposure to Bitcoin through traditional brokerage accounts without the complexities of direct ownership and custody. The "booming ETF inflows" are a direct contributor to the recent price surge, creating sustained buying pressure and signaling widespread market acceptance.
Macroeconomic Tailwinds and Regulatory Optimism
Beyond direct adoption, broader economic and political factors are playing a crucial role. The recent new all-time high of $109,000 was notably set just nine days after the US and China closed a 90-day trade agreement. This resolution eased economic uncertainty and market jitters that had previously weighed on global markets. In such an environment, assets perceived as hedges against traditional market volatility or fiat currency devaluation, like Bitcoin and gold, often thrive. Indeed, concurrent with Bitcoin's rise, concerns such as Japan's debt woes have contributed to gold surpassing the $3,300 mark, indicating a broader flight to alternative stores of value.
Furthermore, there's growing optimism around US regulations concerning cryptocurrencies. While the regulatory landscape is still evolving, recent pronouncements and actions suggest a move towards greater clarity and a more accommodative stance, rather than outright prohibition. This "growing political support" is crucial for long-term institutional commitment, as regulatory uncertainty has historically been a significant barrier to entry for larger, more conservative investors. The fact that Bitcoin climbed to a record of $109,302, breaching a previous high set around the time of a major political event like a presidential inauguration (specifically referenced as Trump's inauguration on Jan. 20 in a historical context for a previous ATH), often correlates with market sentiment interpreting political or regulatory shifts as favorable.
The "Bitcoin Strategic Reserve" (BSR): A Paradigm Shift for National Economies?
An intriguing, albeit more speculative, concept gaining traction is the idea of a "Bitcoin Strategic Reserve" (BSR). While not yet a formal policy in any major nation, the discussion itself highlights Bitcoin's evolving perception from a purely speculative asset to one with potential strategic geopolitical and economic importance.
A BSR would involve a nation-state, such as the United States, acquiring and holding Bitcoin as part of its national reserves, much like it currently holds gold or foreign currencies. The rationale behind such a move could be multifaceted:
1. Hedging Against Fiat Devaluation: As central banks globally continue to engage in monetary expansion, concerns about the long-term purchasing power of fiat currencies persist. Bitcoin, with its fixed supply, offers a potential hedge against this inflation.
2. Participating in a New Financial System: If Bitcoin continues its trajectory towards becoming a globally recognized store of value or even a medium of exchange for certain international transactions, holding it in reserve would position a nation to participate actively in this emerging financial infrastructure.
3. Technological Leadership: For a country like the US, which already leads in Bitcoin company headquarters and corporate holdings, establishing a BSR could further cement its leadership in the digital asset space, attracting talent and capital.
4. Economic Resilience: In a future where digital currencies play a more significant role, a BSR could offer a degree of economic resilience and autonomy, reducing reliance on traditional financial systems or the currencies of other nations.
The implications of a major economic power like the US even seriously considering, let alone implementing, a BSR would be monumental for Bitcoin's legitimacy and price. It would signal ultimate institutional acceptance and could trigger a wave of similar considerations by other nations, creating immense demand for a limited supply of BTC. While the "Bitcoin Strategic Reserve Explained and What BSR Means for the US Economy" remains a topic of forward-looking discussion, its emergence in financial discourse is a testament to how far Bitcoin has come.
The Path to $128K: Understanding the "Blow-Off Top"
With Bitcoin having decisively broken past $109,000 and upside targets of $116,000 now in common parlance, the ultimate bull-case scenario being discussed is a "blow-off top" potentially reaching $128,000 or even higher.
A "blow-off top" is a chart pattern that signifies a steep and rapid price increase in an asset, often on high volume, followed by an equally sharp reversal. It typically occurs at the end of a prolonged bull market or a parabolic advance. The psychology behind it involves:
1. Euphoria and FOMO (Fear Of Missing Out): As prices accelerate, media attention intensifies, and stories of quick riches abound. This draws in a flood of retail investors who don't want to miss out on the gains.
2. Exhaustion of Buyers: The parabolic rise eventually becomes unsustainable. The last wave of enthusiastic buyers enters at or near the peak.
3. Smart Money Distribution: Experienced traders and institutions, who may have accumulated positions much lower, begin to sell into this heightened demand, taking profits.
4. Sharp Reversal: Once buying pressure is exhausted and selling pressure mounts, the price can fall dramatically as latecomers panic-sell and stop-losses are triggered.
Predicting the exact peak of a blow-off top is notoriously difficult. However, analysts use a combination of technical analysis (chart patterns, momentum indicators, Fibonacci extensions), on-chain data (network activity, holder behavior), and market sentiment to identify potential price targets and warning signs. The $128,000 figure is likely derived from such analyses, representing a significant psychological level or a projection based on previous market cycle behavior.
Navigating the Bull Market: Indicators for Identifying a Cycle Top
While the current sentiment is overwhelmingly bullish, savvy Bitcoin traders and investors are always mindful of market cycles and the potential for corrections or trend reversals. The question, "Is Bitcoin price close to a cycle top?" is one that prudent market participants constantly evaluate. Several indicators can help traders gauge whether a market might be overheating:
1. Moving Average Convergence Divergence (MACD): This trend-following momentum indicator can show bearish divergences, where the price makes new highs, but the MACD fails to do so, signaling weakening momentum.
2. Relative Strength Index (RSI): An RSI reading above 70 is generally considered overbought, and readings above 80 or 90 in a strong bull market can signal extreme conditions, though Bitcoin can remain overbought for extended periods. Bearish divergences on the RSI are also key.
3. On-Chain Metrics (e.g., MVRV Z-Score, Puell Multiple, SOPR):
o MVRV Z-Score (Market Value to Realized Value): Compares Bitcoin's market cap to its realized cap (the price at which each coin last moved). High Z-scores indicate the market cap is significantly higher than the average cost basis, suggesting the asset is overvalued and potentially near a top.
o Puell Multiple: Looks at the supply side of Bitcoin's economy – miners and their revenue. It divides the daily issuance value of bitcoins (in USD) by the 365-day moving average of daily issuance value. High values suggest miner profitability is high compared to historical norms, which has sometimes coincided with market tops.
o Spent Output Profit Ratio (SOPR): This indicates if holders are, on average, selling in profit or loss. Values significantly above 1 suggest holders are realizing substantial profits, which can increase sell pressure. A sustained drop below 1 after a peak can signal a shift in trend.
4. Logarithmic Growth Curves: Bitcoin's long-term price action has often respected logarithmic growth channels. When the price reaches the upper band of these channels, it has historically indicated a market top.
5. Funding Rates and Open Interest in Derivatives Markets: Extremely high positive funding rates on perpetual swaps indicate that an overwhelming number of traders are long and paying a premium to maintain those positions. This can signal excessive bullishness and a crowded trade, making the market vulnerable to a long squeeze if prices reverse. High open interest can also exacerbate volatility.
While Bitcoin is currently refusing to give up on its quest to revisit $108,000 (a level now surpassed) and beyond, concerns over a trend change, though perhaps quieter amidst the euphoria, are always present in the minds of seasoned investors. These indicators provide a more objective lens through which to assess the sustainability of the current rally.
The Road Ahead: Uncharted Territory with Immense Potential
As Bitcoin forges new all-time highs, it enters uncharted territory. The confluence of unprecedented US adoption, robust institutional investment via ETFs, a more favorable regulatory outlook, and supportive macroeconomic conditions has created a potent cocktail for price appreciation. The surpassing of Amazon's market cap, even if temporary, and the fact that 100% of BTC holders are in profit, are powerful psychological milestones that can fuel further confidence.
The predictions of a $116,000 interim target and a potential $128,000 blow-off top are no longer fringe theories but are being seriously discussed by mainstream analysts. The narrative of Bitcoin as "digital gold" is gaining more traction than ever, especially as traditional safe havens like gold also see increased interest amidst global economic uncertainties like Japan's debt situation.
However, the path is unlikely to be linear. Bitcoin's inherent volatility means that sharp corrections can and will occur, even within a broader uptrend. The "concerns over a trend change" will likely grow louder as prices reach more extreme levels, and profit-taking becomes more tempting. Investors should remain vigilant, utilize the available indicators to assess market conditions, and practice sound risk management.
In conclusion, May 2025 has marked a historic period for Bitcoin. Its surge above $109,000, driven by a powerful combination of fundamental adoption and favorable market dynamics, has set the stage for potentially even more dramatic price action. Whether the ultimate peak of this cycle is $116,000, $128,000, or another figure entirely, one thing is clear: Bitcoin has firmly cemented its place in the global financial landscape, and its journey is far from over. The coming weeks and months will be closely watched by investors worldwide as the world's preeminent cryptocurrency continues to redefine the boundaries of financial assets.
________________________________________
Disclaimer: This article is for informational purposes only, based on the provided snippets, and should not be considered financial advice. Investing in Bitcoin and other cryptocurrencies is highly speculative and carries a significant risk of loss. Past performance is not indicative of future results. Always conduct your own thorough research and consult with a qualified financial advisor before making any investment decisions.

Potential Uptrend in NewmontNewmont has been climbing this year, and some traders may see further upside in the S&P 500’s only pure-play gold miner.
The first pattern on today’s chart is the pullback since mid-April. The lower low, lower high and second lower low may be viewed as a potential A-B-C correction. Completion of such a formation may suggest a longer-term uptrend is poised to resume.
Second, the 50-day simple moving average (SMA) had a “golden cross” above the 200-day SMA in April and has remained there since. That may reflect a bullish longer-term trend.
Third, prices are back above the 50-day SMA and bounced above the 200-day SMA.
Finally, stochastics are turning up from an oversold condition.
Check out TradingView's The Leap competition sponsored by TradeStation.
TradeStation has, for decades, advanced the trading industry, providing access to stocks, options and futures. If you're born to trade, we could be for you. See our Overview for more.
Past performance, whether actual or indicated by historical tests of strategies, is no guarantee of future performance or success. There is a possibility that you may sustain a loss equal to or greater than your entire investment regardless of which asset class you trade (equities, options or futures); therefore, you should not invest or risk money that you cannot afford to lose. Online trading is not suitable for all investors. View the document titled Characteristics and Risks of Standardized Options at www.TradeStation.com . Before trading any asset class, customers must read the relevant risk disclosure statements on www.TradeStation.com . System access and trade placement and execution may be delayed or fail due to market volatility and volume, quote delays, system and software errors, Internet traffic, outages and other factors.
Securities and futures trading is offered to self-directed customers by TradeStation Securities, Inc., a broker-dealer registered with the Securities and Exchange Commission and a futures commission merchant licensed with the Commodity Futures Trading Commission). TradeStation Securities is a member of the Financial Industry Regulatory Authority, the National Futures Association, and a number of exchanges.
TradeStation Securities, Inc. and TradeStation Technologies, Inc. are each wholly owned subsidiaries of TradeStation Group, Inc., both operating, and providing products and services, under the TradeStation brand and trademark. When applying for, or purchasing, accounts, subscriptions, products and services, it is important that you know which company you will be dealing with. Visit www.TradeStation.com for further important information explaining what this means.
