My Updated Outlook Of GoldD1 remains bearish even gold jumped last week after hitting 1680 area to 1739. Any rally to selling zone (1739-1780) would be good selling area. The buying zone (1676-1687) remains my favorite area to buy.
Trade wisely.
Centered Oscillators

GBPAUD Drop For Buying?Interesting to see GBPAUD D1 chart. We've been at ranging market for couple months. I spot divergence which are shown not only by MACD but RSI as well. Possibly it is indicating buy opportunity around the blue rectangle zone. Then the take profit target is the green rectangle zone.
Trade well and wisely. 🙏🙏🙏

USOIL REMAINS BEARISHD1 chart is showing us how bearish usoil. But I am not suggesting anyone to sell at current level. I prefer market to retrace to my selling zone. With the target taking profit 90-95 level if we get any retracement to the level I mark selling zone.
Trade well and wisely. 🙏🙏🙏

AUDUSD (STILL) BEARISH. SELL THE RALLYIf we see from D1 chart it is still overall bearish. Even lower time frame indicate bullish mode. I wpuld prefer to sell the rally as I have defined the area as selling zone. The downside target is the rectangle I put below. 0.6732-0.6681.
Trade well and wisely. 🙏🙏🙏

Selling Zone For Us OilFrom daily chart, it is still showing bearish trend (future cloud is bearish cloud). Price area between senkou b-senkou a would be selling zone.
Trade well and wisely.

Gold To Revisit 2021 Flash Crash Low?Daily chart is obviously bearish. But if u examine lower time frame 15mins, 30 mins both are indicating fresh selling pressure. Possibly we would see gold to revisit low of 2022 flash crash, 1687. The risk would be somewhere abovr 1720-1725.
Trade well and wisely. 🙏🙏🙏🙏

GBPAUD OTW BACK TO 1.74 AREA?I spotted h1 chart all indicating bearish. Bigger trend of daily chart also is showing future cloud is bearish. At least for the moment this could bring GBPAUD back again to 1.74 level. Risk level above 1.7645.
Trade well and wisely.

The S&P 500 Has Seen This Pattern BeforeA certain pattern has appeared several times in the S&P 500 over the past year. Now it may have returned.
Consider the falling trendline on this daily chart. Notice how the current price action resembles moments like October 2021, March 2022 and May 2022.
Each time the index pulled back and stabilized. It then pushed against resistance as the Relative Strength Index (RSI) nudged higher. Each of these instances was followed by breakouts and moves to the upside.
Second, the Advance / Decline line has been making higher lows for the last two months.
Third, flip to the weekly chart. SPX just completed its first bullish inside candle since July 2020. That’s another potential sign of the bulls seeking control and volatility easing:
TradeStation has, for decades, advanced the trading industry, providing access to stocks, options, futures and cryptocurrencies. See our Overview for more.
Important Information
TradeStation Securities, Inc., TradeStation Crypto, Inc., and TradeStation Technologies, Inc. are each wholly owned subsidiaries of TradeStation Group, Inc., all operating, and providing products and services, under the TradeStation brand and trademark. You Can Trade, Inc. is also a wholly owned subsidiary of TradeStation Group, Inc., operating under its own brand and trademarks. TradeStation Crypto, Inc. offers to self-directed investors and traders cryptocurrency brokerage services. It is neither licensed with the SEC or the CFTC nor is it a Member of NFA. When applying for, or purchasing, accounts, subscriptions, products, and services, it is important that you know which company you will be dealing with. Please click here for further important information explaining what this means.
This content is for informational and educational purposes only. This is not a recommendation regarding any investment or investment strategy. Any opinions expressed herein are those of the author and do not represent the views or opinions of TradeStation or any of its affiliates.
Investing involves risks. Past performance, whether actual or indicated by historical tests of strategies, is no guarantee of future performance or success. There is a possibility that you may sustain a loss equal to or greater than your entire investment regardless of which asset class you trade (equities, options, futures, or digital assets); therefore, you should not invest or risk money that you cannot afford to lose. Before trading any asset class, first read the relevant risk disclosure statements on the Important Documents page, found here: www.tradestation.com .

Will GBPCHF Back To 1.18-1.19 Area?From 30 mins chart it is indicating bullish momentum for GBPCHF at the moment. For buyer the risk is BELOW 1.1642 (senkou b) at the moment (keep modfying your risk level whenever the senkou b value's change)
Trade wisely. 🙏🙏🙏🙏

Reversal likely to hold up #SPX $SPY $RSP I expect some continuation from this recent rally. The percentage of SPX stocks trading above their 50-day MA is now bouncing from being too far below the lower band of the channel I have defined.
Annotated on the chart are the previous times it significantly breached the lower band.
MACD histogram turning green with MACD line curling up for a cross. RSI bounced and has some momentum. Next test at 50.
Bar some terrible news from Ukraine or Taiwan, we should see some of this momentum carry the market higher. For how long? Unclear. I would like to see $RSP start to outperform $SPY to signify broad strength opposed to a few names carrying the entire index (not sustainable or healthy).


EurUsd Another Low Tested Before Rise?15 mins chart is indicating probably eurusd will fall again. The risk is above 1.0181 (senkou b).
Trade well. Trade wisely. 🙏🙏🙏

Resurrection for BTC?As we can see h4 chart is indicating bullish momentum for BTC. The end for the dowtrend? At the moment the chart is telling us it is uptrend movement. Risk area is below the lowest cloud of the running candle (below senkou a).
Trade well. Trade wisely. 🙏🙏🙏

U Turn For GBPUSD TO 1.21/1.22 Level ?30 mins chart is saying very possible U turn for GBPUSD. Future kumo is bullish. Tenkan, kijun both are indicating bullish momentum currently after GBPUSD was smashed hard recently. Risk area always the lowest cloud (in this case is BELOW senkou A (I mark as "risk area")).
Trade well. Trade wisely. 🙏🙏🙏

Short Sell For GbpAud?It is indicating another bearish mode for cross against aud. It is GbpAud this time. Risk area is ABOVE senkou A.
Trade well. Trade wisely. 🙏🙏🙏

EurAud Continues To Correct Lower?15 mins chart is indicating bearish mode for EURAUD. possibly we'll see lower price from now. I also marked the risk area. It is always the highest kumo (cloud) for the running candle.
Trade well. Trade wisely. 🙏🙏🙏

Abother short term buy for us30Possibly good chance to buy short term for usd 30 based on 15 mins chart. Pay attention to the risk area.
Trade well. Trade wisely. 🙏🙏🙏

4H Accumulation flat Price has reacted to the loss of momentum on the 4H. This can still bounce to a lower high but the top may already be in

Exxon Pulled Back. Now It’s BouncingEnergy, energy, energy: It’s been the manta of 2022, so let’s take a look at Exxon Mobil.
Earlier this month, the oil-and-gas giant hit triple digits for the first time in almost eight years. As noted at the time , prices were extended and a pulled back sharply. And now they’re bouncing.
The main pattern on this chart is the falling trendline along the highs during the slide. XOM closed above that resistance Monday and continued its rebound yesterday.
Next you have $89.49, a high in April 2019. It offered resistance again in February, but turned into support in May. Interestingly, this was almost exactly the stock’s bottom last week.
Third, prices rose after testing the 100-day simple moving average (SMA) for the first time since December. That may indicate the longer-term uptrend remains in effect.
Finally, notice how stochastics are turning up after hitting the most oversold condition since last August.
TradeStation has, for decades, advanced the trading industry, providing access to stocks, options, futures and cryptocurrencies. See our Overview for more.
Important Information
TradeStation Securities, Inc., TradeStation Crypto, Inc., and TradeStation Technologies, Inc. are each wholly owned subsidiaries of TradeStation Group, Inc., all operating, and providing products and services, under the TradeStation brand and trademark. You Can Trade, Inc. is also a wholly owned subsidiary of TradeStation Group, Inc., operating under its own brand and trademarks. TradeStation Crypto, Inc. offers to self-directed investors and traders cryptocurrency brokerage services. It is neither licensed with the SEC or the CFTC nor is it a Member of NFA. When applying for, or purchasing, accounts, subscriptions, products, and services, it is important that you know which company you will be dealing with. Please click here for further important information explaining what this means.
This content is for informational and educational purposes only. This is not a recommendation regarding any investment or investment strategy. Any opinions expressed herein are those of the author and do not represent the views or opinions of TradeStation or any of its affiliates.
Investing involves risks. Past performance, whether actual or indicated by historical tests of strategies, is no guarantee of future performance or success. There is a possibility that you may sustain a loss equal to or greater than your entire investment regardless of which asset class you trade (equities, options, futures, or digital assets); therefore, you should not invest or risk money that you cannot afford to lose. Before trading any asset class, first read the relevant risk disclosure statements on the Important Documents page, found here: www.tradestation.com .

CLS: ShortSlow stochastic bearish divergence
Stop loss: R298.29
Take profit: R285.03
Risk/Reward: 3.7
*No.1 Manage your Risk*

LTCUSD: ShortWill price respect the trend line?
Stop loss: 56.39
Take profit: 43.67
R/R: 3
*No.1 Manage your RISK*

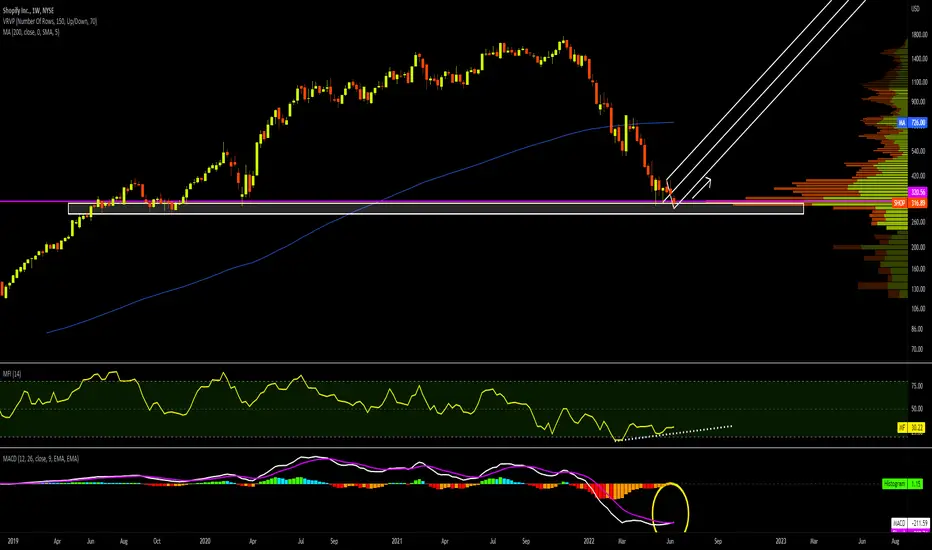
Long ShopifyNYSE:SHOP
Shopify dumped to a major support level.
Weekly MACD crossing up, Weekly MFI showing bullish divergence.
10/1 stock split coming on June 29th.
See AMZN prior to June 6th split. (27% rally)
I'm anticipating SHOP rallies here. (Perhaps to low $400s or $470)
I'm going long tomorrow on the market open.
I hope to hold the position until price exits the fork.
I'll be watching for this on daily and lower timeframes.
Is Nvidia Rolling Over?Nvidia had a sharp countertrend rally two weeks ago, but now the chip giant may be rolling over.
Prices jumped over $183 on May 27. They remained above that level and started making lower highs on June 2. That kind of descending triangle is a potential bearish continuation pattern, which was broken to the downside yesterday.
Second, this month’s high was slightly lower than May’s. That’s consistent with a downtrend.
Next, stochastics reached an overbought condition on the last bounce. That could also make traders think its near-term trajectory is lower.
NVDA additionally slipped back under its 21-day exponential moving average (EMA), which may indicate its short-term trend is turning bearish again.
TradeStation has, for decades, advanced the trading industry, providing access to stocks, options, futures and cryptocurrencies. See our Overview for more.
Important Information
TradeStation Securities, Inc., TradeStation Crypto, Inc., and TradeStation Technologies, Inc. are each wholly owned subsidiaries of TradeStation Group, Inc., all operating, and providing products and services, under the TradeStation brand and trademark. You Can Trade, Inc. is also a wholly owned subsidiary of TradeStation Group, Inc., operating under its own brand and trademarks. TradeStation Crypto, Inc. offers to self-directed investors and traders cryptocurrency brokerage services. It is neither licensed with the SEC or the CFTC nor is it a Member of NFA. When applying for, or purchasing, accounts, subscriptions, products, and services, it is important that you know which company you will be dealing with. Please click here for further important information explaining what this means.
This content is for informational and educational purposes only. This is not a recommendation regarding any investment or investment strategy. Any opinions expressed herein are those of the author and do not represent the views or opinions of TradeStation or any of its affiliates.
Investing involves risks. Past performance, whether actual or indicated by historical tests of strategies, is no guarantee of future performance or success. There is a possibility that you may sustain a loss equal to or greater than your entire investment regardless of which asset class you trade (equities, options, futures, or digital assets); therefore, you should not invest or risk money that you cannot afford to lose. Before trading any asset class, first read the relevant risk disclosure statements on the Important Documents page, found here: www.tradestation.com .
