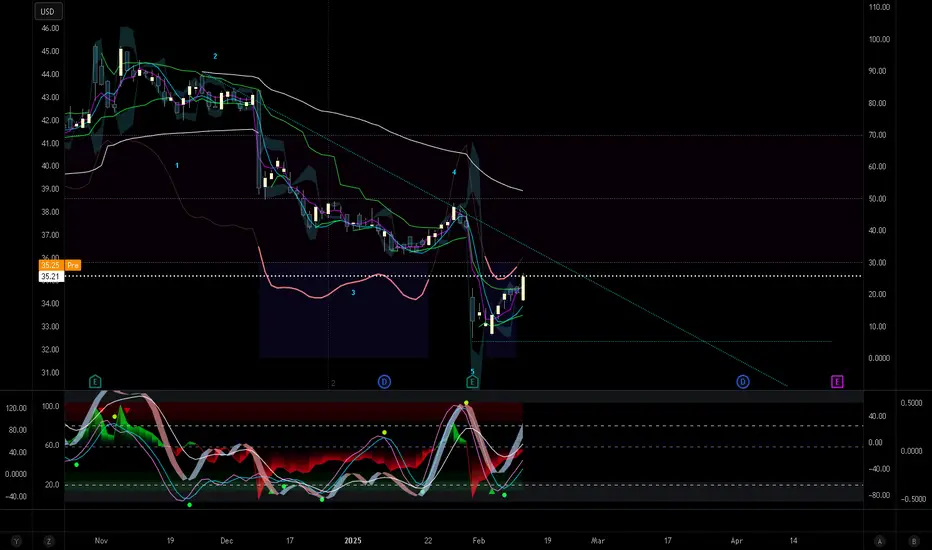
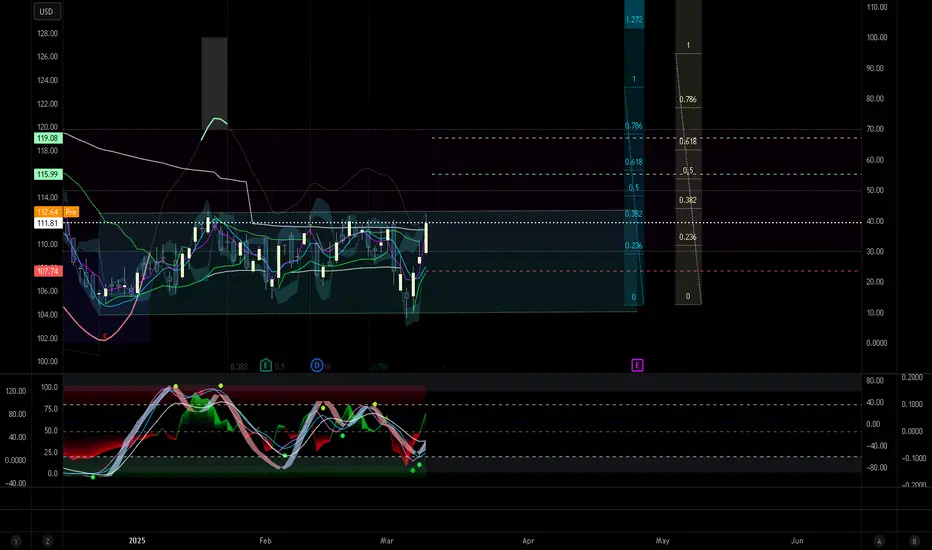
UPS About To Break Support. UPSVery slow and not confident move up on the bullish side cancelled by strong bearish candles. Indicators below show ripe fruit for bears' picking. All three are singing in unison. This may be a start of a new Elliott zigzag.
Centered Oscillators

Head and Shoulder on Bearish Pfizer. PFEIndeed, it is. Price action, stochastics and VZO are supportive. We look to break triangle support on the diagonal line, which is the commonest of the two.

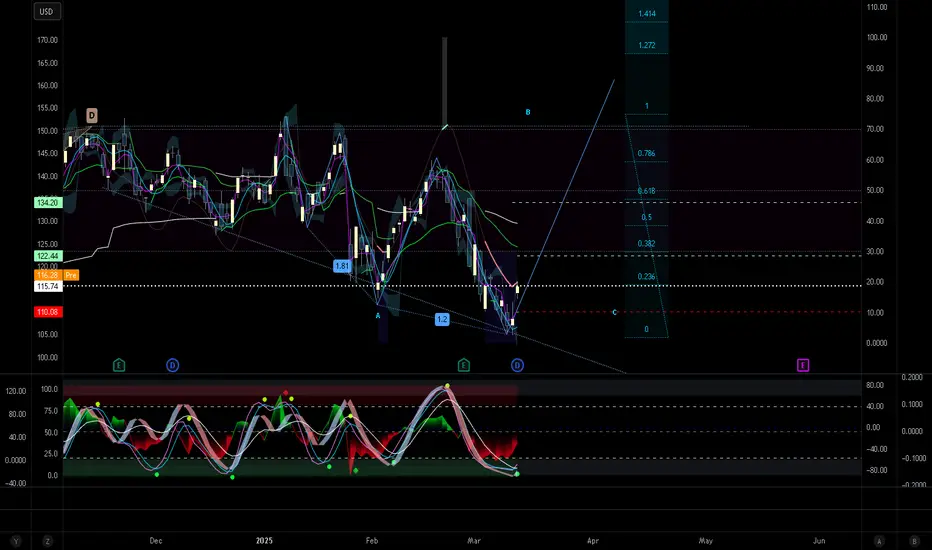
Pivoting Drop on Netflix. NFLXLast short idea was profitable for us, and I think this is a time for a pivot now. Price action is king. The drop down looked like ABC of a larger zigzag A wave, so now B which may be quite protracted. Fib goals here are for illustration purposes, as I recommend you never keep your goals stationary but use an adaptive indicator or indicator pair to exit.

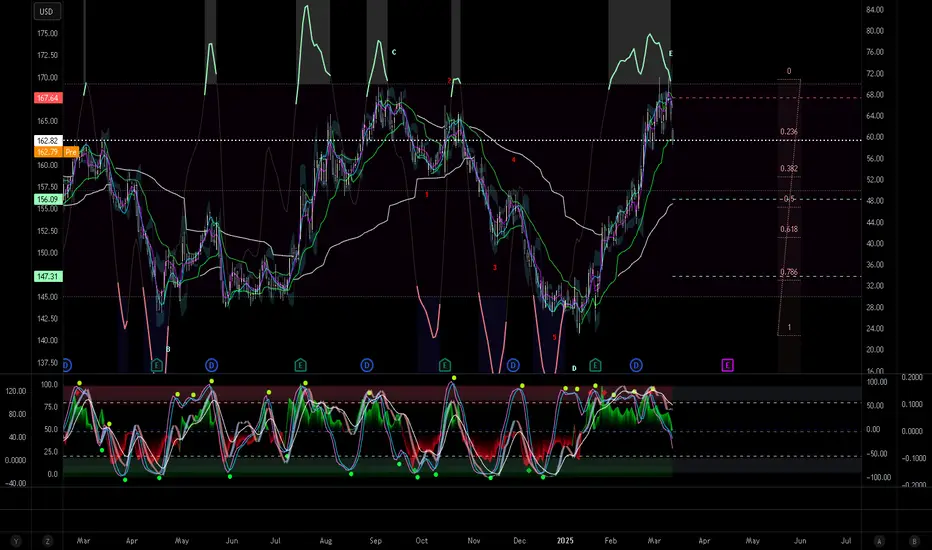
Johnson and Johnson Falling Off a Cliff. JNJA much larger ABCDE formation is complete, not pivoting back to gravity. There is confirmation with MIDAS cross of price action with supporting of RSX exiting OBOS area and VZO/Stoch duo being bearish divergent for some time now. The incoming stream could be a tumultous C Wave impulse to the bears, if Elliott is to be believed.
Reversal To The Long on Meta Platforms. METAThe previous ides on short was very profitable and I believe that we are facing a local reversal here based on price action and volatility , stochastic indicators below. This is a within one candlestick set up, so relatively risky. And yet most pivot setups are.

Take Two on Nvidia Pivot Play. NVDAThe setup stopped out last time with acceptable losses. It is time to try the markets, probability and harmonics once again. This time the indicators below are in alignment also
Stocks May Be OversoldThe S&P 500 has been falling swiftly, but it may be considered oversold.
The first pattern on today’s chart is Wilder’s Relative Strength Index (RSI) in the lower study. RSI slipped below 30 for the first time since October 2023. That could make some traders think it’s due for a potential bounce.
Next, the middle study includes our MA Distance custom script. It shows price dropped the furthest below its 50-day simple moving average (SMA) since October 2022. That may also suggest it’s experienced a healthy pullback.
Third is July 5’s last price of 5567, which was the first weekly close in the second half of 2024. It became resistance in early August and support in two subsequent weeks. SPX held that level again yesterday, so it may be reemerging as a meaningful area.
If the index manages to stabilize here and rebound, how high might the bounce go? Traders could potentially look to the price zone between January 13's low of 5773 and the March 4 low of 5733. It’s also near the 200-day SMA.
Investors with a longer-term view may expect further volatility given the sharpness of the recent drop and the uncertainty caused by tariffs. That may prompt them to eye a deeper low around 5402, where SPX held in early September before breaking out to new highs.
TradeStation has, for decades, advanced the trading industry, providing access to stocks, options and futures. If you're born to trade, we could be for you. See our Overview for more.
Past performance, whether actual or indicated by historical tests of strategies, is no guarantee of future performance or success. There is a possibility that you may sustain a loss equal to or greater than your entire investment regardless of which asset class you trade (equities, options or futures); therefore, you should not invest or risk money that you cannot afford to lose. Online trading is not suitable for all investors. View the document titled Characteristics and Risks of Standardized Options at www.TradeStation.com . Before trading any asset class, customers must read the relevant risk disclosure statements on www.TradeStation.com . System access and trade placement and execution may be delayed or fail due to market volatility and volume, quote delays, system and software errors, Internet traffic, outages and other factors.
Securities and futures trading is offered to self-directed customers by TradeStation Securities, Inc., a broker-dealer registered with the Securities and Exchange Commission and a futures commission merchant licensed with the Commodity Futures Trading Commission). TradeStation Securities is a member of the Financial Industry Regulatory Authority, the National Futures Association, and a number of exchanges.
TradeStation Securities, Inc. and TradeStation Technologies, Inc. are each wholly owned subsidiaries of TradeStation Group, Inc., both operating, and providing products and services, under the TradeStation brand and trademark. When applying for, or purchasing, accounts, subscriptions, products and services, it is important that you know which company you will be dealing with. Visit www.TradeStation.com for further important information explaining what this means.

Double Top on AliBaba. BABAYes, and overbought for along time now out of OBOS with bearish price action. Lagging indicators are still catching up as they do with most pivot takes, but if wrong stop losses act within one or two candle sticks.

Pivot Confirmed on Cisco. CSCODown we go. Clear tops consolidation pattern post major Elliott impulse to the upside. Fifth Wave impulse in green, now MIDAS break sharp bearish engulfing candle. Lower indicators unreliable from barbwire trading. vWAP indicative of trend reversal.
Exit Tight Trading Range on Exxon. XOMTight trading ranges are always tough, as they cause indicators to constantly throw off false signals. There is no way to know which signals will be false. Taking a chance on this one nonetheless. Three soldier candlestick pattern that breaks MIDAS curve and crossings on VZO+offset and Ehlers StochRSI. BB%PCT also crossed zero line. vWAP/US duo in alignment and supportive. It is uncommon to see all the stars lineup like that.
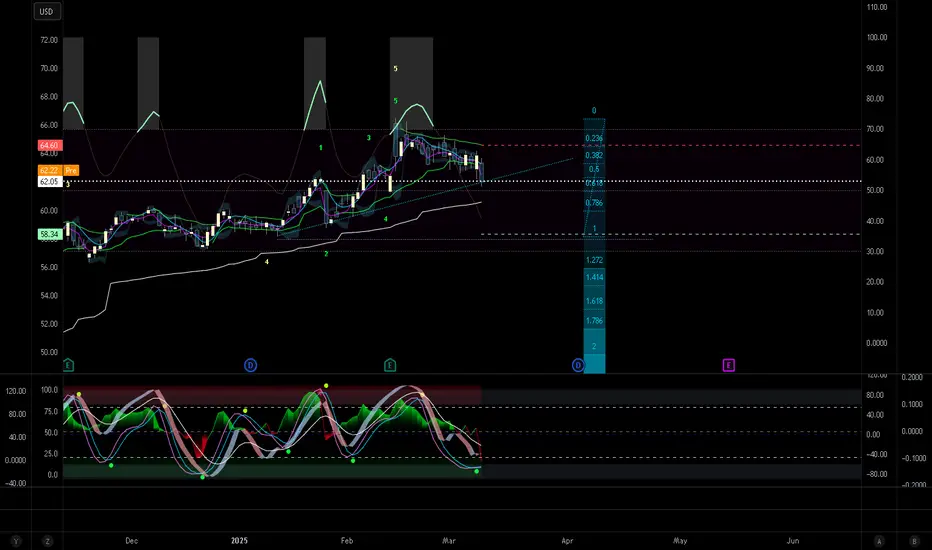
Philip Morris Hit The Ceiling. PMOur last game take on PM centering on a bullish butterfly gave us profits on that very healthy looking impulse up. Now, it is time to come back to reality for this stock. RSX wise - out of OBOS territory, while crossing the MIDAS line. vWAP/US show gradient of trend and are resistant and in alignment. The technicals below have been divergent for a very long time, an indication that a correction has been long overdue.

AB=CD on Chevron. CVXEarly bounce off support now, full steam ahead to the upside , crossing vWAP and US in the second last candle. Now MIDAS crossed. Below oscillators have or are about to turn bullish, reflective of the upgoing candlesticks. This is an AB=CD as far as I'm concerned and Kennedy channeling for stationary goals in any parallelogram structure applies.

Goldman Pulls BackGoldman Sachs hit a new high two weeks ago, and some traders may see opportunities in its latest pullback.
The first pattern on today’s chart is the November high around $613. The Wall Street giant is apparently stabilizing at that level. Has old resistance become new support?
Second, stochastics have dipped to an oversold condition.
Third, GS gapped higher after its last earnings report on January 15. That may reflect strong fundamentals.
Finally, GS is trying to hold its 50-day simple moving average (SMA). The 100-day is also rising from below. Both of those patterns may be consistent with a bullish uptrend.
TradeStation has, for decades, advanced the trading industry, providing access to stocks, options and futures. If you're born to trade, we could be for you. See our Overview for more.
Past performance, whether actual or indicated by historical tests of strategies, is no guarantee of future performance or success. There is a possibility that you may sustain a loss equal to or greater than your entire investment regardless of which asset class you trade (equities, options or futures); therefore, you should not invest or risk money that you cannot afford to lose. Online trading is not suitable for all investors. View the document titled Characteristics and Risks of Standardized Options at www.TradeStation.com . Before trading any asset class, customers must read the relevant risk disclosure statements on www.TradeStation.com . System access and trade placement and execution may be delayed or fail due to market volatility and volume, quote delays, system and software errors, Internet traffic, outages and other factors.
Securities and futures trading is offered to self-directed customers by TradeStation Securities, Inc., a broker-dealer registered with the Securities and Exchange Commission and a futures commission merchant licensed with the Commodity Futures Trading Commission). TradeStation Securities is a member of the Financial Industry Regulatory Authority, the National Futures Association, and a number of exchanges.
TradeStation Securities, Inc. and TradeStation Technologies, Inc. are each wholly owned subsidiaries of TradeStation Group, Inc., both operating, and providing products and services, under the TradeStation brand and trademark. When applying for, or purchasing, accounts, subscriptions, products and services, it is important that you know which company you will be dealing with. Visit www.TradeStation.com for further important information explaining what this means.

Zerebro autonomous AI system to 15x ??On the above 16hr chart price action has corrected 96%. A number of reasons now exist to be bullish. They include:
1) Price action and RSI resistance breakouts.
2) Trend reversal.
3) Regular bullish divergence. 9 oscillators print positive divergence with price action.
4) Falling wedge forecasts 2000% move to 70 cents.
Is it possible price action continues correcting? Sure.
Is it probable? No.
Ww

Nucor May Be StallingNucor has trended lower since April, and some traders may expect another push to the downside.
The first pattern on today’s chart is the November 6 gap after Donald Trump was reelected U.S. President. The steelmaker failed to hold that bounce and proceeded to a new 52-week low by early January. It then rebounded and may have made a lower high.
Next, prices are stalling at a low from October 2023 where NUE bounced several times in late 2024. Has old support become new resistance?
Third, the 50-day simple moving average (SMA) is below the 100-day SMA. Both are under the 200-day SMA. That may be consistent with a longer-term downtrend.
Finally, MACD just turned negative.
TradeStation has, for decades, advanced the trading industry, providing access to stocks, options and futures. If you're born to trade, we could be for you. See our Overview for more.
Past performance, whether actual or indicated by historical tests of strategies, is no guarantee of future performance or success. There is a possibility that you may sustain a loss equal to or greater than your entire investment regardless of which asset class you trade (equities, options or futures); therefore, you should not invest or risk money that you cannot afford to lose. Online trading is not suitable for all investors. View the document titled Characteristics and Risks of Standardized Options at www.TradeStation.com . Before trading any asset class, customers must read the relevant risk disclosure statements on www.TradeStation.com . System access and trade placement and execution may be delayed or fail due to market volatility and volume, quote delays, system and software errors, Internet traffic, outages and other factors.
Securities and futures trading is offered to self-directed customers by TradeStation Securities, Inc., a broker-dealer registered with the Securities and Exchange Commission and a futures commission merchant licensed with the Commodity Futures Trading Commission). TradeStation Securities is a member of the Financial Industry Regulatory Authority, the National Futures Association, and a number of exchanges.
TradeStation Securities, Inc. and TradeStation Technologies, Inc. are each wholly owned subsidiaries of TradeStation Group, Inc., both operating, and providing products and services, under the TradeStation brand and trademark. When applying for, or purchasing, accounts, subscriptions, products and services, it is important that you know which company you will be dealing with. Visit www.TradeStation.com for further important information explaining what this means.


Learn more about how the Professionals Trade Stocks.This lesson is about TWAP vs VWAP order types, Indicators that reveal reversals before price moves. You will learn about Dark Pool candle patterns, Professional traders setups and how to determine with a high degree of probability what direction the stock price will take in the near term.
Learning about why certain candlesticks and indicator patterns reveal who is in control of price helps you select the best stocks to trade with the high probability of excellent profits.
Within every chart, there are patterns and indications that tell you what is most likely to occur in price action next for the near term. This is based on recognizing which professional market participant group has taken control of price.
Also the time of day that each market participant group seizes control of price and why that happens.

ABOUT EURUSDMy option about EURUSD Is more bullish so that zone is good and strong support,if the price comes to that zone it can pullback

Continuing Correction Arista Net. ANETGoing off the technical picture, there is a general alignment from at least 5 different perspectives. The indicators I use look at the market from may different ways, deriving data from volumes, volatility, stochastics, momentum and simple stats like sigma deviations on the previous. Many cases do not offer a discernible Elliott count or a harmonic, but these are very useful when they are discernible.

Fail to Breakout on Schwab. SCHWThere is probably a discernable Jurik RSX divergence on a higher time chart, as there is one VZO on this 12 hourly. And it would make sense. A good spot for entry here, as MIDAS line cross on the background of price action superior cross of vWAP and US lines. More technicality below- there is a cross of zero line on BB %PCT, and both Ehlers Stochastic RSI and VZO with offset are truly bearish. We might bounce at diagonal trendline painted in blue below.
Salesforce May Be OversoldSalesforce broke out in November. Now, after a period of consolidation, some traders may see potential for more upside in the software giant.
The first pattern on today’s chart is the March 2024 high of $318.71. CRM probed that level after the election and again in January. Prices have returned to it this week. Will old resistance become new support?
Second, the 100-day simple moving average (SMA) crossed above the 200-day SMA in late November and has approached the stock from below. Those signals may be consistent with a new uptrend that has potential for continuation.
Third, stochastics have dipped to an oversold condition. Investors may now watch for a crossover to signal a potential turn.
Finally, earnings are due after the closing bell on February 26.
TradeStation has, for decades, advanced the trading industry, providing access to stocks, options and futures. If you're born to trade, we could be for you. See our Overview for more.
Past performance, whether actual or indicated by historical tests of strategies, is no guarantee of future performance or success. There is a possibility that you may sustain a loss equal to or greater than your entire investment regardless of which asset class you trade (equities, options or futures); therefore, you should not invest or risk money that you cannot afford to lose. Online trading is not suitable for all investors. View the document titled Characteristics and Risks of Standardized Options at www.TradeStation.com . Before trading any asset class, customers must read the relevant risk disclosure statements on www.TradeStation.com . System access and trade placement and execution may be delayed or fail due to market volatility and volume, quote delays, system and software errors, Internet traffic, outages and other factors.
Securities and futures trading is offered to self-directed customers by TradeStation Securities, Inc., a broker-dealer registered with the Securities and Exchange Commission and a futures commission merchant licensed with the Commodity Futures Trading Commission). TradeStation Securities is a member of the Financial Industry Regulatory Authority, the National Futures Association, and a number of exchanges.
TradeStation Securities, Inc. and TradeStation Technologies, Inc. are each wholly owned subsidiaries of TradeStation Group, Inc., both operating, and providing products and services, under the TradeStation brand and trademark. When applying for, or purchasing, accounts, subscriptions, products and services, it is important that you know which company you will be dealing with. Visit www.TradeStation.com for further important information explaining what this means.

Can Rainbow MG3 Secure in the CME Trading Competition's Top 10?
Can Rainbow MG3 Secure a Spot in the CME Trading Competition's Top 10?
I've joined the CME trading competition 13 days late, but that hasn't stopped me from making an impact. After just two days of trading Bitcoin and Gold, my account is already up 6%, placing me in the top 14% out of nearly 50,000 traders.
The top 10 traders in the competition—many of whom are pro traders—have already racked up over $1 million in profits, making them part of the elite top 5%. The gap between them and the rest of the field is significant.
With 16 days left, my goal is to break into the top 10. I'm relying on the Rainbow MG3 indicator as my primary tool. The question is: Can Rainbow MG3 help me achieve this?
🚀 Follow my journey as I put this strategy to the test!

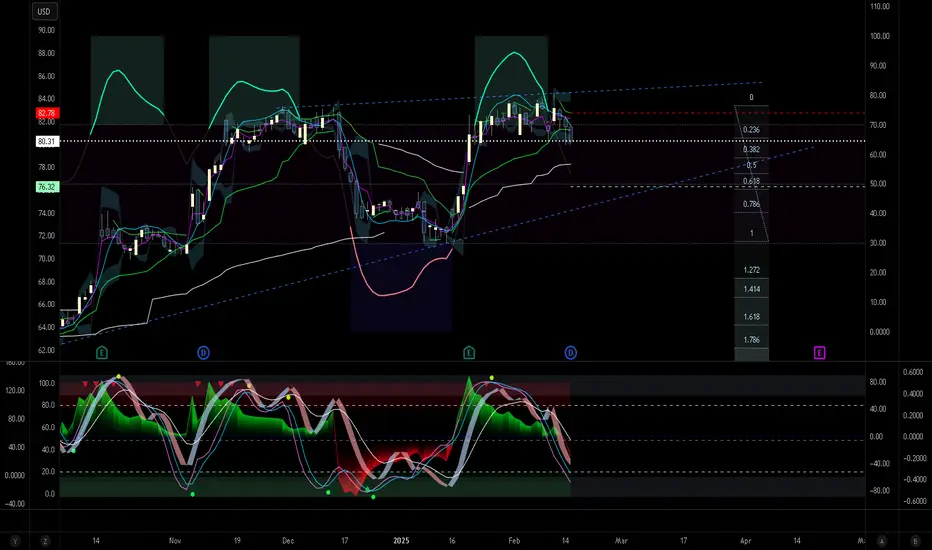
Bullish for Comcast. CMCSAWe finished a downward 5 wave Elliott impulse, with reversal being proven as far as we are concerned. The indicators are generally bullish, bullish divergent in tandem and pivoted. Good luck and manage your risk!