BTCUSD Daily Fib extensions. CCI tlb. Getting ahead of myselfHead and Shoulders target marked on chart is below the fib retracement tagged last week. 13 CCI is turning up but it may be temporary. For a real upmove, After any divergence, normally we need a retest of low, then a move of 13 CCI above -100. However, should we get a lower new low, we have to start over looking for Longsm looking first for divergence in next price/time cycle, then a retet of low, then a crossing of 13 CCI up through -100. Or, for an easier but solid Long signal, When I see 100 CCI turn and get above -100, that will be a clear signal for upmove.
This post isn't ment to be predictive, but for helping to think of just a few of many possibilities ahead, to help stay observant and nimble
Centered Oscillators


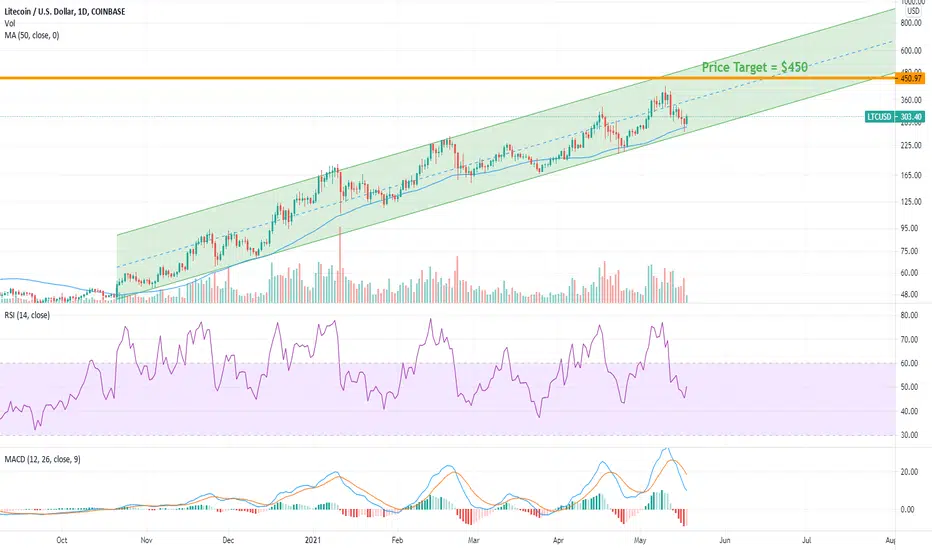
LTC back on the upswing to a new ATHIt has been a rocky week for LTC as it has moved down a good 30% from reaching its ATH. This is to be expected though in the crypto markets and nothing to really worry about considering we are still in a bull market.
LTC has been trading inside a nice upward moving channel since October of last year all while mostly staying above the 50 day MA. The RSI has been making higher lows and the volume has been, on average, a lot higher since the end of March. Barring some FUD Elon tweets that could cause a temporary price dip, or a major BTC move, I see don't see a lot of reasons that LTC will not continue to rise based on the cart.
I would like to see the MACD cross above the signal line on the daily chart. This is really the only bearish sign on this chart. Perhaps even this is going to change soon because, at the time of writing, the histogram seems to have turned towards increasing.
This might not be the fasted play ever, but I think it is reasonable to say that LTC will be above its old ATH and at $450 in the next couple of weeks.
_______________________________________________________
Thank you for reading, please like, follow, and comment! And don't forget to checkout my indicator guides below. More coming soon!
Trade at your own risk.

Stochastic heat map analysisJust read the chart. Sorry I dont like typing on here. Not a financial advisor.

Bitcoin - RSI DIVERGENCEThere is an RSI divergence on DAILY chart since a moment. This gives a high chance that the bulls need a rest.
The 12345 wave formation also seems to be ended.
An ABC correction wave has started to form, we expecting wave C to fall lower than the A wave.
Trade safe.

APD repeating yearly pattern, golden cross into bull run??Hi. In this 1D chart I've plotted out the price increase of 2019 and 2020, marked their golden crosses in the first halves of the year and placed the resistance line from 2020 that the current golden cross could indicate will result in the price breaking through and rising past it during this year.
Keep in mind that the fundamentals of APD are also very good.
Thank you. Please if you have any thoughts or comments do leave them below and I would gladly discuss or adjust my interpretations and methods.
This does not constitute financial advice.
Any prices, even if explicitly stated, are presented with intent to discuss the symbol and potential interpretations.
Any trades shown or mentioned are examples and neither recommendations or mandates.

BTC AFTER BRAEK OUT OF CHANNELNow that Bitcoin has lost its support channel and completed the pullback, we expect more to fall, at least to the second range, but whales are still the main decision maker, which means that the first scenario can happen. What do you think?

EUR turns its directionAs you see, EUR has formed a rising wedge along with two divergences in MACD and RSI.
Also there is a contracting triangle in RSI.
So you can make a good profit!

EGLD up to $300EGLD has been trading in the same channel since February. Good new for us is that this is an ascending channel. Additionally we have testing the middle of the channel multiple times over the last three months and each time we have been rejected. This is not that big of a deal since a move back to the middle of the channel from our current price is a 60% increase in ELGD's price.
Other bullish signals include the MACD crossing the signal line, as well as the fact that the price has stayed over the 50 day MA for the last week. I would however like to see more volume.
A stop loss would be if EGLD closes the day under the channel
Have fun, trade at your own risk.

Sell scalpPresented is a 1 hr chart sell analysis
We currently see an immediate pivot at key resistance 0.70900. If this bar closes out with little retracement we have first confirmation of a reversal.
We can rely on indicators to detect pullbacks. We are seeing RSI trying to breach 50 while SRSI is making its reversal point. MACD and SIGNAL are setting up for a cross back down.
We can enter if this bar closes below 0.70600. Take profit at next key support of 0.70200.
Please comment with thoughts and ideas. Thank you.

Bitcoin MACD signalsPossible Bitcoin Movement based off MACD trend, this could be the massive reversal here. Option 2 it blows through to a new high...


BTC Weekly chart - 100k Bitcoin or 17.5k?Some thoughts on the BTC weekly chart and the 2 basic indicators RSI and MACD
Can fundamentals beat technicals?

CROSSING! 2-YEAR BEAR MACDWe have a MACD crossing on the monthly time frame. After two-years of bear we move into the bull. I'm looking to hold until 2022.
Looking to take profits over the $3.00 range.
Who know?
Good luck.
*Not financial advice*

PYPL PAY PALEarning prevision is high for Q1
5 May,
Unusual Calls Volume on the go
Without fixed strike (Reuters)
Not sure but the chart to me look like excellent momentum,
Financial will outperform those days
due to Yields and Dollar moves
Only for informative purpose, this is not an inversion advice.
take advice for a profesional, i ´m not by any means.
Charlie

HNT about to break its ATHHNT has been trading in the same upward channel for all of 2021. It bounced off its lower trend line a week ago and has recovered. It is currently meeting resistance at its previous ATH daily close at $18.50. I expect it to close well above this today and to continue its breakout. MACD is looking good and it seems that HNT is going to $30 in the next couple of weeks. If everything in the market stays bullish over May my price target is at $42; a price that is well within the channel after mid-May.
Stop loss should be set to a daily close under the trend line. 3:1 risk/reward if it goes to $30 or under $15 (in the very short term).
Have fun, trade at your own risk.

BTC Weekly RSI / MACD AnalysisAnalysis of BTC price using RSI and MACD indicators showing weakending strength since the start of the year. Bearish divergence has plauged BTC for several months how much will the influence BTC price in the coming week during the current pull back

BTC Weekly Analysis using RSI and MACDA K.I.S.S. (Keep It Simple Stupid) approach the Bitcoin weekly analysis using MACD and RSI indicators

BTC will rise up. it will be more than $ 55k in next few daysEach time Bitcoin had a sharp downtrend, it applied a tighter uptrend. Also, long bearish shadows indicate that the price trend will soon rise.
The shortening of the MACD oscillator also indicates a sharp uptrend.
The Ichimoku cloud will also turn red in the next day or two. In the red cloud there will be a rising trend.
I hope that in the next few days, the price of bitcoin will rise to 55 thousand dollars and even more.

IF YOU HAVE JUST SAVE ITIN LONG TERM IT WILL RISE.GOOD FUNDAMENTAL GOOD TECHNICAL SO WHAT ELSE DO YOU WANT?!

Beware: Bitcoin show weakness!!! The trend go to reversalAt the moment, looking in Daily timeframe, Bitcoin it's turn bearish in H12 timeframe, but if you look the smal timeframe like H4, it's turn bearish and we see an simetric triangle, but looking more in H12 timeframe, this candlestick it's a bearish signal. Right now, I will going to sell my altcoins and Bitcoin as I know htat if Bitcoin drop, Ethereum, Chainlink, Cardano, XRP, EOS, Tezos and Litecoin drop too.
s3.tradingview.com
In Daily timeframe it's still bearish sentiment as MACD show higher low in the indicator, as we see in H12 timeframe too. So, I have a forecast that Bitcoin can to go back to $45,000 USD. The $45,000 USD level it's very important to support by long term, as Bitcoin continue up. This week, this movement was surprise for us as Bitcoin doesn't have success to make support above of $60,000 USD, maybe I thinking that was that Bitcoin it's overbought, and correction it's neccesary for the health asset.
s3.tradingview.com
This it's the panoramic in 3 Daily timeframe
s3.tradingview.com
And looking the weekly timeframe, it's look bearish, maybe in these weeks, Bitcoin show a consolidation during the past weeks. And then, I hope this movement to $45,000 USD level.
Guys, altcoins and Bitcoin may to reversal the trend, be carefull to trade.

DIGUSDDodge in an ascending triangle in one-hour timeframe - RSI indicates triangle - after breaking the pink line target
