Bitcoin(BTC/USD) Daily Chart Analysis For Week of Oct 6, 2023Technical Analysis and Outlook:
As stated in the Bitcoin Daily Chart Analysis for the Week of September 29, the upward trend continued throughout the week's trading. Presently, the cryptocurrency is prepping for a surge towards Inner Coin Rally 29300, which will be followed by a decline to 28000.
Macroeconomic Analysis And Trading Ideas

Bitcoin(BTC/USD) Daily Chart Analysis For Week of Sep 29, 2023Technical Analysis and Outlook:
Sliding down from Mean Res 27200 was this week's trading order. Following the rebound from the newly created Mean Sup 26200 and completed Inner Coin Dip 26000, the upside move is ongoing. Nevertheless, there is also a chance that the market may fall to Mean Support 26500 before resuming its upside movement.

Why we’re watching the Bond/Equity Volatility
With the action-packed week of global central bank meetings for September now behind us, we believe it's an appropriate time to review where we stand. The current phase, in our view, can be aptly summarized by the words of Huw Pill, the Bank of England’s Chief Economist: a ‘Table Mountain’ scenario rather than a ‘Matterhorn.’ Recent announcements have positioned the Swiss National Bank, the Bank of England, and the Federal Reserve as adopting a pause stance. Meanwhile, the ECB suggests that it is in the final stages of its hiking program, and Sweden’s Riksbank has just executed its final hike. While we remain slightly skeptical that these hikes may indeed be the final ones, let's entertain this thought and examine what transpires during periods of a defined pause.
Defined pause periods raise alerts for us, as highlighted in our previous piece on US Equities. In that article, we pointed out the impact of a Fed pause, as it has often preceded periods of equity drawdowns. This pattern becomes even more evident when we consider other variables like shifts in the dollar and interest rates.
Looking at the S&P 500 index —in 2000 and 2006—where a clear pause was observed, significant equity drawdowns followed thereafter.
Furthermore, the 10-Year, 2-Year, and 3-Month yields have just reached their highest levels since October 2007, June 2007, and January 2001, respectively. These yields mark the highest nominal interest rates seen in decades across the interest rate curve.
More significantly, this shift has brought real yields back to positive levels, something investors haven't seen for a while, all while the yield curve inverts to unprecedented levels. All of these factors have spill-over effects on investors accustomed to decades of low real interest rates.
Another observation worth noting is that the ratio of Bond to Equity volatility has proven to be a reliable indicator for predicting the next market regime. For instance, during the 2008 period, a break in this ratio was followed by significant moves lower in the market.
A similar phenomenon was observed in 2019, where a sharp break in the ratio of MOVE to VIX preceded the market's next downturn. What captures our interest now is a recent, significant break in this ratio, reinforcing our bearish outlook on equities.
In terms of daily charts, the recent gap down places the index at a precarious juncture as it grapples with both a sharp break of the 100-day moving average and trend support. Compared to the last two instances when the index broke lower, the current RSI stands at even lower levels. Adding to this, only 18% of S&P 500 stocks currently trade above their 50-day moving average.
Given the breakdown in the MOVE/VIX ratio, the global pause in interest rate policy, and supporting technical indicators, we are inclined to maintain a bearish stance on US equities. We can express this view via a short position on the CME E-mini S&P 500 Futures at the current level of 4347, with the take profit at 3800 and stop at 4500. Each 0.25 point move in the E-MINI S&P500 index Futures is equal to $12.5. We can also express this same view with the CME Micro E-mini S&P 500 Index. With each 0.25 point move equating to $1.25, its smaller tick size compared to the standard contract offers greater flexibility in position-building or averaging your entries.
The charts above were generated using CME’s Real-Time data available on TradingView. Inspirante Trading Solutions is subscribed to both TradingView Premium and CME Real-time Market Data which allows us to identify trading set-ups in real-time and express our market opinions. If you have futures in your trading portfolio, you can check out on CME Group data plans available that suit your trading needs www.tradingview.com
Disclaimer:
The contents in this Idea are intended for information purpose only and do not constitute investment recommendation or advice. Nor are they used to promote any specific products or services. They serve as an integral part of a case study to demonstrate fundamental concepts in risk management under given market scenarios. A full version of the disclaimer is available in our profile description.
Reference:
www.cmegroup.com
www.cmegroup.com

Bitcoin(BTC/USD) Daily Chart Analysis For Week of Sep 22, 2023Technical Analysis and Outlook:
This week, Bitcoin did a backflip and created a new Mean Res 27200, with a substantial drop-down anticipation to our strategic Mean Sup 25100 and Outer Coin Dip 24200, as we anticipate a retest of the Mean Res 27200.

LIQUIDITY MATTERS! Global liquidity vs #BitcoinLook at how the bullish green arrows and bearish red arrows show how global liquidity correlates HEAVILY with the direction of Bitcoin. T
You don't have to be a genius to see how beautiful this correlation is.
And how sensitive #BTC is to excess capital in the system.
As a risk on asset
When ppl have easy money to gamble with , a portion of that ends up in the #Crypto markets.
Currently you can see how aggressive the withdrawal of liquidity is across the globe
In the USA, EU, China & Japan.

Central-Bank-Digital-CurrenciesHello,
Welcome to this analysis about Central-Bank-Digital-Currencies in which I will explore the ongoing process by central banks to generate Digital-Currencies that replicate the individual Fiat-Currency, its characteristics, its possible manifestations, and its differences to the classical cryptocurrencies we all know as Bitcoin or Ethereum created in the beginning.
Since Cryptocurrency was invented by the esteemed Satoshi Nakamoto publishing the open-source white-paper about Bitcoin as a completely decentralized Peer-To-Peer Digital-Currency which supply is limited and is generated through mining and the Proof-Of-Work concept many other decentralized cryptocurrencies emerged such as Ethereum or Litecoin that approved a secure and stable way of payment solutions operating within the determined blockchains. This completely new form of currency and the digital interface was watched by critics as well as supporters and a hype created with cryptocurrency enthusiasts accelerating the innovation process in cryptocurrency. On the other side, banks and governments watched the Cryptocurrency development not always with a non-critical eye, and especially in this process central banks took a greater study into the technology and the idea came into the foreground for digital currencies held and issued by the central banks that should replicate the real fiat-money which is printed by the central banks and distributed through commercial banks. The digital currencies that should be issued by the central banks became the name CBDC (Central-Bank-Digital-Currency) and today many countries' central banks started to work on pilot projects and prototypes to launch the digital replicate of fiat money, in some countries they are already launched and implemented in the economy.
__
- Comparing The Classical Concept Of Cryptocurrency To The Central Bank Concept Of Digital-Currency
The main characteristics of the classical cryptocurrency like invented in 2009 are that it is decentralized and that its supply is limited while the bitcoins are generated through the mining process there can be no more than 21 Million Bitcoins at all that defines the value of Bitcoin as miners need to improve the technological alignments to rightly mine the Bitcoins and come up with a mining-revenue to keep the process ongoing. On the other side, there is fiat money which is printed in the central bank printing press and which supply can be multiplied by will especially in times of crisis as it was in the last year the money supply increased exponentially by the central banks, this has an inflationary character and comes up with many other issues as in times of crisis the central banks need to print always more and more money as before. Now the fiat money printed by the central banks is issued to commercial banks with zero interests at this time and from there is supplied to the merchants and persons who taking up credits and which account money is held in a bank account as a "digital back-up" by the printed fiat money, the tendency with this bank account money is also to be multiplied by the banks and moved around in the system to be taken for credits so that one holds money in an account while it is used for the other individual's credit. Now as the central banks working on the digital currencies to substitute the fiat money in circulation the biggest difference is that its supply is not limited like it is in Bitcoin or many other cryptocurrencies, as the central bank fiat money can be printed further this is also the case with the upcoming central-bank-digital-currencies. Besides that the central-bank-digital-currencies are not decentral because they are issued by a central authority like the central bank, the system on which the CBDC is settled can be decentral however on a broader scale it is still centralized by the individual central bank, there is still a difference if the CBDC model is indirect, direct or hybrid nevertheless it is always centralized as the intern blockchain is created by the certain central bank. Another factor is also privacy as the public Bitcoin blockchain does not store any private user information, depending on the model with a CBDC this can be very different as there is indeed the possibility that private user information is stored in the blockchain by the central bank. Taking all these assumptions into consideration it comes to the conclusion that CBDCs aren't the same as the classical cryptocurrencies in common sense, it is rather a system that replaces the fiat money with digital money and gives the central bank much better opportunities to handle, store and track it with a faster network and potential storage of data.
__
- Examining Models On How Central-Bank-Digital-Currencies Can Function
With the gained assumptions it is important to note that there are different type models under which CBDCs can operate. Every model has its own characteristics and handles money circulation in an altered cycle. Besides that, the different models can have very different effects on the economy and especially on sectors like the banking industry or payment solution providers. Furthermore, the types on how payment data and information is stored differ within these models. It is highly necessary to recognize these concepts to assume how the CBDC infrastructure affects the economical landscape.
The Indirect CBDC Model
Within this model, the central bank keeps track records of wholesale accounts by the commercial bank as an intermediary between the central bank and the persons or merchants. The consumer as the person or merchant has a claim with the intermediary as the commercial bank and handles payments with the commercial bank. In this case, the intermediary handles all the communication with the consumer as retail clients and its net payment information, sending payment messages and storing the data. It would be a similar model to the actual credit distribution that exists with credits given by the central banks to commercial banks and from these distributed to the persons or merchants.
The Direct CBDC Model
The Direct CBDC Model functions differently from the Indirect one as the payments are handled directly between the central banks and the persons or merchants, in this case, receives, stores, and processes the information given by the consumer. This model is much more functional and practicable for the central bank as the commercial banks as intermediaries aren't necessary for the gateway. A full-scale implementation of this model will cause a higher decrease in commercial banks at all of which the sector already struggles, the model would further this process. The model would also set the central bank as the central authority handling all the payment relevant mechanisms with the consumer as persons or merchants.
The Hybrid CBDC Model
In this model the Persons or Merchants have a direct claim on the CBDC with the central bank while an intermediary, in this case, a PSP (Payment-Service-Provider) keeps track of the payments information and handles direct payments, the PSP in this case does not need to be a bank essentially. It is also integrated within that when technical issues come up with failures in the system that the central bank can handle direct payments with the consumers and restore retail balances. This system offers more flexibility at the cost of a more complex infrastructure to operate for the central bank. Besides that, it has a similar negative effect on the banks like the direct model as banks arent necessarily needed for the payment communication.
__
It is not unlikely that the development of Central-Bank-Digital-Currencies will keep going within the upcoming times, therefore it is necessary to elevate how these diverging models can affect the actual economy. As many countries moving on with the projects and prosecution of CBDCs these will be realized in a more fulfilled way with a high possibility and it will be an important question on central banks will govern these CBDCs as they aren't decentralized like the cryptocurrency roots they can not be held as a direct comparison to these and are indeed a fiat money replication in digital terms, it will definitely open new doors for the central-banks money policy however what it has for effects on consumers as peoples or merchants is a serious examination.
Thank you, for watching, it was important for me to scrutinize the significance of Central-Bank-Digital-Currencies and elevate a perception to this omnipresent topic.
In this manner what do you have for an opinion of Central-Bank-Digital-Currencies implementation? Let us know in the comments below.
Information provided is only educational and should not be used to take action in the markets.

Bitcoin(BTC/USD) Daily Chart Analysis For Week of Sep 15, 2023Technical Analysis and Outlook:
This week, the price action of Bitcoin made a strong recovery after reaching our Mean Support 25100. It is possible that it may continue to rise towards our Mean Resistance 27800. However, it may drop down to our strategic Outer Coin Dip 24200, as we anticipate a retest of the Mean Support 25100.

Bitcoin(BTC/USD) Daily Chart Analysis For Week of Sep 8, 2023Technical Analysis and Outlook:
This week, Bitcoin churned at our completed Outer Coin Dip 25600, indicating bias to move downwards crucial support targets: Mean Sup 25100 and 24300 along with Next Outer Coin Dip 24200. Pivotal Rebound Retest is also in play.

Bitcoin(BTC/USD) Daily Chart Analysis For Week of Sep 1, 2023Technical Analysis and Outlook:
On August 23, Bitcoin made a significant recovery and reached our Mean Resistance level. The next target on the downward movement is the Outer Coin Dip, which is at 24200. There is a strong chance that the Mean Resistance 27800 level may be retested.

Expecting an intervention from the Central Bank of JapanLook at those beautiful channels for $FX:USDJPY. Last year, we had a strong uptrend from 115 to 151, and the central bank had to intervene strongly. We see another uptrend this year as well. There is a fight between the market and the central bank. BoJ had to make a move when the price reached to 144. But it seems market wants to push higher this. We potentially see another intervention around 148.
Disclaimer – WhaleGambit. Please be reminded – you alone are responsible for your trading – both gains and losses. There is a very high degree of risk involved in trading. The technical analysis , like all indicators, strategies, columns, articles and other features accessible on/though this site is for informational purposes only and should not be construed as investment advice by you. Your use of the technical analysis , as would also your use of all mentioned indicators, strategies, columns, articles and all other features, is entirely at your own risk and it is your sole responsibility to evaluate the accuracy, completeness and usefulness (including suitability) of the information. You should assess the risk of any trade with your financial adviser and make your own independent decision(s) regarding any tradable products which may be the subject matter of the technical analysis or any of the said indicators, strategies, columns, articles and all other features.

Bitcoin(BTC/USD) Daily Chart Analysis For Week of August 25,2023Technical Analysis and Outlook:
This week, Bitcoin surpassed two key targets: Outer Coin Dip 28200 and 26900, indicating that the next Outer Coin Dip 24200 is likely, with the Mean Res 26650 serving as a temporary support for price action. However, an extension to Mean Res 27800 should not be dismissed.

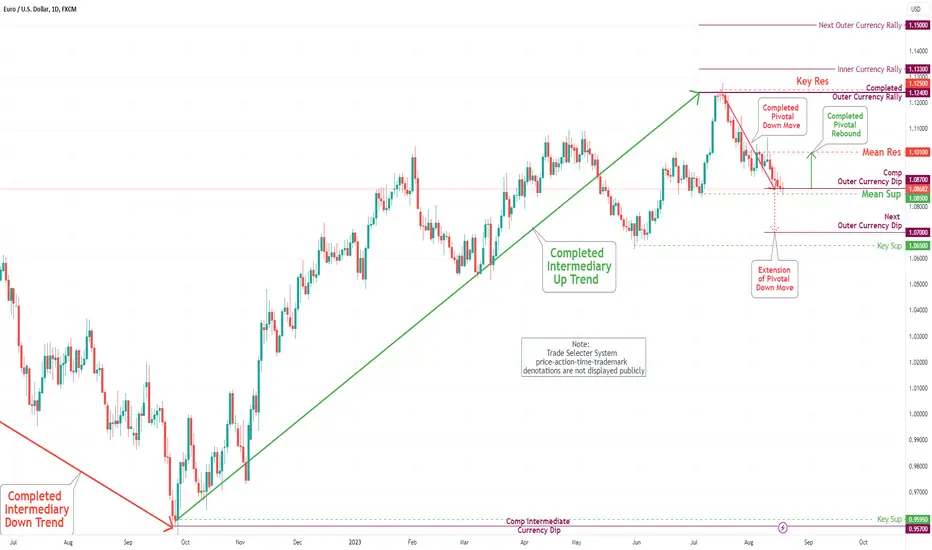
EUR/USD Daily Chart Analysis For Week of August 18, 2023Technical Analysis and Outlook:
The price action of the Eurodollar remained downwards as projected by Trade Selecter by completing our major target Outer Currency Dip 1.087. However, a strong rebound is possible with Mean Res 1.101 as a target. On the downside, price action might take us to the Next Outer Currency Dip of 1.070.
Intervention - Fatal Flaw in Capital Markets?In the news today is the Japanese Yen, as it approaches critical resistance at the 146 level. The market has steadily been making new highs on the daily level this year, having just exceeded the July high. As seen in the chart above the market has moved quickly through levels of resistance, now breaking a downtrend line from the major Oct 22' high. See below a quarterly chart, the Yen is making new highs at significant timescales, possibly threatening a breakout as the historical ceiling is much higher than the modern perception might lead one to believe.
The need for intervention around the current price level has become a concern for the global investment community, since in September and October the Bank of Japan proceeded with heavy selling of US Dollars to support their currency at the 145 level. This was last reached in 1998, at the height of the infamous Nikkei bubble as equity market growth produced historic inflation. However there was no need, or thought for intervention then which begs the question of why it is seen as a necessity now.
This is largely due to the degradation of credit markets around the globe, and the inability of central banks to produce productive inflation, meaning real economic growth. In 1998 the yield for a 10 year bond was around 2%, whereas outside the US negative interest rates have become common. See below as the yield for 10-year Japanese Government bonds has pushed against, and exceeded the imposed 'ceiling' since moving from negative interest rates.
The attempts by central banks to "stimulate" investment by lowering bond yields has in fact had the opposite effect, since investors will naturally seek the highest return on investment .
In the modern economyc, bonds and government credit are treated as cash, so as central banks buy sovereign debt they are absorbing and concentrating capital which historically has circulated globally across currency and asset classes. This has the effect of domestically creating deflation, as capital is less free to circulate, but internationally will create inflation as (in this case) investors are not buying Yen-denominated debt , leading to the Yen losing strength in FX-markets.
So the level at which intervention is required to support currencies is slowly being drawn lower, as the Bank of Japan burns the candle at both ends. It is NOT possible in globalised, open markets to engage in both bond market and FX market intervention as one or the other must reflect the degradation of economic conditions. This issue cannot be resolved domestically as international capital dictates growth, and lowering yields is not a means to attract investment.
The Bank of Japan has resolved to loosen control on bond markets, by allowing 10- year yields to settle on a market-determined fair price. However, price discovery has not been a relevant dynamic in credit markets for nearly 30 years. With FX already at critical levels, it is important to be wary of volatility as capital flows shift with respect to war, credit and equity bubbles around the world and so on. Europe and China, among others should also be under the radar for engaging in this flawed logic without international support for their currency. So long as the United States, backed by foreign reserves of US dollars, pushes the bill on interest rates this intense pressure will continue to be reflected in global financial markets.

Bitcoin(BTC/USD) Daily Chart Analysis For Week of August 4, 2023Technical Analysis and Outlook:
This week, the price action of the coin remained stagnant between the Outer Coin Dip 28900 and Mean Res 30050 levels. This suggests it might decrease further towards the Outer Coin Dip levels of 28200 and 26900. However, there is also a possibility of a dead-cat rebound towards the Mean Res 30050 level.

Bitcoin(BTC/USD) Daily Chart Analysis For Week of July 28, 2023Technical Analysis and Outlook:
This week, the coin's price action fell below our Mean Support level of 29900, indicating that it may continue to decrease towards the next Outer Coin Dip levels of 28200 and 26900. However, a dead-cat rebound toward the Mean Resistance level of 30050 is not ruled out.

Macro Monday 4 - Global Net Liquidity and SPX500Global Net Liquidity and SPX 500 Comparison
The Global Net Liquidity (“GNL”) indicator provides an overview of how five major central banks liquidity provisions are collectively performing. This allows us to get a sense of whether global money supply is increasing (expansionary) or decreasing (contractionary).
The GNL can provide a general indication of how much liquid funds are available in Global Bank Reserves. When there is increasing liquidity, lending in all forms to the consumer is less burdensome/restrictive for the Banks and thus consumers typically have access to more finance. If GNL is increasing this can indicate that more money is available to be lent by the Banks and spent by the consumer and businesses, and when GNL is contracting it can indicate less money is circulating and less funds are available for consumers and businesses which can negatively affect overall economic performance.
GNL is available by searching for “Global Net Liquidity” in the indicator section on TradingView. Full credit for the GNL indicator goes to Dharmatech who created/copyrighted this specific indicator on TradingView. There are many Global Liquidity Indicators available on TradingView, some have more banks and metrics included, others less, this is just the one of the main indicators focusing on the big five central banks. I fully intend on making my own Global Net Liquidity Indicator which factors in the other forms of liquidity and other Banks for a more accurate indication. Whilst the impact of smaller global liquidity providers/central banks are less impactful, including them might just offer us an edge week to week.
What is included in this GNL:
We add the following:
- Fed Balance sheet (WALCL)
- Japanese Balance sheet (FRED:JPNASSETS) Converted to USD
- Bank of China Balance Sheet (CNCBBS) Converted to USD
- UK Balance Sheet (GBCBBS) Converted to USD
- EU Balance Sheet (ECBASSET) Converted to USD
And we deduct:
- Reverse Repo Market (RRPONTSYD)
- Treasury General Account (WTREGEN)
The Chart
Please acknowledge that this chart idea has built into it a speculative projection that factors in a number of generalized technical and fundamental considerations/reference points. Lets DIG IN!
1. From a TA perspective we are relying heavily on one data period from 2018 – 2020 on the GNL /S&P500 which is not ideal however a similar pattern from this period may be playing out in an amplified way at present for both.
2. From a general fundamental standpoint we draw a correlation to the Great Inflation period (1965 – 1982) but we hone in on the early years from 1966 – 1973 as these early years are similar to the high inflationary period we find ourselves stepping into at present.
3. In both 1 and 2 above the S&P500 went through significant price volatility which in both instances took the form of a megaphone pattern. Megaphone patterns have been showing up a lot in the market recently, Tesla being a case in point. Megaphone patterns are more common in volatile markets and can offer us traders or investors a structural framework to work within.
Considering 1, 2 and 3 above we speculate that we may see a similar large megaphone pattern play out for the S&P500. This is illustrated in a previously shared chart called “A Crazy S&P Idea”. If you check this idea and hit play, you'll see we are currently tracking the 1966 - 1973 Great Inflation Fractal very closely.
In summary:
o In the past, long term GNL Contraction resulted in significant S&P500 Volatility.
o In 2018 a sudden 8 month sharp 10% GNL decline as the S&P500 was continuing to new highs was an advance warning of a subsequent 14% decline in the S&P500. This is expressed on the chart as a Negative divergence.
o A similar Negative Divergence is currently playing out. As noted the last Negative Divergence in 2018 took 8 months to complete. This would be Aug/Sept 2023 as a possible mid-term top under the current scenario after which we could expect a >10% pullback.
It is important to recognise that the timeframes I am projecting and the price action are patterns that may play out as we find ourselves in similar but not identical circumstances. It is important that we recognise that this pattern may not play out at all. A few things are certain though, Global Net Liquidity is contracting, volatility is expected as a result and the rest is looking into the past for similar patterns to help anticipate potential structures as they evolve. One such pattern which seems plausible is the megaphone, however the S&P500 could be forming a parallel channel here or a different pattern altogether. Time will tell.
If all I have done in the above chart is created awareness of GNL and of the current short term negative divergence, I think that is enough. The rest is just possible outcomes with absolutely no guarantees. I also hope that by reviewing the Great Inflationary Periods price action fractal that it can help frame in our minds just how much price volatility could be ahead of us.
On a recent chart I shared which focused on the Yield Curve Inversion the maximum timeframe for a recession to commence once the yield curve first turns back up towards the 0% level is 22 months. The first definitive turn up was in March 2023 suggesting that the maximum window before a recession could potentially start is 22 months from March 2023 which is January 2025. Never has a recession taken longer than that 22 months to occur after the yield curve makes its first turn back up towards the 0% level. For this reason I have included January 2025 as the potential megaphone top. This also coincides with the megaphone fractal pattern from the Great Inflation Period. I am not saying that this is exactly how it will play out but there is some confluence in the timeframes.
I hope you find these charts and their correlations helpful. It will be fascinating to see how these eventually play out.
PUKA

Bitcoin(BTC/USD) Daily Chart Analysis For Week of July 21, 2023Technical Analysis and Outlook:
This week, the coin just churned about our Mean Sup 29900. Any attempt to develop a sustainable upside move is laying on contingency by completing and retesting Mean Sup 28700.

🔥 Bitcoin vs Money Supply: Massive Move On The Horizon?M1 Money Supply (M1SL): "M1 is the money supply that is composed of currency, demand deposits, other liquid deposits—which includes savings deposits. M1 includes the most liquid portions of the money supply because it contains currency and assets that either are or can be quickly converted to cash." - Investopedia
The M1SL amount is important since it tracks the amount of money in an economy that is able to be deployed quickly into the economy. If people have more to spend, they will generally spend more as a result of this.
When we take a look at the $ value of BTC divided by M1SL, the chart has been trading relatively flat since December of 2017. This means that Bitcoin has not gained substantially against the central banks' money printers.
On the other hand, it appears that BTC/M1 has been forming an inverse Head & Shoulders pattern over the last 5.5 years. Assuming this pattern will play out, BTC will continue to gain against M1 and break out of this 5.5 year consolidation pattern. Assuming that M1 will continue to increase (like it always does), this would mean that BTC will see another 2016-2017 scenario in the future where it will see exponential returns and potentially even do a 100x over the next few years.
This scenario is not the most likely scenario to play out, but it's definitely an interesting one. Hope to hear your thoughts in the comments 🙏

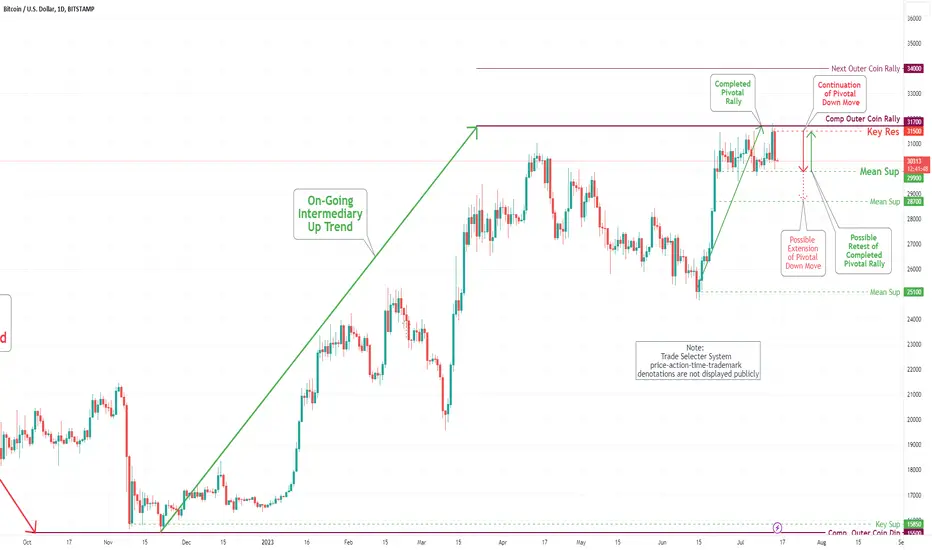
Bitcoin(BTC/USD) Daily Chart Analysis For Week of July 14, 2023Technical Analysis and Outlook:
This week, the coin completed our Outer Coin Rally 31700 and re-traced severely hard to Mean Sup 29900. there's also a chance it will drop significantly to Mean Sup 28700 before recovering. On the upside, the coin might take a swift upward move to retest the completed Outer Coin Rally 31700 and Key Res 31500.
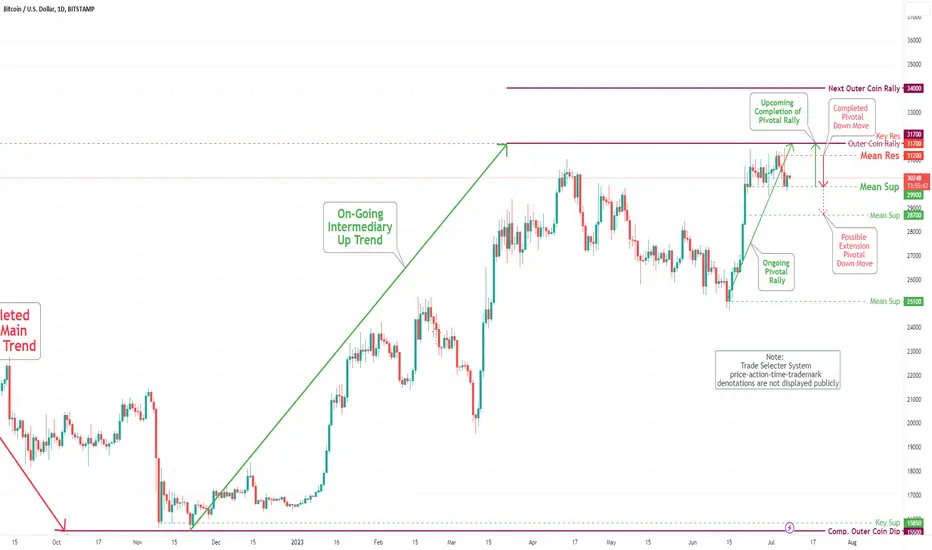
Bitcoin(BTC/USD) Daily Chart Analysis For Week of July 7, 2023Technical Analysis and Outlook:
This week, the coin retested our Mean Sup 29900 and is currently fluctuating unpredictably. The price will likely go up to finish Outer Coin Rally 31700, but there's also a chance it will drop significantly to Mean Sup 28700 before recovering.
BULLISH MOMENTUM! Clear confluence, Read below.
NSE:CENTRALBK
Date: 03/07/2023
---
Disclaimer: This is just my observation, please do not consider this idea as financial advise. It is important that each individual should due his/her own due diligence before taking a financial decision, more so in the money markets!
---
The uptrend seen in the chart is reflected in the RSI. This indicates a good upward momentum. This is by using RSI as a momentum gauge rather than a "overbought and oversold" gauge.
The trend has bullish breakthrough in the triangle pattern.
After the recent bullish change of character, we can see that today as of me writing this idea, there is a bullish break of structure. This provides a strong chance of bullish momentum in the coming days.
The price has tested the 21 and 50 day SMA's and risen past it in the past few days with stride.
Price is still in the mid discount zone. Decent entry point.
The above points proves a confluence of bullish momentum
Take profit would be taken in reference to previous highs as this would serve as a passive resistance zone.
TAKE PROFIT 1 = 31.2
TAKE PROFIT 2 = 33.4
TAKE PROFIT 3 = 34.5
Advisable not to go beyond as the area is not strongly tested.
Good luck!

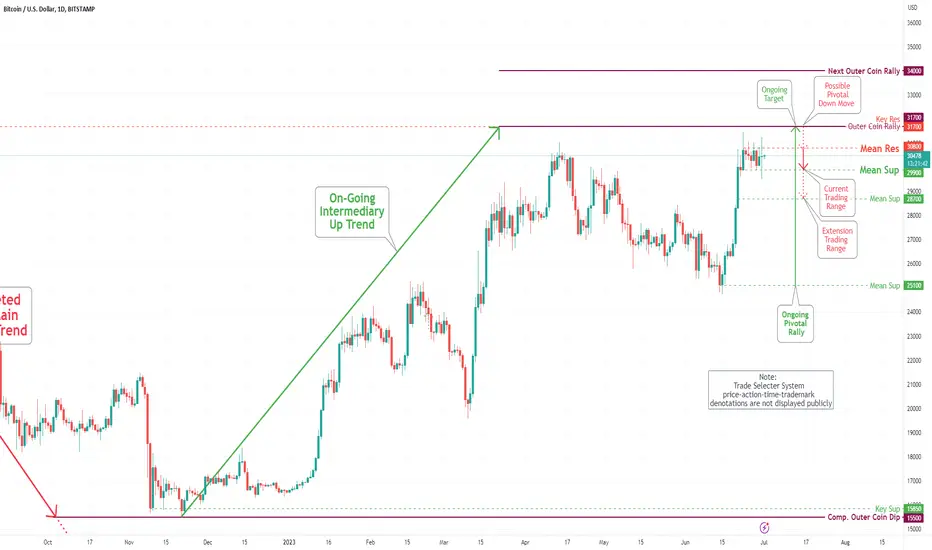
Bitcoin(BTC/USD) Daily Chart Analysis For Week of June 30, 2023Technical Analysis and Outlook:
The coin following the completion of the Inner Coin Rally 30500 is gyrating between the newly created Mean Res 30800 and Mean Sup 29900, suggesting its higher price advancement. The upcoming primary target is Outer Coin Rally 31700, along with Key Res of the same price. We may be experiencing a brief pause before the next Outer Coin rally, 34000, based on the current trend. Alternatively, prices could drop significantly to Mean Sup 28700 before rebounding.
Daily Market Analysis - TUESDAY JUNE 20, 2023Investors Await Central Bank Actions Amid Global Economic Concerns and Uncertainties Prevail
Today events:
USA - Building Permits (May)
USA - FOMC Member Bullard Speaks
USA - Housing Starts (MoM) (May)
USA - FOMC Member Williams Speaks
Eurozone - ECB McCaul Speaks
Eurozone - ECB's De Guindos Speaks
On the evening of Monday, following a public holiday, there was a slight decline in stock futures as investors braced themselves for significant speeches expected from officials of the Federal Reserve (Fed) and members of the Federal Open Market Committee (FOMC) throughout the week. This anticipation added to the prevailing uncertainties and lack of clarity that characterized the previous week.
In the United States, the inflation data was considered acceptable but not extraordinary, prompting the Fed to temporarily halt its actions while projecting multiple interest rate hikes in the future. In contrast, the European Central Bank (ECB) raised interest rates and emphasized the potential for further increases.
Now, all eyes are on the Bank of England (BoE) as it confronts the formidable task of managing the current situation. Despite the efforts of the Monetary Policy Committee (MPC) to maintain control, there exists a looming risk of inflation spiraling out of hand. Among the major economies grappling with the dual objectives of taming inflation and ensuring a smooth economic transition, the United Kingdom appears to be encountering the greatest challenges in effectively attaining these goals.
GBP/USD daily chart
An intriguing observation can be made regarding the GBP/USD currency pair. Despite retracing from its recent peak around $1.28, the pair has still managed to register a notable 3% gain over the past month. Notably, the British pound has also exhibited strength against the euro, appreciating by more than 1.6% during the same period. This is particularly noteworthy when considering the past situation in September, where the pound was nearing parity with the dollar as UK Gilt yields surged. Presently, it is trading close to the $1.30 mark. This suggests that the foreign exchange market does not currently reflect a prevailing perception of an imminent economic disaster for the UK.
In the realm of EUR/USD, Tuesday presents challenges for the currency pair to gain significant momentum. It remains confined within a narrow trading range, with the pair hovering just above the 1.0900 level during the Asian session.
US Dollar Currency Index daily chart
Following its recent decline, the US Dollar (USD) is currently in a phase of recovery. Last Friday, it reached a low that had not been witnessed in over a month. However, the USD has been displaying a gradual strengthening trend for the past three consecutive days. This resurgence of the USD poses a challenge for the EUR/USD currency pair, causing it to retreat to the latest level of 102.55.
EUR/USD daily chart
However, despite the prevailing challenges, the downside for the EUR/USD pair seems to find some support, at least temporarily, thanks to the hawkish stance adopted by the European Central Bank (ECB). The ECB's optimistic outlook serves as a factor that mitigates the potential decline of the pair.
Furthermore, the current subdued sentiment in equity markets works in favor of the US Dollar's role as a safe-haven currency. This situation, in turn, limits the upside potential for the EUR/USD pair. Concerns regarding a potential global economic slowdown, particularly in China, cast a shadow over reports of China contemplating a comprehensive stimulus package to bolster its economy. These worries continue to dampen investor sentiment. Even the recent decision by the People's Bank of China to lower the one-year and five-year Loan Prime Rates (LPRs) on Tuesday fails to alleviate anxieties or provide significant momentum to the major currency pair.
It is noteworthy that the ECB has recently raised interest rates for the eighth consecutive time, propelling them to the highest level witnessed in 22 years. The central bank has also emphasized the necessity of further rate hikes to attain the Eurozone's medium-term inflation target of 2%.
XAU/USD daily chart
In contrast, gold has undergone substantial volatility in the preceding month. Despite the dissemination of recent data and central bank determinations, this precious metal has remained confined within a narrow price range of $1,940 to $1,980, demonstrating minimal signs of breaking out in either direction in the immediate future.
Nevertheless, it is important to recognize that market conditions can swiftly shift. The current week is particularly eventful, as it is characterized by a flurry of central bank interest rate decisions and a multitude of speeches by Federal Reserve officials. These upcoming events have the potential to introduce new dynamics and variables into the financial markets.
