CFD

XAU Update / Cup IdeaJust something I've been looking at as a possible scenario...
Will post a more indepth analysis when we get a short term answer...
On the livestream initially we had shorted 1490s but then flipped long @ 1502 and again @ 1512.
Now we look much higher but lets see what happens here.
Previous analyses:
(38.2% Retrace, weekly chart breakout):
We start targeting 1600's LAST JULY:
We identify the breakout from $1300:
Good luck traders

Gold can Test Weekly Resistance Levels
1W Chart:
Below the week there was little difference between the trend line and resistance, and this did not include a good risk / reward ratio.
I shared ideas about the trend towards gold and precious metal stocks.
But I think it will test the resistance of 1569.4 in a short period of time with the addition of Iran news which are already moving towards resistance.
A long signal on the weekly chart was taken a few weeks ago, but as I said, I waited for the trend line break.
Then an invalid short signal was received, which is due to high volatility.
That's why I don't recommend large transactions, but it has a nice risk / reward ratio because may considered with reasonable small amounts.
It can also open from above at opening.
Parameters :
Risk/Reward Ratio : 1/2.65
Position Size : %1
Stop-Loss: 1545.96 ( Manually taken from 1546.22 )
Target : 1569.4 (1W Resistance Level )
You can look at related ideas to look at my general view of Gold and Global Markets.
Overall I am expecting a more mercantilist financial quarter.
If the air becomes more serene, the industrial metals will take its share.
But now we are in the short-term stop and wait mode for stock markets because of news from Middle East.
Regards.

SPXUSD500Forming a middle section of the pattern to confirm this trend im expecting more downside before we push higher or we might get a double bottom and move up from there we wait for the confirmation !

USOIL, The best place for Sell...The best place for Sell will be under the Historical Key Level 66.60.
I will open my position after the false breakout of that level.
Potential profit will be 3 times bigger than the risk.
Push like if you think this is a useful idea!
Before to trade my ideas make your own analyze.
Write your comments and questions here!
Thanks for your support!

GOLD is close to 5-Months High!The price is close to the Key Level 1557.32.
I will open Sell after the false breakout of that level.
Potential profit will be in 3...5 times bigger than risk.
Push like if you think this is a useful idea!
Before to trade my ideas make your own analyze.
Write your comments and questions here!
Thanks for your support!

Brent Crude: War Drums of ProfitUpdate on our previous analysis. I have reason to believe another black swan event involving US military is immanent. Keep an eye on it..
Not sure of new targets...keep your eyes open
Good luck traders.
PREVIOUS ANALYSIS:

XAUUSD Short Sell we had analysed the gold with harmonic patterns and fibs this time.
we are expecting a bearish move and hit our second TP soon.
be aware of the exact SL what we specified
good luck


GOLD, The correction is possible..The price is near the Support/Resistance Zone and can bounce down to the previous Zone.
I will open Sell after the false breakout.
Potential profit will be 3 times bigger than the risk.
Push like if you think this is a useful idea!
Before to trade my ideas make your own analyze.
Write your comments and questions here!
Thanks for your support!

SP500 (SPY) Be careful.All description on the chart.
Please, don't forget to like and follow.
Thank you.

NIO possible to drop againNIO has formed a rising wedge, failed to go upward it's now falling down, we need to watch carefully if the mobile support will resist, if no is possible we go drop again around 1,72

To success — ask simple questionsHello friends, first of all, you can support this idea and follow simple questions in your trading. This post will help you find your ways in trading.
Before any trade, ask simple questions and make sure you have answers.
Can you afford to lose some amount money? — Accept the risk. Don't fool yourself.
Do you have a strategy for trade? — Plan where you will get profits and where take loss.
Are you in right state of mind? — Make sure you're not biased to something in this trade.
Do you have confidence in your analysis? — Get more knowledge of TA, and what works for specific asset.
Is there any news may coming to impact this trade? — Bad news or even good news could change direction for short-term. Be ready for everything.
Is there any reasons not take this trade? — Well any reasons here, schedule, work, health etc
Is this is a safe trade? — Make sure you are not jumping in trade in FOMo, check yourself and risks.
Stay profitable, this is ArtemCrypto

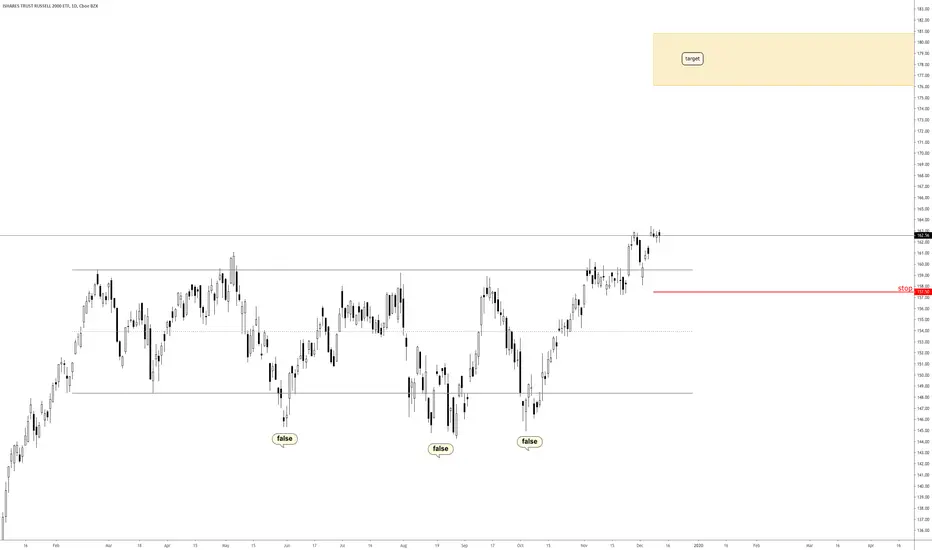
Russell 2000 ETF (IWM) long.All description on the chart.
Please, don't forget to like and follow.
Thank you.
Natural Gas Overview Natural Gas industry finds itself in an odd predicament – total production is still at record levels, and may continue to climb, albeit at a slower and lower rate. At the same time there are widespread financial problems in the industry, particularly for gas-focused companies. One of the big questions regarding production is whether Texas oil drillers can keep gas output growing enough to offset the declines underway in Appalachia.
- Nick Cunningham
Let's start after this current summary.
Natural gas prices continue to be dominated by bears under the trend line.
The risk / reward ratio for the continuation of the bear market is now at 2 levels.
When we look at the graph, we see a bearish wolfe wave formation, but we cannot say that it started because prices above the reference point.
I think over 2.500 - 2,656 area bears will be replaced by bulls. ( 2.656 = Stop-Loss Level )
The current trend line is not a very accelerated and reasonable line, but may be an indicator of excessive pricing.
The temperatures are above the seasonal norms all over the World.
The support-resistance levels to be followed are:
-Support Level : 1.647
-Resistances : 2.5 - 3.05 - 3.9 - 4.527
Summary
I don't see a very valuable risk / reward ratio for opening positions on a weekly basis, but for the downward refraction of the bullish wolfe wave, opening short for lower time periods can be considered.(Breakout Bullish Wolfe 2-4 Reference Trendline )
I can look forward to an opportunity for a clear upward break of the orange trend line and 2.5 resistance, or for long positions over long periods of time below the level 2, ie close to support.
When one of these possibilities comes true, I will share my opinion with another clear judgment.
Best regards.


GOLD, Where can look for entry point?..In my previous video about Gold, I said about the local channel and Buy/Sell opportunity when the price will cross the borders of it.
But if you like to trade inside the channel you can open Sell under the Support/Resistance Zone. Gold can bounce from that zone and from the Trend line also.
Push like if you think this is a useful idea!
Before to trade my ideas make your own analyze.
Write your comments and questions here!
Thanks for your support!

Palladium When Does The Ride Stop?Palladium has had a massive drive up in price. Previously below platinum, it's come into it's own. The market is tightly controlled by a few major players, and possible supply interruptions helping fan the bull flame.
$2000 Rejection most likely profit taking, and an outlook over $2K imminent. I am waiting to take a short position though, as a rally like this has the potential to unwind quickly, and the upside at some point will be capped.
Key points of support sit at
$1835, $1700, then $1600 in the short term.
Will also be watching RSI for a short on any overbought rallys over $2K mark in the next few weeks. Whilst keeping an eye on news of the current supply/demand fundamentals in the case of a continued rally to future gains.

PLATINUM: Metal To Invest In 2019
hey traders,
this year gold was and remains the most advisable precious metal for investment.
while everyone is looking at gold and wants to jump in an overheated market, I want you to have a look at platinum
three major things to know about platinum:
the market is bearish since 2011
the market has reached 2008's low this year
the market has broken above the major falling trendline
we have a great chance to buy platinum on a huge discount.
technically we see a lot of different signals indicating a shift in a market trend
and I would consider platinum to be a good alternative to gold (based on its current prices)
Let me know what you think!:)

NATGAS can start rising from this place...If the price will make a pullback to Buy Zone we can open a Buy position.
It's a huge probability for start rising from that Support Zone near 2.179.
Push like if you think this is a useful idea!
Before to trade my ideas make your own analyze.
Write your comments and questions here!
Thanks for your support!

XAUUSD, Setup: BUY, TF: H4, Trendline StructureOANDA:XAUUSD
PLAN: H4
- SetUp: => BUY
- Structure: Downtrend forming
- Tendency: Upward
- Above support
-> Waiting signal <-
- Buy: Green Area

GER 30 (DAX) is near Selll Zone!We can look for an accurate Sell entry near the Support/Resistance Zone.
The price bounced from it twice.
Potential profit will be in 3...5 times bigger than risk.
Push like if you think this is a useful idea!
Before to trade my ideas make your own analyze.
Write your comments and questions here!
Thanks for your support!

GOLD, How do you like it?!))Look at the local lines on the chart!
Each of them should be considered separately.
It can be an intraday trading strategy:
after a few taps on one side, touch the other and make some move.
Push like if you think this is a useful idea!
Before to trade my ideas make your own analyze.
Write your comments and questions here!
Thanks for your support!
