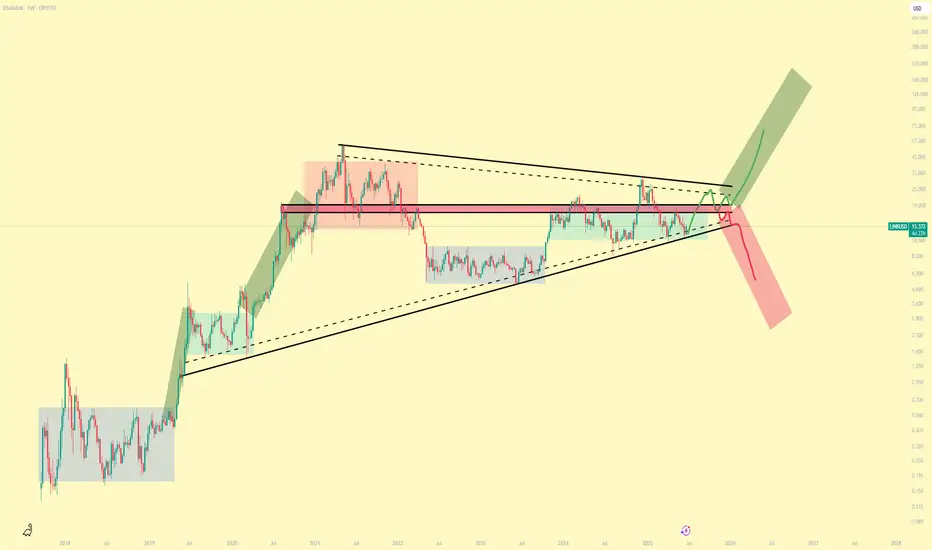
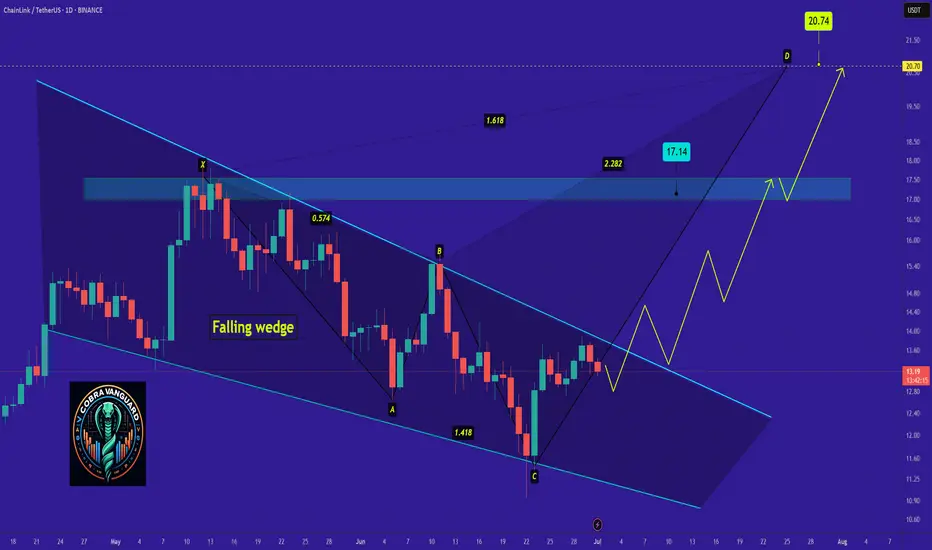
ChainLink · Short-Term Correction (Retrace) · 2025 Bull MarketWe have evidence that ChainLink won't be moving much lower. There are mainly two reasons: 1) There aren't that many sellers and 2) we have strong support. We have an active support range between $14.5 and $15.95. This is the reversal point. Either current prices or this lower range which shows an intersection between two strong moving averages as well as Fib. retracement levels.
The rise between June and July has a stronger slope compared to the one before. The April-May rise was more spread out and so the correction lasts longer. The present one has a stronger slope, it is more steep, and thus a retrace will have a shorter duration because prices will continue growing.
Volume is extremely low on the drop and bearish momentum is not present. There can be one final flush reaching the levels mentioned above or lower on a wick and the market turns. The flush would make everything seen pretty bad and red but the truth is that this would be the end. When the major sell is in, the market turns around and moves the other way.
LINKUSDT is retracing within a bullish bias mid-term. Long-term growth is possible based on the bigger picture.
LINKUSDT is facing an intersection of multiple support zones, if these levels hold, we can see a resumption of the bullish move and prices grow. Each time a retrace is over, the bullish wave that follows will be many times stronger than the previous one until the bull market ends.
We are still looking at bottom prices. The best is yet to come.
Namaste.
Chainlink

8 R setup for ChainlinkBTC is about to flip upwards. This is the chance to take a high-reward trade with an 8:1 risk-to-reward ratio.
Entry: 18.23
Stop-loss: 16.8
Target: 29
Smart Robbery Plan: LINK/USDT Long Setup | Swing/Day Trade Idea🚨CHAINLINK HEIST PLAN 🚨 | LINK/USDT Market Robbery (Thief Trader Style) 💰🔐
🌍 Hola! Bonjour! Hallo! Marhaba! What’s up, Money Makers & Market Robbers?! 🕶️💵
Get ready to raid the LINK/USDT vault with Thief Trader’s high-precision strategy based on 🔥 Technical & Fundamental fusion 🔥.
This is not your regular setup. This is a robbery roadmap. Designed for swing & day traders, and spiced with smart DCA entries, risk control, and a bold vision. Let's get into the game plan before the market alarms go off! 🚓📉📈
🎯 Master Plan – LINK/USDT | Bullish Setup
Entry:
📌 “The vault is open – grab the loot!”
Start entering long anywhere within the nearest price pullback zone. Use 15m to 30m TFs for sniper-style limit entries.
🛠️ Deploy DCA-style multiple limit orders (layered strategy), preferably around recent swing lows or major liquidity zones.
Stop Loss:
🔐 Place SL just below the 4H swing low wick (Currently at $16.50), adjusting for your risk, lot size, and how many limit orders you're stacking.
Take Profit:
🎯 Main TP target: $21.50
⛔ Or bail early if momentum weakens. Your profit, your decision.
⚡️Scalper’s Memo:
Only scalp on the bullish side – stay with the smart money.
Have deep pockets? Jump in now.
On a budget? Join swing traders and follow the full heist plan.
📉 Use trailing SL to secure profits during volatile rallies.
🔍 Fundamental & Sentiment Snapshot:
LINK is gaining bullish traction due to a combo of strong sentiment, favorable macro outlook, and on-chain flows aligning.
📊 Keep eyes on COT reports, intermarket data, and liquidity metrics.
🧠 Sentiment leans bullish while late bears are trapped in the supply zones above.
🛑 Risk & News Management Alert:
🚨 News releases can spike volatility and mess with clean entries.
📵 Avoid placing trades during high-impact events.
📍 Use trailing stop-loss to protect your running profits and preserve capital.
💖Support the Plan, Join the Heist:
Love the trade idea? 💥Hit the BOOST💥 button and show some love to the strategy that lets traders "rob the market" with confidence.
Every like helps build the strongest heist crew on TradingView.
✅ Stay sharp. Stay patient. Stay profitable.
👤 Thief Trader signing out… until the next raid. 🐱👤💰🚀
#LINK #LINKUSDT #CryptoTrading #ThiefTrader #SwingTrade #DayTrade #DCA #BullishSetup #TradingPlan #TA #RobTheMarket #ChainlinkHeist #SmartMoneyMoves

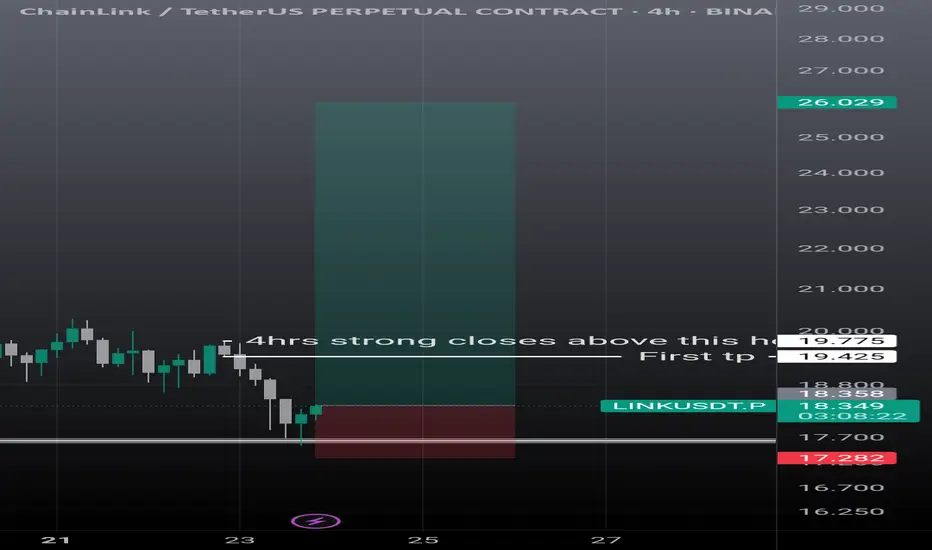
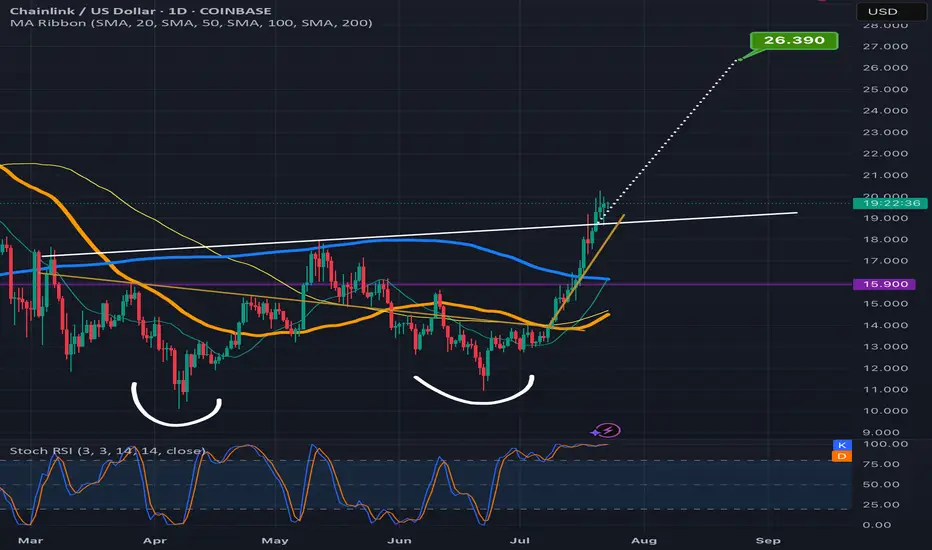
Linkusdt scalp n swing setupLink showing some strong momentum. On 4hrs it can go easily 19.30, then if it breaks strong and closes above the mentioned candle it's next stop is 26$. Must use sl as it can take further correction is it failed to break the mentioned level.
Chainlink climbing the measured move line staircaseLooks like Chanlink is ready to confirm the double bottom breakout here as the past few candles have already started to climb up the measured move line like a staircase.Always possible for a dip back below the neckline at this point but probability slightly favors the readout being validated instead for now. *not financial advice*
LINK to 30$ or more?Hi Padawans,
Hope you’re doing well.
I’m anticipating some good short scalp opportunities around the levels marked in the chart.
Do your own research padawans.
Best regards,
Crypto Obi

The Oracle Singularity: CHAINLINK is Inevitable or Cooked?How many marines are tracking this ascending channel?
How many are watching this Fibonacci time sequence unfold?
How many are following the mirrored bar fractal that might just be a crystal ball into the future?
Today you get all three in one TA. The value here is absurdly high . Even though I offloaded most of my LINK a while back it continues to act like a compass for future macro crypto moves.
You really need to look at the TA to understand what I mean
Now look at this
The deviation in the LINK bar pattern seems to be reaching its conclusion around mid October 2025 and if you’ve seen my last Bitcoin TA you know I’ve been targeting that same mid October 2025 window for a potential BTC top. That’s a serious timeline confluence.
But here's the twist
The main chart projects a $200 LINK by April 2026. If that plays out then I have to entertain the possibility that this cycle extends past my original thesis and that my Bitcoin top call may come in earlier than Chainlink's final move.
If Bitcoin does in fact top in mid October then LINK likely won’t have the legs to hit those upper targets.
Back in 2021 when LINK was trading at a similar price it only took 119 days to reach $50 that would put us at November 2025 for a repeat. Something doesn’t quite add up
Now check the main chart again
This Fibonacci time sequence is liquid gold. It’s nailed major tops and bottoms for years (see the blue circles). Every major move has hit right on time except for the 3.618 in October 2022 which was a rare miss.
But here's the kicker
There’s no Fib time event between October and December 2025. The next ones are in August 2025 and then April 2026
So is LINK trying to tell us the cycle extends into 2026?
Maybe. All I’ll say is this
If the cycle doesn’t extend into 2026 then LINK IS COOKED

Link/BTC When will we see the pump Chainlink has always been one of my favorite cryptos—and pairing it with BTC just makes sense. I have strong faith in this project, and I believe the days when trendline resistance and support hold Chainlink back are numbered. This beast looks ready to break free.
We’re possibly just weeks, maybe even days, away from a breakout of this 4-year falling wedge. Once that happens, I see LINK/BTC teleporting upward—especially as quantitative tightening ends and Jerome Powell stops being a hater. The stars are aligning for Chainlink to soar. With everything going on behind the scenes between swift and Mastercard and the many more I can list I see this being the underdog.

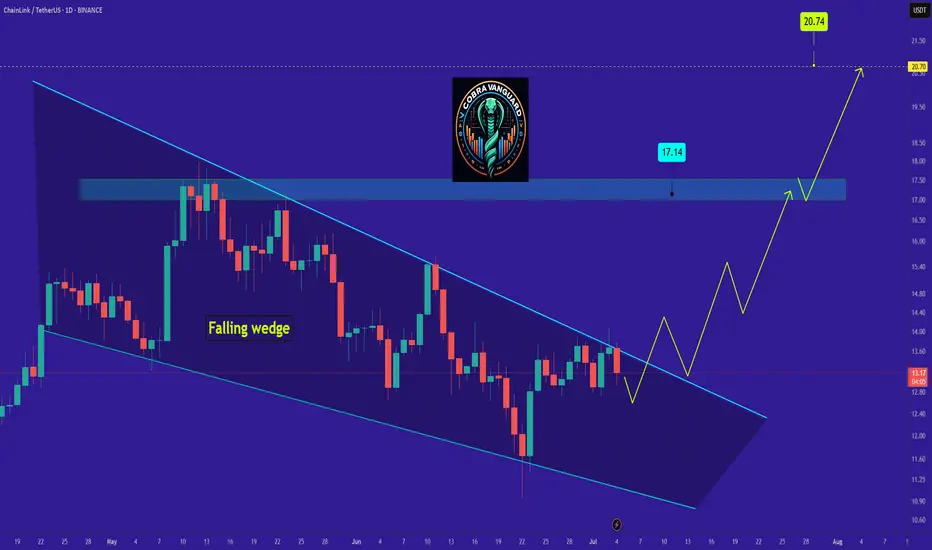
LINK's Situation, A Comprehensive Analysis !!!So if you pay attention to the LINK chart you can see that the price has formed a Ascending wedge which means it is expected to price move as equal as the measured price movement.( AB=CD )
NOTE: wait for break of the WEDGE .
Best regards CobraVanguard.💚
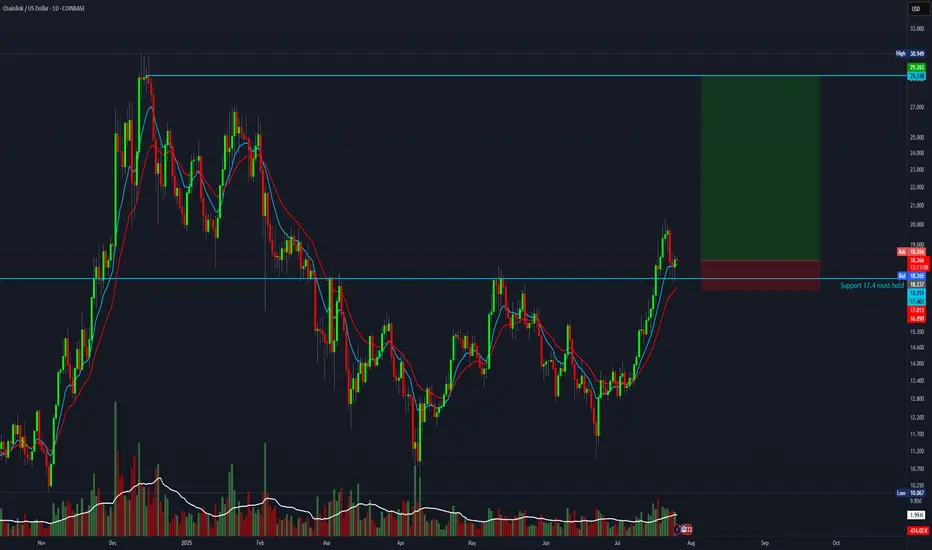
LINK Just Rejected Hard — Is the Rally Already Over?Chainlink exploded straight into multi-month resistance — and instantly got slapped down. First taps often reject, but if price flips this zone into support, it could open the door to $20+. One of the most important levels on the chart.

renderwithme | The unbreakable bond of Chainlink TechnicalBelow is a technical analysis of Chainlink (LINK/USD) based on the provided real-time financial data and general market insights. Please note that cryptocurrency markets are highly volatile, and this analysis is for informational purposes only, not financial advice. Always conduct your own research before making investment decisions.
# Current Price and Market Overview
Current Price: $16.70 USD at the time of posting
24-Hour Trading Volume: Not specified in the provided data, but recent sources indicate significant trading activity, with volumes around $422.74M to $672.42M.
52-Week Range: $3.25 (low) to $10.90 (high)
Previous Day Close: $16.67
chart for your reference

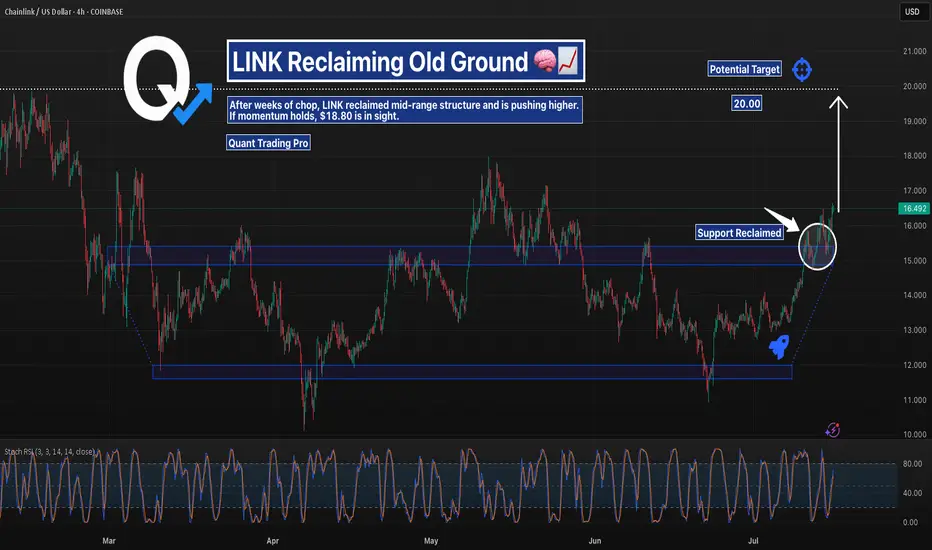
LINKUSD – Mid-Range Reclaim | Push Toward $18-20?Chainlink has reclaimed the mid-range supply zone between $14.50–$15.50 and is now pushing higher.
The structure looks clean with a potential target near $18.80 if bulls maintain strength.
Key support now sits around the breakout zone. Watching for continuation or a failed retest.
#LINKUSD #Chainlink #RangeBreakout #SupportResistance #QuantTradingPro #TradingView
LINK has FINALLY Broken out of a 207D DowntrendReclaimed the .236 Fib 🔥
Volume to confirm ✅
Bullish crossover on the 20 / 50MA
It’s about time!!!
CRYPTOCAP:LINK Marines Unite 🪖

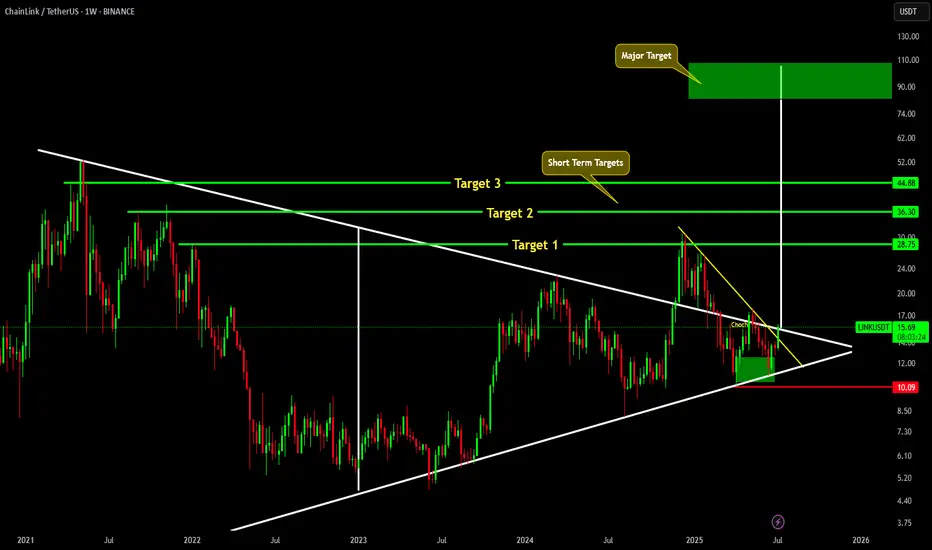
LINK MAJOR MOVE AHEAD !!!CRYPTOCAP:LINK is about to break above major trendline. If it successfully breaks above it, we will see CRYPTOCAP:LINK hitting short term targets of 28, 26 & 44. And Major target for link is around 80-100$.
Chainlink Just Broke Out — Is $30 The Next Stop?After nearly 250 days of compression inside a falling wedge, Chainlink has officially broken out. The chart shows a textbook breakout with clean structure, higher lows, and a confirmed break of structure (BOS). A retest zone between $12.8–$14.0 could offer a “buy the dip” opportunity before any continuation.
With momentum shifting and sentiment improving, bulls have eyes on the $30 target — a prior high and wedge-measured move. This is a breakout you don’t want to ignore.

Chainlink Grows Above MA200, The Path is Clear To $65 (333% PP)Yes LINKUSDT broke a minor consolidation pattern but that's not all. The action this week is happening right above MA200. This level being conquered last week.
Good evening my fellow Cryptocurrency trader, how are you feeling in this wonderful day?
Chainlink is bullish now and has been bullish for months. Bullish doesn't necessarily means rising prices but potential for growth. Bullish happens at the bottom, when prices are low. Chainlink is bullish now and ready to grow.
For some people it might still be too early. "Anything can happen." "The bull market is not confirmed." "Wait for confirmation." "How do you know?"
I know because of the signals coming from the charts. I know based on marketwide action, Bitcoin's halving, the broader cycle, related markets, intuition, experience, astrology and so on. There are so many signals that it is impossible to mention them all. All these signals and systems point to the exact same thing, the same conclusion; Crypto is bullish, Bitcoin is bullish and Chainlink is set to grow next, now.
Now is the time for growth, it cannot go in any other way. Nothing else is possible, we are going up. It is still early. Not early for confirmation or certainty, early because we will have really strong growth.
It is still early because LINKUSDT is set to hit $44 followed by $65 in the coming months.
Just imagine the energy, the feeling, the euphoria, the market sentiment, your portfolio... Just try and visualize the market six months into the future. What do you see?
Maybe it is hard to feel for sure what is going to be like, but you can be certain that prices will increase. If you are holding Crypto, you will be happy with the results.
You deserve everything that will come to you because you were in when others were gone.
You deserve success and profits because you earned it by making the right choice.
You trusted Crypto, you trusted the market and now you will reap the reward.
Thanks a lot for your continued support.
Namaste.

"LINK - Time to buy again!"So if you pay attention to the LINK chart you can see that the price has formed a Ascending wedge which means it is expected to price move as equal as the measured price movement.( AB=CD )
NOTE: wait for break of the WEDGE .
Best regards CobraVanguard.💚
Link long - zoom in on weekly closeWe are approaching a breakout.
Maybe this week's close is the trigger that all the bulls (and altcoins) have been waiting for.
Generally speaking, I don't like trading Chainlink. Although if we see a weekly close just above 14.2, above the 20 MA, I think it could be a good investment entry.
I think Chainlink will be one of the utility coins that completely explodes before retail has time to react. A good weekly close is something that smart money probably would appreciate. If you think long-term, I think Chainlink is in a good position with good upside without any immediate big risk.

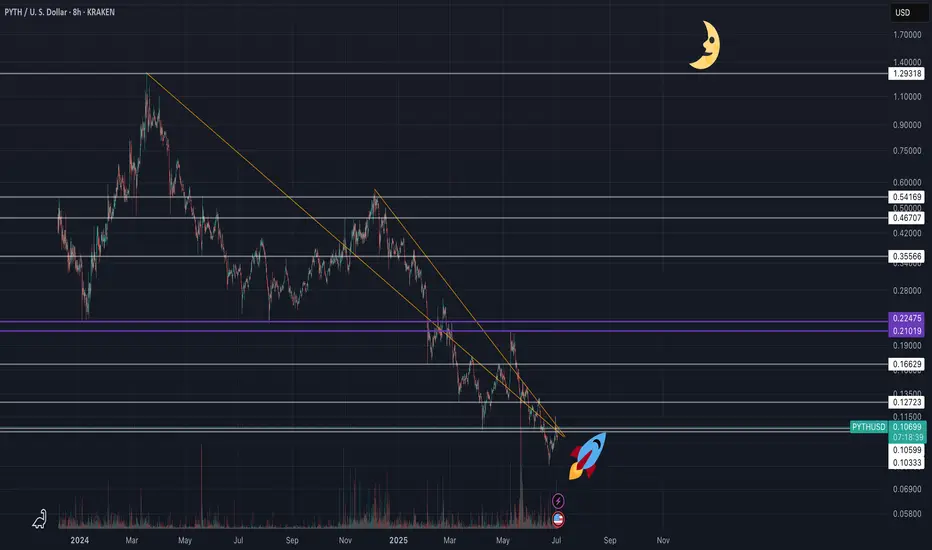
PYTH NETWORK (PYTHUSD) - (10X - 50X Potential)Pyth Network is an oracle protocol originally built for Solana, optimized for ultra-low latency and first-party data directly from exchanges and market makers. Unlike Chainlink’s node-aggregator model, Pyth enables real-time price feeds (as fast as 400ms) sourced directly from over 100 institutional providers, including Binance and Cboe.
🧩 Why Pyth?
DeFi apps need fast, accurate pricing to avoid exploits and ensure fair trading. Pyth delivers high-frequency, high-integrity data, especially valuable for derivatives, perpetuals, and high-speed DeFi protocols.
🌐 Massive Expansion
What started on Solana now powers 100+ blockchains, including Ethereum L2s, Cosmos, Sui, Aptos, TON, and more. As of 2025, over 420 protocols integrate Pyth, with over $48B+ monthly trading volume secured. It has become the #2 oracle in DeFi by usage, dominating ecosystems like Solana, Sui, and Injective.
📊 Tokenomics & Unlocks
Max supply: 10B PYTH
Circulating: ~5.75B (mid-2025)
Next major unlock: May 2026 (~2.1B tokens)
Utility: Governance, staking, publisher rewards, and oracle integrity
Pyth’s decentralized governance is growing, with a DAO now guiding key protocol parameters. It’s also expanding beyond price feeds, launching products like randomness (Entropy) and MEV mitigation tools (Express Relay).
Disclaimer: This is not financial advice. Always do your own research before making investment decisions.
LINK Weekly – Double Bottom Confirmed
LINK on the weekly has confirmed a double bottom formation right at the 0.786 Fib level.
Remember, this Fib level is the last major support — so price is basically at bottom levels.
Last week closed above the weekly 200MA.
The next resistance zone is the BB center line and the 50MA.
If price clears this zone, it could push toward the 0.618 Fib level.
Always take profits and manage risk.
Interaction is welcome.

Chainlink, The Fed, Vanguard, Crypto & Apple"Buy the rumor, sell the fact." The market tends to price-in an event before it happens. I am talking about the reduction in interest rates. The participants are aware that there will be a reduction in interest rates by the Fed and this is bullish and so buying starts to happen much sooner compared to the announcement of the actual event. By the time the event becomes a reality, it is already priced-in. Meaning...
Chainlink is bullish now and the chart is the same as HIVEUSDT, which I shared just now, and many other altcoins. This is good because we know what happens next. If there are other pairs with the same chart but moving up, moving ahead, then we know that these two and all those other staying behind will also follow, makes sense? Sure it does. We are all one. What one does, the rest follows.
Chainlink (LINKUSDT) is set to grow. Easy to see, higher highs and higher lows.
Will the market go up because of the Fed? We can say so before or after the event, right now the only important action is to buy-and-hold. It is important to be fully invested in Crypto, because Crypto is outperforming every other risk-asset in the entire world. You want be in in the market that is about to pay. You don't want to be holding bonds or index funds, that's a huge mistake. You buy these stuff to make money, you can make with Crypto in 6 months what an index fund (Vanguard SPX) will pay in a decade... Do the math, are you a young adult, are you smart? If you are, take action now before it is too late.
Your choice of course. Imagine the people in the 80s investing in Gold rather than Google, Microsoft and Apple... Big mistake.
Namaste.

Final $LINK in the corrective chain?If you find this information inspiring/helpful, please consider a boost and follow! Any questions or comments, please leave a comment!
LINK could be finishing a double zigzag correction. Recent reaction at the channel’s most likely target area shows promise. Watching for an internal retrace that holds above key support.
Key Levels:
11.81: Ideal retrace floor
11.00: Break kills impulse idea
13.25: First upside flip needed
15.00: Big level to break for bulls
Bulls have been tricked before with possible impulse starts. This one has the right look and confluence, but caution is warranted. Ideally, we get consolidation and push above 13.25 to build confidence in further upside.
As long as price holds above 11.81 and builds higher lows, potential remains for an impulsive move up. Break below 11 and bias flips back to bearish continuation.
Trade Safe!
Trade Clarity!

LINKUSD Paths on OfferPretty clear accumulation stages going on and so I am inclined to think we head towards the Bullish path to ~$100
Bears will want to buy LINK at massive discounts and so perhaps we do see some capitulation before our next mark-up phase.
However, the current Total Market cycle patterns, along with the BTC pairing, almost rule out the possibility of further downside, or at least major downside.