Chainlink Expansion Move AnalysisWould really like Chianlink to play out this way. Goes up a couple 100 - 1000% and then pulls back 67% which it has done so after the most recent crash. Been respecting the trendline for a year and a half. Next run to $100 which is a psychological price level, could yield a nice 500% return. But I would wait a bit before getting in, and monitor BTC price action to establish an unbiased bullish sentiment.
Chainlinkusd

ChanLink: The current fight between bulls and bears.ChainLink is trying to break the current trend line, which indicates a relatively strong down trend.
Apart from TL, the current price is reflected in resistance and Fibonacci level 0.382.
On the other hand, when the price falls, the price hits the Pivot Point R1.
At the moment, the fight between bulls and bears is in full swing, without a doubt.
Price action in lower time frames will help us estimate the direction in which the market will move in the coming hours.

LINK: Hitting bottom? LINKUSDT seems to be at support.
Let's see if the price can hold up at this level and volume start picking up.
LINKUSD is a top performer and coin with great fundamentals that usually outperforms most of the top 50 coins.
LINKUSDT is always a great choice.

💡Don't miss the great buy opportunity in LINKUSD @chainlinkTrading suggestion:
". There is a possibility of temporary retracement to the suggested support line (23.00).
. if so, traders can set orders based on Price Action and expect to reach short-term targets."
Technical analysis:
. LINKUSD is in a range bound, and the beginning of an uptrend is expected.
. The price is above the 21-Day WEMA, which acts as a dynamic support.
. The RSI is at 60.
Take Profits:
TP1= @ 27.75
TP2= @ 31.25
TP3= @ 34.45
TP4= @ 37.50
TP5= @ 41.15
SL= Break below S2
❤️ If you find this helpful and want more FREE forecasts in TradingView
. . . . . Please show your support back,
. . . . . . . . Hit the 👍 LIKE button,
. . . . . . . . . . Drop some feedback below in the comment!
❤️ Your Support is very much 🙏 appreciated!❤️
💎 Want us to help you become a better Forex / Crypto trader?
Now, It's your turn!
Be sure to leave a comment; let us know how you see this opportunity and forecast.
Trade well, ❤️
ForecastCity English Support Team ❤️

Chain Link breakout, the prince will take the throne Hi traders,
(Around june 2020, Chainlink joined the list of the top 100 tech-oriented companies by the World Economic Forum.)
We are looking at the 4 hour graph.
Memories of $40 - $50 in the collective consciousness.
FIB extension price targets:
$26,71
$30,7
$33,6
Good news:
$33,6 is easily reached.
Next target: $48
Bad news
$19 is easily reached
This is not financial advice.
Enjoy

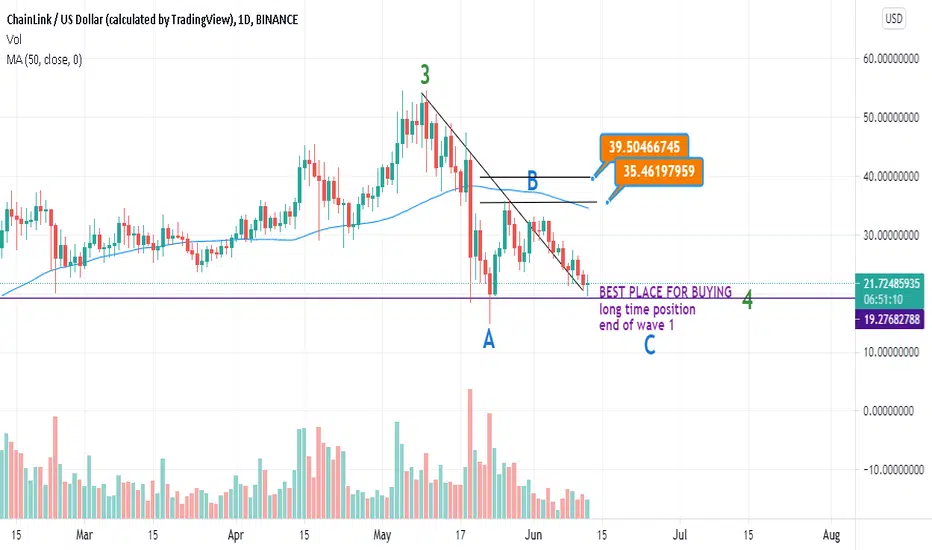
Chainlink wait for ending of wave 4LinkUsdt in wave 4, best place for buying is ending of wave 1, wave 4 will closed uper this line but i believe that we have more correction yet
LINK AbstractAbstract idea for LINK
Clear pullback in play, great buy entries at these levels
I believe a full recovery will occur


$LINKUSD ChainLink entry PTs 19 possibly-23-30 Target PTs 55-69 ASCENDING BROADENING WEDGE WITH BULLISH PENNANT AND SYMMETRICAL TRIANGLE

LINK/USDTif the price breaks downward channel
we can take long position after
the price pullback to channel.
stop loss in under the upline channel

LINK short term push higher inboundBITSTAMP:LINKUSD
Another short term LINK chart. I see a good probability of a push higher, first tp is $35.
Good luck.
LINKUSD : COIL / POSITION / SWING TRADEChainlink is a decentralized oracle network that brings off-chain data into an on-chain format, bridging the gap between the isolated blockchain and real-world data.
It aims to ensure that the external information (pricing, weather data, event outcomes) fed to smart contracts remains untampered with.
Chainlink is built on top of the Ethereum blockchain and Chainlink (LINK) is the native token of the protocol. LINK is used to pay Chainlink network operators for their services.
Smart contracts are the “If-This, Then-That” software code through which instructions will be executed when specific conditions are met. However, smart contracts can read only on-chain data.
For smart contracts to read real-world data, they must find a way to connect and synchronize with external data sources. This is where oracles are used as the ‘bridge’ that allows off-chain data to be made available on-chain.
The Chainlink protocol is a decentralized network of nodes that enables real-world data to be made available on-chain.
Chainlink’s main users are project developers who want to integrate Chainlink into their projects or those who want to sell their data and become part of the participating nodes.
Some of the notable players participating in the Chainlink ecosystem include Aave, Synthetix, Yearn.Finance, and Google.
29 Projects Integrated With Chainlink : decrypt.co
Deep Dive on Chainlink and Risks : youtu.be
Source : Coin Bureau, www.youtube.com

LINK - 1D. We expect a retest of the range of $22-24We haven't updated our thoughts on the LINK coin for a long time. Our last idea for the scenario of a local fall worked, but it was a short-term target:
However, after that, the LINK market was waiting for a powerful collapse, during which the price hit the mark of $15 . The reason for such a powerful fall was two massive liquid zones, in which there were a large number of buyers stop orders . The first powerful impulse for the fall occurred after the breakout of the white trend line of buyers:
Buyers held this trend line from January 2021 and confidently defended it 4 times. The loss of control over the white trendline of buyers triggered a wave of decline in the important price range for LINKUSD $22-24. The importance of this range was noticeable back in January 2021:
Before the test of this range in January, buyers found it difficult as the resistance increased significantly. This is noticeable in terms of trading volumes. However, just below this range was the second liquid zone of buyers' stop orders. Having touched it, the LINK price made another wave of decline, which tested the mark of $15 . The positive thing in this situation is that in a few days the buyers managed to significantly rehabilitate themselves and raise the price by 100%. Thus, the price of LINKUSDT is now trading in the range of the previous all-time high of $32-35.
On May 20, sellers managed to keep this range and this became the reason for the continuation of the fall. For a confident continuation of the LINK price growth with a target of $42 , we will expect a retest of the range of $22-24 . If the local fall wave passes without much aggression, then we will gladly buy LINK from this range.
This scenario is confirmed by the LINKBTC chart:
The chart shows that buyers have kept the price of LINKBTC within the channel and the prospect of continued growth is quite high. However, without price fixing above the liquid range, we would not be in a hurry to buy Chainlink.

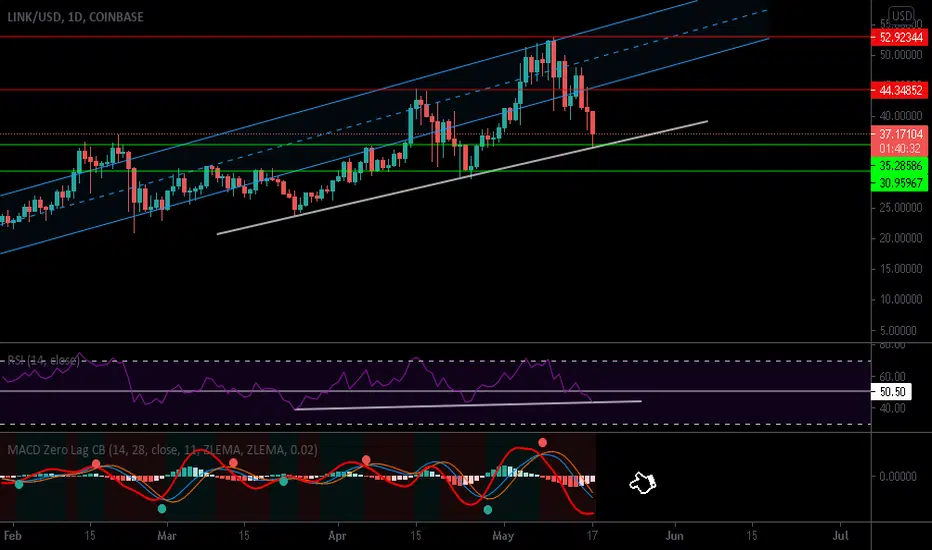
Chainlink looking very bullish!Link has performed very well after the "bottom" a couple days ago, we are sitting right on the 0.6 Fib level and aswell moved above the 200 day MA! Tonight will be a big close for link i would really like to see us hold this 0.6 Fib and 200 day MA, then i think we got a good chance of moving higher, but right not everything is riding on BTC with the market generally following Bitcoins moves. We found some down slopping support on the RSI and now we're seeing a little bit of a come down right around the oversold area. We gotta see a move up above the 50. point on the RSI to get that confirmed uptrend! Zero Lag MACD looks very bullish with our red lead flying upwards with our blue and orange flipping very recently to bullish, we want to see our Blue MA stay ontop of the orange and start to spread out to really start seeing some bullish momentum!! Not financial advice just my opinion!

LINK / USDChainlink is one of the many cryptocurrencies currently in circulation. It differs above all from other cryptos thanks to its function as a decentralized oracle system. It is therefore not content to present itself as virtual currency.
But it also acts as a benchmark tool to bring more safety and security to the data that is processed on the blockchain. And that's the whole point of using Chainlink.
In other words, Chainlink is an application capable of collecting relevant data from events taking place in the real world. Then it inserts this data into the smart contracts that are in the blockchain for use.

Chain-link Amazing Buy Opportunity LINKVery similar price action, no?
The only difference really is that the first touch on 1.618 didn't exactly (touch)
But it shows the potential, of how quickly formations that look at first sight really bearish, have hidden bullish characteristics.

How LINK Will MatureAn idea for link assuming the price is moving in a 12345 movement
This pullback looks extremely bullish for most top coins
including Link

LINK 2 hour chartMay 28th is a big day for LINK! Expect a run up. I believe we need one more small consolidation before breaking this channel. All depends on where BTC lands, right now it's in a box on the hourly looking to head to 40k or break 45 and head back towards 50.
This is my first crypto chart, let me know what you think!


LINKUSD Back to Objectives before Panic SellingLINK seems decided to go back to the goals of before panic selling,
my Marketmiracle advisor generated two input signals for the Chainlink around 44 USD with 55.70 target
Analyzing graphically the graph would seem to actually be the typical features of an upside down head shoulders with that price target.
You can follow my advisor’s real-time signals to marketmiracleadvisor.com is a free service and does not require any type of registration.

Link Ready To Explode!!Chainlink was cruising at ATH's about a week ago and has since been feeling this market correction, good news though Link has found very strong support, both uptrend support and accumulation support. The important thing is Link continues to make higher lows on a longer TF. I am bullish on Link, Defi and altcoins. We also have good support coming from the RSI higher lows aswell, would be very key to see a push above the 50. point like we saw on the second highest low, just below the 50. then we shoot back up. Now saying that remember everyone is watching BTC as the market will follow. The MACD i think is starting to look very bullish with the red lead bottoming out and slowly curving back up, and the blue MA is getting closer to the orange, hoping to see a bullish flip and a big swing up. Also the ascending channel looks very familiar to what we saw April 15 Aprx. Big swing down out of the channel creating a higher low and finding support then to afterwards shoot back up creating a new ATH! Not financial advice just my opinion! Also check out my NFT work on rarible, have a fire artists album cover dropping soon! rarible.com
link/usdt binanceCHAIN-LINK moving like a sideways consolidation & creating PARALLEL CHANNEL pattern...!!
