LINKUSD ELLIOTBroke out of the descending triangle, Possible small drop to previous resistance, and then bounce back up. (Confirms Elliot wave)
Chainlinkusd

Open Moving Averages - LINKLINK has made a clean break upward, this movement upward should continue, emphasized by the 3 open moving averages.
On a personal note
I recently sold my investments as I felt they were taxing on my Mental health, I don't have the fortitude for this industry!
For anyone that can relate just know you aren't alone.
Bixley

CHAINLINK'S NEXT MOVES WILL BE ASTOUNDING!I believe Link will back-test it's previous ATH of $20, and then explode much higher in the coming days/weeks. This is only expected with Bitcoin holding current bullish levels. If BTC crashes in the short term, it will drag Chainlink and altcoins down with it.

LINK Parabola InitiationThe Banana Boat parabola ;D
Lets see how this plays out over the coming years.
Target for me is ~100
Very bullish extension of Ethereum
Adding more today!
Bit of a geometric analysis

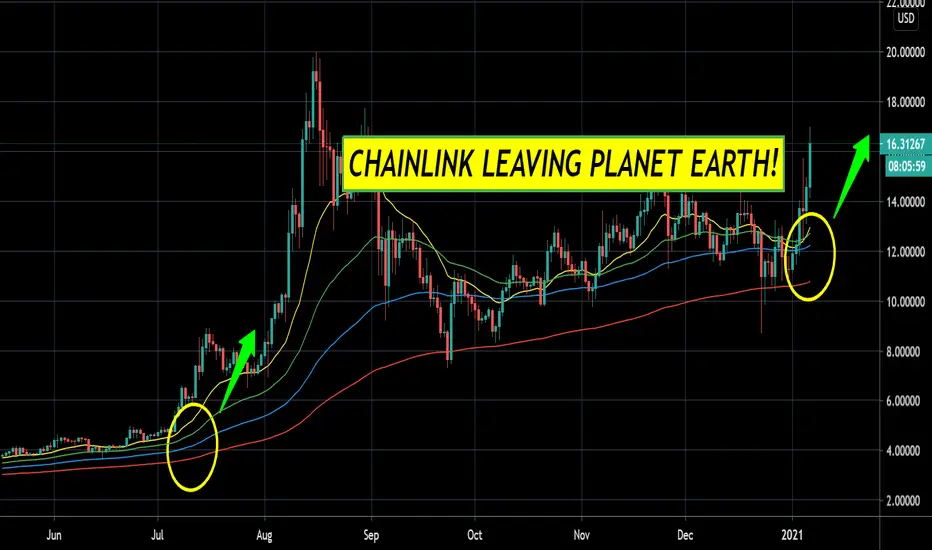
Chainlink Continues to Gain MomentumDecentralized oracles token Chainlink continues to gain momentum now that its price has reached new all-time highs.
LINK/USD has doubled in the past few weeks. We have been highlighting the possibility of another leg up after the recent price consolidation. LINK/USD broke through the 100 day SMA in early January and has not looked back.
The Relative Strength Index (RSI) is 18% below where it was in mid-August 2020 so we may have some room to run. RSI confirmed its bullish trend on 11 January last as it crossed the 50 mark. Stochastics is still bullish as it heads into overbought territory. MACD turned positive at the turn of the year and looks over-extended relative to it's one year price history displayed.
LINK/USD is trading at $23, well above the 8 day EMA ($19.83) which is around the level of the highs reached last August 2020, therefore providing short-term support. The 100 day SMA currently lies at $13.11.

L I N K: $34LINKUSD
This idea confirms as a valid one when the price closes above the resistance line.

LINKUSDT breakouut to ATH imminent? Key level in play...LINK is killing it with its recent rally and looks to re-testing 18.80 key resistance level. Break that on a weekly close basis and higher chances for prices to run new ATHs.

#link daily LINK FINALLY BREAKOUT AND LETS SEE THE HOLD @20$ AND MOVE UP TO OUR PROFIT SELL TARGET @29$

LINK 12h Historical high is close, what will happen next?For 4 months, the LINKUSDT price has been moving upward in the channel.
Of course, there was one flow by $8, either to work out our idea )) or to knock out the longists. But the fact is that without extra passengers, upward, it became easier for the locomotive to move.
Now the LINKUSD price is approaching the important $19-20 zone , which is very close to ATH.
And here we need to carefully monitor how the price movement will be controlled:
If the price consolidates below the level of $19, then no doubt they are preparing for a breakout upward, and there the targets are: $20 and $22.5 soon.
If there is a sufficiently strong rebound down from $19, and buyers will not buy it back, then thoughts will creep in that they are forming something like a "double top" or "Adam and Eve".
At least preliminarily, some conditions are already met:
- the first top is sharp from the spikes and with high volumes
- the second top is flatter, U-shaped, with low volumes
- the difference between the tops is not more than 5%.
In any case, you need to closely monitor the market and select coins, especially when prices are near historical highs. And you need to trade for the trend, not for wishlist.
It's also worth noting that Link is very sensitive to BTC flows.
Good luck to all of us)
_______________________________
Since 2016 , we have been analyzing and trading the cryptocurrency market.
We transform our knowledge, trading moods and experience into ideas. Each "like under the idea" boosts the level of our happiness by 0.05%. If we help you to be calmer and richer - help us to be happier :)

Chainlink/USDT- Longterm trend line intact!Chainlink has broken above critical resistance, and is now using the weekly long term trend line as strong support. All eyes on BTC to either cooloff/ takeoff and Link should stay above this trend line.

LINK 20$ ON THE TABLE$LINK updated Daily TA: EMA and sloping resistance test done, bounced hard. #LINK has no way to go other than 20$ at this point. Invalidation level is shown. I am bullish.


Chainlink's SOLID FLOOR Trend LineOn the weekly chart, Chainlink has formed a very strong floor in my opinion. It also coincides with Link's 21 week EMA which makes it even stronger. If prices fall below in the short term, I would expect only a brief wick and I 100% expect to close any weekly candles ABOVE that trend line!


Chainlink (LINKUSD) will probably see a small correctionOnly due to other major coins being very overbought right now I believe that Chainlink (LINK) will see a small correction in the coming week or so, before moving on upwards again. There is room for this coin to grow much higher I believe.

Chainlink Looking to Test Near It's ATHLINK breakout to possible $19.79 target.
Remember this is only my formed analysis outlook. This is not an endorsement or recommendation to buy or sell.


LINKUSDT about to make a run for ATH? Levels to watch.It can be argued that we are seeing a breakout and re-test setup for this pair. If we work under that premise, it's reasonable to to expect a subsequent test of the 19.00 levels for a new ATH attempt. But only if 15.80 holds. Otherwise, more sideways to down are likely.
Looking for a strong bullish close in today's candle.

CHAINLINK PATH TO ALL TIME HIGH LINK!Today we look at Chainlink LINK and see if we can tell when the all time high may happen. Look at the similarities of the patterns shown. I believe we may be a few weeks to a month away from a breakout if Bitcoin doesn't massively correct in the short term.

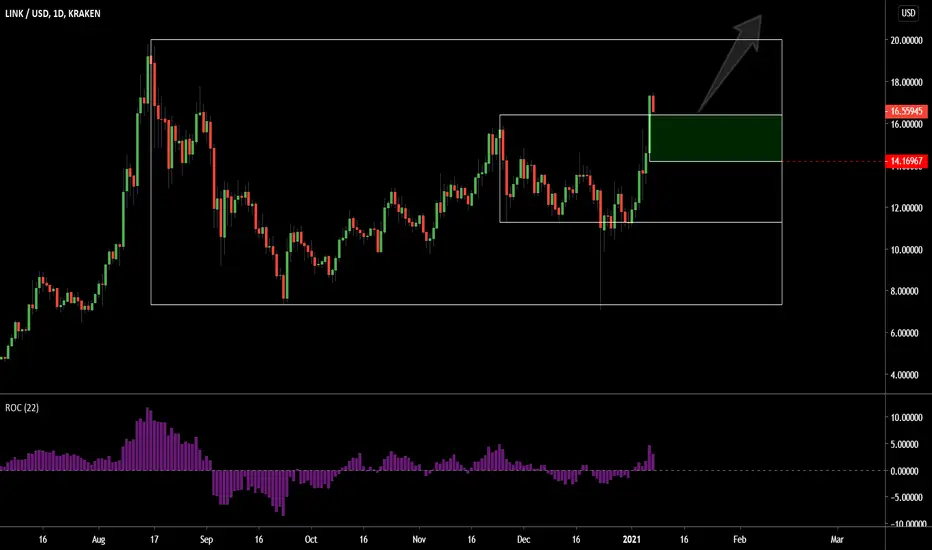
The missing linkChainlink has lagged some of the other names in the space but it could be next to see highs. Given yesterday breakout above the smaller weekly range/rectangle price might be headed toward 20. The breakout trade buy range is here or lower- green rectangle. The stop is 14 area below todays low.
CHANLINK MOVING AVERAGES SORTED OUT! MOON:30!Each time in history LINK has had it's daily EMA lines sorted out, it has had a massive move with at least 40% upside. History does not have to repeat, but it sure would be nice! Keep an eye out! I will be posting daily updates Monday-Friday! Thanks!

LINKUSD: It is all there for the display. Only up.LINKUSD is coiling up since July 2020. Roughly half an year now and the volume has not been so bad since its ATH.
On the daily, RSI is mid way and balanced at around 44 and the histogram is about to flip to the positive side.
It appears that it is ready to make the stronger move towards upside.
I would expect it to break $ 15 by mid Jan and move upwards towards around $25 to $28.
It appears that we now have a good entry point at around $11 - $12.
DOTUSD broke its all time high yesterday was in a similar situation.
Considering that it is only BTC that is moving up for so long now with only few alts keeping up would say some of that money and profits will certainly move towards alts especially the ones that are not paid attention on. LINK is one such crypto that hasn't made anything major to grab the headlines and possibly the time soon.
Also, given that LINK sprung into the top 10 spot in a BTC bear market, it would not be surprising now when BTCUSD is cooling off.
Good luck, Happy trading.
And one more thing ,this analysis is just my opinion on the market considering the technical hints provided by the market movement and not to be considered as any form of investment advice.
Thank you.
