Chainlink on the cusp of a massive rebound
Chainlink seeks a formidable anchor at $11 to plan the next recovery mission.
The double-bottom pattern on the 4-hour chart hints at a possible rebound to $15.
Chainlink is leading the correction in the decentralized finance (DeFi) ecosystem after losing over 10% of its value since Tuesday. The token is trading at $11.7 amid an ongoing retreat. Recovery is possible if LINK confirms the likelihood of a double-bottom pattern forming on the 4-hour chart.
Meanwhile, the Relative Strength Index adds credibility to the short term bearish momentum following the dip into the oversold area. A rebound will come will into play if the RSI creates a bullish divergence. This type of divergence forms when the RSI hits a low within the oversold area followed by a series of higher lows.
The occurrence of a double-bottom pattern also hints at a tentative recovery from the dip. The pattern comes into the picture when an asset tests the same lower price level twice without breaking it. The price level comes up as a firm buyer congestion zone, thus the weight behind the anticipated rebound.
On the upside, resistance is anticipated at $13 (former support). Other levels likely to hinder recovery include the 200 Simple Moving Average, the 50 SMA, and the $100 SMA. The rebound from the double-bottom targets $15, a move that could pull Chainlink into a new bullish phase towards the yearly high at $20.
It is worth noting that, LINK will invalidate the uptrend if declines stretched past the expected support at $11 (double-bottom). Massive losses are likely to play out as investors rush to cash out before Chainlink dives under $10. A possibility exists for the price to refresh August’s support at $7.2.
Chainlink intraday levels
Spot rate: $11.8
Relative change: -0.3
Percentage change: -2
Trend: bearish
Volatility: High
Chainlinkusd

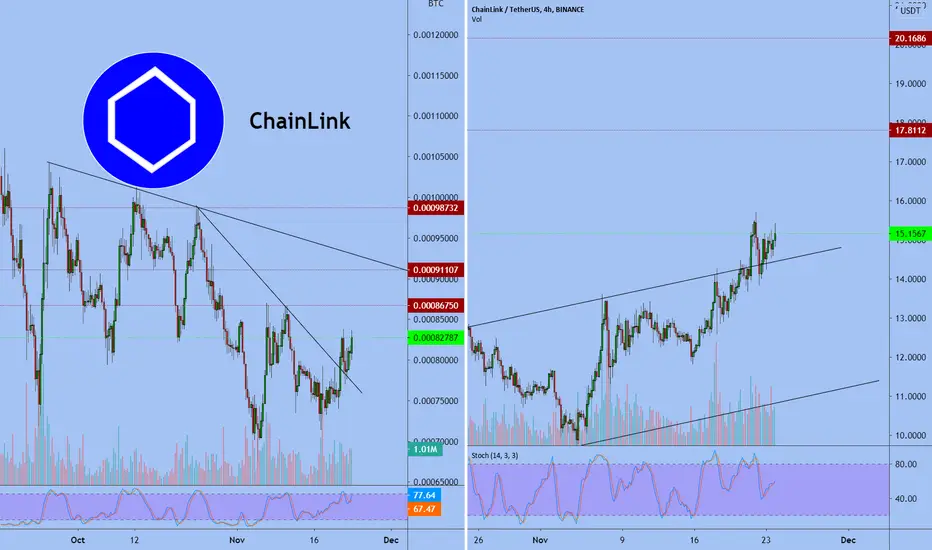
LINK/USD Approaching Buy ZoneLink is trading near a support zone in a falling wedge nested within a ascending parallel channel.
This zone corresponds with support from the volume profile and the 0.382 fib retracement level.
It is also exhibiting RSI divergence and is oversold on the Stochastic RSI.
If it finds support, we can expect it to maintain its uptrend within the parallel channel.

Elliot Down Wave A, B, and[C]Wave C started!
Prices move impulsively lower in five waves. Volume picks up, and by the third leg of wave C, almost everyone realizes that a bear market is firmly entrenched. Wave C is typically at least as large as wave A and often extends to 1.618 times wave A or beyond

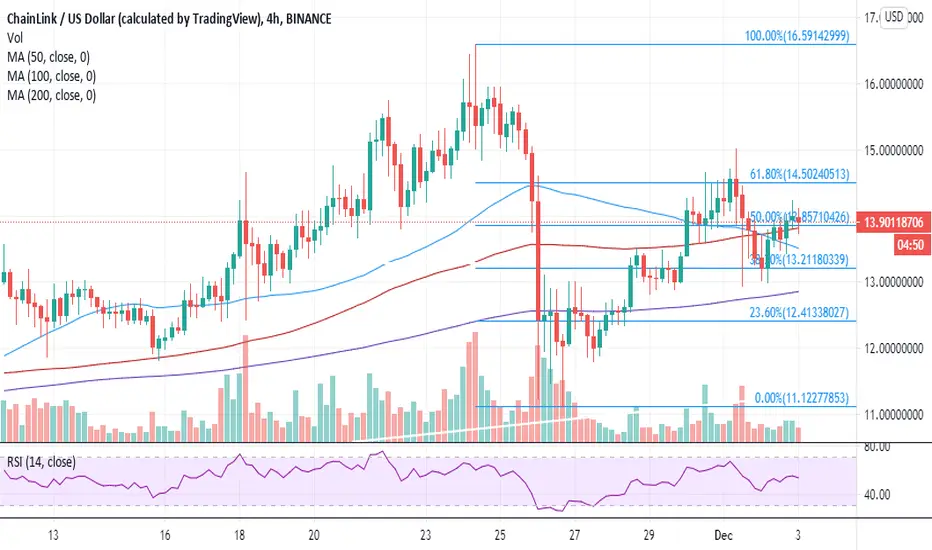
Chainlink recovery hampered under $14.5
Chainlink holds above the critical support provided by the 50% Fibo in conjunction with the 100 SMA.
LINK/USD could resume the uptrend as long as the price reclaims the position above $14 and holds the 50% Fibo support.
Chainlink’s upside recently hit a wall amid the recovery from the Thanksgiving Day crash to $11. Several barriers were pushed into the rearview but LINK failed to sustain gains above the stubborn resistance at $14.5. Meanwhile, it is still difficult to sustain the uptrend, now that the price slipped under $14.
Chainlink holds above critical support
At the time of writing, the decentralized oracle price feed token is trading at $13.9. Immediately on the downside, the 50% Fibonacci level is providing support. Additionally, the 100 Simple Moving Average on the 4-hour chart, adds credibility to the support.
Holding anchor above will cement the bulls’ position in the market while setting up Chainlink for a price action eyeing $18 in the medium term. As mentioned earlier several resistance levels are likely to delay the recovery, including $14.5, $15 as well as $16.
On the other hand, trading under the 50% Fibo and the 100 SMA might trigger massive sell orders. If enough volume is created, LINK would be forced to seek balance at the 50 SMA and the 38.2% Fibo. The bearish outlook has been reinforced by the Relative Strength Index after stalling slightly above the midline.
In case of extended declines, the 200 SMA is in line to cushion Chainlink from a massive drop. However, last week’s support at $11 would be the last resort before LINK enters into a downtrend with the potential of refreshing levels under $10.
Chainlink intraday levels
Spot rate: $13.9
Relative change: -0.034
Percentage change: -0.2
Trend: Short-term bearish bias
Volatility: Low
$LINKUSD - Further correctionHello everyone!
Chainlink is below the MA100 and may continue the correction, see levels I'm watching on the chart.

LINK/USD: The Uptrend Continues. Link/USD has been trading within a 2 month trading channel recently and looks good value here with resistance at $16.50.
Link has found support along the lower band of this channel over the past 2 months. We can see a series of higher lows followed by higher highs.
The current price sits at $12.36 and the next top within this channel would be in and around $16-$16.50.
We remain bullish on Chainlink.

LINK fakeout got me rektSo as I've said in my previous analysis of LINK I have entered a trade once it broke out of the channel. Breakout ended up being a fakeout, which immediately triggered my SL. I should've waited for confirmation... My mistake and I'll learn from it.
Now: LINK is at the bottom of the channel. I have taken a medium size position in LINK with a SL at $11.20, just below the previous wick.
Safe trading!
------------------------------------------------------------------------------------------
Please feel free to share your view on this pair down below in the comment section. I'm more than happy to be challenged and have an interaction on this idea.
Also make sure to leave a like as it helps me out a lot!

LINK.USDT (Y20.P5.E2).Harmonic or H&S?Hi All,
Note:
This is a continuation of the previous post for link and at the end of this post, I made this update. Now we are continuing off this update.
Those who know me, I like to continue off the price action story when its relevant.
My Thoughts:
=======================================================
> I'm first suggesting like BTC, we are now in a downtrend and should trade that way;
> I made a fair bit of effort to look at it from many angles with the following:
a) EMA \ RSI weekly and daily perspective; (34 to 50 weekly ema)
b) Head and Shoulders scenario; (height of head is used as target)
c) Inverted BARR approach; (where the wave started from)
d) Channel approach;
e) Support and resistance\fib level approach; (double bottom scenario) and macro 0.382 fib level.
f) Harmonics
From all this, I have concluded for now, this green zone makes sense;
You be judge:
Note the double bottom fractal.
> Here we have the following elements of a, b, c, d, e, and f;
We are doing the ABC motive\impulse wave based on cycle theory and wave analysis;
> From the HARMONIC perspective, the price can fit into a number of Harmonics so we will have to wait to see what point C is to know or estimate where point D will likely be.
We can have the double bottom approach, represented by the ABCD model.
> If you look at the macro chart below, one can see the mid line of the channel which acted as strong resistance (5) and hence will be strong support
at point (c) which resonates with the level of the double bottom.
> Another approach is the inverted barr method and it too has point C of the ABC wave;
This also resonates with the weekly support level;
> The Weekly chart: bottom ema ribbon = 34 to 50 EMA, acted as support. I think the 21 weekly ema (lime) was tested and we got a bounce already
but I see this as point A of the ABC wave and hence will not hold
Note the weekly RSI level which gave a consistent continuation trend support level.
BEARISH Scenario
Please give me a like or tick for this post,
Regards,
S.SAri

LINK is looking like it's ready for take-off before XmasNot too much to say since the chart speaks for itself. If Chainlink manages to stay inside the current fib channel, we could reach anywhere from 100% to 200% gains before Christmas. I'm long again since $12.25 and plan to stay that way for at least the next three weeks.
PS - I'm new to TradingView and publishing my TA publicly, so let me know if you see something I don't or if you have any comments or suggestions. Thanks! -Juice

LINK Domination ProjectionHere we can see that LINK is in nice upwards parallel channel for a long time. My prediction is that it will get to 6-10% mcap at the next peak.

ChainLinkEveryone remembers ChainLink's historic growth this year. In the current situation, when the capital goes to the top altcoins, it looks very promising paired with Bitcoin.
If Bitcoin falls, it will pull the market down, so you should follow capital, risk management.
Best regard EXCAVO
$LINKUSD - Out of the channel trade setupHello everyone!
LINKUSD is out of the channel, hence should continue the uptrend.

Chainlink top 10 market cap november 2020Chainlink are not listed during last altcoin season.
but this during bitcoin bull run, its on the list.
there is attach the pullback for the price
$15.25 USD @

LINK.USDT (Y20.P5.E1).Macro.Bullish formationHi All,
Just putting forward a likely scenario based on a few points.
> we hit the 0.618 fib level as resistance;
> BTC has likely hit a resistance; hence a pullback is likely and hence for link as well;
> If there is a pullback, since BTC is still bullish, link will also;
If BTC looks for the daily 21 EMA, it maybe the case for LINK looking for the same, either the daily 21, or 50 EMA.
If this was to occur, as per the chart, it will on the macro level, create a cradle on the weekly where we use the larger ema support to go back in.
If this was the case, we can anticipate a macro continuation pattern, as we got here, a inverse H and S. It could also be some sort of ascending triangle.
Note, the fib levels on this chart and how they correlate with the structure and EMAs. All key ingredients for the next move.
These are my thoughts for now, in the planning.
Cheers,
S.SAri
PS. The wedge breakdown will be the trigger.

Link Will Recover Link Holders do not sale Link Will Recover Link Holders do not sale stay in trades

LINK/USD at a crossroads. Here Are Our Price Targets to Watch!Here we have a WEEKLY Fib-Retracement chart... Bitcoin's recent run up could spark a LINK rally in the short term. If that is the case and Bitcoin can hold these high levels for a while, LINK could see a swift run up much higher to around $15.50 very soon. If Bitcoin corrects harshly and quickly, our target for LINK is the $10.75 support. If LINK starts closing daily candles below $10.75, we are in for a bigger drop and I see $8.50 being the absolute lowest we go over the next few weeks/months. If this happens, it could be the chance of a lifetime to buy more LINK.

Link Uptrend Waiting for link to flip the $13ish resistance into support. I am excited to see what Link can do in a bull market.

Link looking ready to move.... dump or pump?Thoughts provided in the text bubbles on the charts. No clear conclusion can be made by looking at these three time frames. There is upward pressure but the indicators show to me that link is set up to dump... Therefore we must look at more time frames to see if we can get a different view and a more clear idea of what is to come.
The areas marked are to compare present day to what looks to be a very similar situation that occurred just recently.
I will provide the update here

Chainlink mid-long term analysis. Ready to moon?In depth description is given within the text bubbles on the chart.
Overall the technicals are looking very bullish and are indicating that we are still in a long term bull trend.
If you don't hold link I would look to accumulate on any dips. Im expecting some sort of shakeout to occur before going up but it will be just that, a shakeout meaning you will have to be on top of getting your buys in.
If you are looking to get in a margin long before sure to follow me as I will post good entries for those too... last one we got in right at 11.50. The best time to get in these margin trades is during the shakeouts when you can catch them.
WARNING: I POST THIS AS "LONG" BUT ON A MID TO LONG TERM TIME FRAME. If you want the best entry you will need to be weary of lower time frames as well. Be sure to follow me and like my ideas as I will give good entries on these shorter time frames and post relevant updates within my publications.

chainlink mega target 28ishFor me, chainlink is now ready to make a trip to 28usd, momentum is string and after pullback look like we might be ready to go again

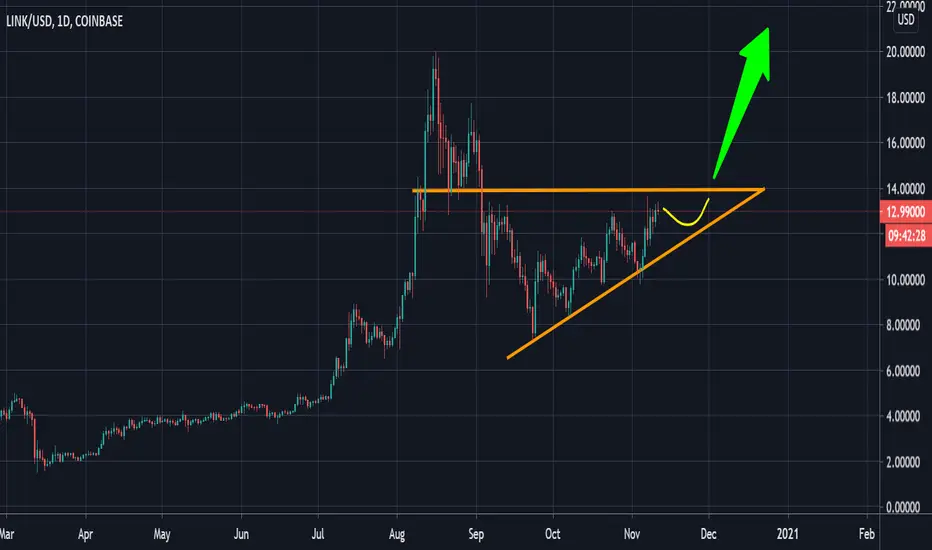
$LINK Rockets igniting. Be patient, be ready...it's coming!LINK is forming one of the most bullish patterns in crypto right now. Rocket fuel is igniting. Be ready! Once we break $14, all time highs will quickly approach! We are close! Stay focused on the big picture!
ChainLink - $LINK - Let it play out...No one goes into the market thinking they should buy at the high and sell at the low. The problem is that at the moment when faced with the ups and downs of the market, it’s hard to resist the urge to do those things.
Trading is all about spotting emotional excesses either to the downside or the upside.
You want to be on the right side of those emotional reactions and not the wrong.
#LINKUSDT: I'm SHORT/BEARISH position up until ( GREEN BOX ) Fibonacci retracement levels 50% ; .618% I expect that $LINKUSD will rip down.
This would mean that CHAINLINK will lose more 50% of its current value against USDT Tether before it can recover.
Well, I keep you updated as this timely issue evolves.
If you want to win in this market, you need to be COLD and CALCULIST.
Good luck!
#LINK #CRYPTO #LINKCHAIN #CHAINLINK #ALTSEASON2020
$BTC $BCH $BNB $XLM $EOS $ETH $ADA $LTC $TRX $XRP $IOTA $LINK $XTZ $BTT $XMR $NEO $BTT $MATIC $XMR $MRK $XEM $ONT $DASH $BAT $ZRX $LSK $NANO $REP
#altcoins #bitcointrading #BuyTheFear #BuyTheDip

ChainLink / U.S. DollarThis honestly seems pretty self-explanatory.
Simply put, I would wait for breaks in market structure along with returns to continuations in order to participate in price action's movements.
