CHAINLINK Chart Analysis Brief Projection
To Help Better understand mY projection and Price Targets i did this chart using the Fib Circles.
as you view in the First pic you can see how accurate the support and resistance points are lining up with the fib circles.
moving on to the second chart pic you can see how the fib circles crossing thru each other are also holding support and for each line we touch we are usually bound to pull back slightly to help break resistance to spring for a pump. sometimes we break right thru resistance with strong pumps. so understanding this pattern will help you understand why Chainlink needed the slight pullback today. the dump was caused by a liquidation event according to trading view pulling chainlink back by 20% in 30 mins.
back to the charts though as of right now chainlink could fall a little lower to $16.22 before tracing up the 2.618 fib so i am expecting by the end of the night tomorrow for link to shoot back up to $18.26 and maybe pulling back slightly again i'm not expecting to much pumping at the moment how ever i did notice a small bullish divergence on the RSI for the 1h chart which shows we are oversold.
just my chart analysis and price predictions ( THIS IS NOT FINANCIAL ADVICE, This is simply a idea from a fellow trader you are the only one responsible for your own Gains and your own Losses)
Long term im very bullish with chainlink and many other coins
Chainlinkusd

Sell Zone and Target for Chainlink LINK/USDT $LINKMy sell zone and target for link. Link is probably one of the best performing coin this year. It has had a huge run up since March. I believe Link can get up to $25 sometimes this year, but, in my opinion, i think it should correct down a little bit before getting there.
(Not financial advice)

ChainLink Possible Scenarios Chainlink is coming to a crucial Point to pump or possible dump.
possible Head and shoulders on the 1h chart along with a bearish divergence if we dump could possibly retrace around 17.26
while BTC volume is up i expect chainlink to do a little more pumping possibly by Tues or Wed
these are just possible scenarios
RSI overall isnt bad
Not Financial advise just a quick idea and chart analysis

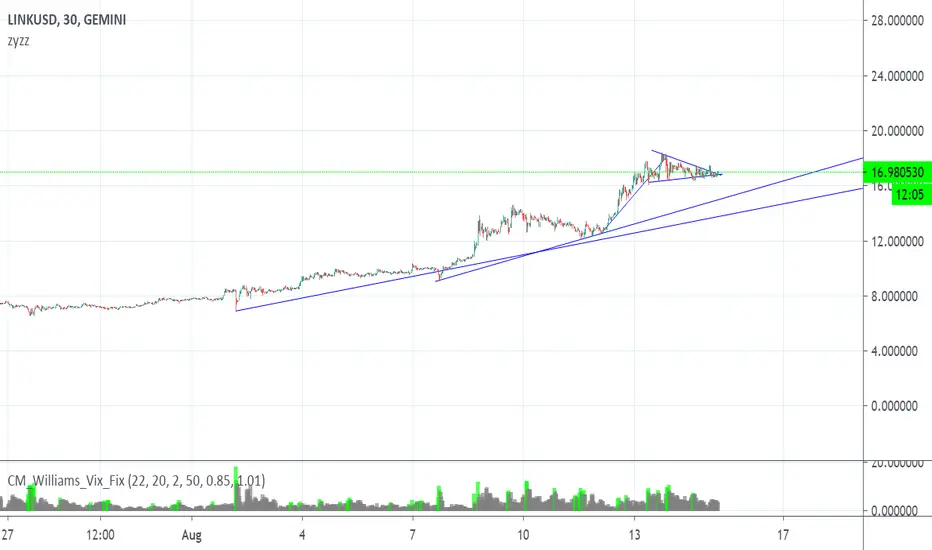
Volatility decreased, but price hasn't responded.Chainlink crypto (LINKUSD) 3 hour timeframe volatility as measured by williams VIX Fix Indicator has decreased which would normally indicate higher prices. however price has remained below green horizontal line. Expecting price to rally in short term at least to above green line.

[SHORT] LINK - Possible break of parabola and re-test of supportBearish (double-top) OBV, head-n-shoulder formation, and head-n-shoulder formation.
Target is $15.51.


LINK CHAINLINK retracement levelsChainlink, Tellor, and Band Protocol all provide what are known as “oracles” for decentralized applications. Oracles connect off-chain data to decentralized applications — a service that has become increasingly important to DeFi.
I`m looking for a retracement to 0.618 level or 0.00085270btc.
If you are interested to test some amazing BUY and SELL INDICATORS, which give the signal at the beginning of the candle, not at the end of it, just leave me a message.

Aug14 - LINK (1D) - FINAL DESTINATION?? 🚀😅My ultimate fib target for LINK is reached at ~$17.7 (projected from 2019-2020 first upwave to $4.5x)
Profit take at 16.8-16.9$ area ✅
...part of my small alts portfolio, besides the MAJOR HODL on #BTC #ETH
If you continue to hold #LINK,
[ b]Good Luck! :) 💪🏻 💪🏻

Chainlink Technical Analysis: LINK/USD Blasts New All-Time Highs
Chainlink has ascended to new all-time highs around $17.00 in the push for gains eyeing $20.00.
LINK/USD is trading within a rising wedge pattern spells doom with a possibility for breakdown to $15.00.
Chainlink is arguably the best performing cryptocurrency in the market this August. It is giving major assets such as Bitcoin, Ethereum and Ripple a run for their money. For instance, at the time of writing, LINK/USD has surged over 27% to trade at $16.41. This follows a minor retreat from highs around $17.00. A bounce seems to be underway after the price embraced support at $16.00.
From Monday, Chainlink has been on an impressive journey of breaking key barriers. The bullish action has sustained incredibly well above the ascending trendline (forming part of the rising wedge pattern. The price has formed a good higher high and higher low pattern but with the upside limited by the rising wedge pattern, progress eyeing $20.00 could be jeopardized.
Effort and attention among the bulls are channeled towards breaking the resistance at $17.00. Perhaps with the hurdle in the rearview, LINK/USD will encourage more buying entries, thereby drawing nearer to the ultimate level at $20.00.
Technically, upward momentum has lost its charm at the moment. The Relative Strength Index (RSI) is holding above the midline but struggling with movement towards the overbought (70). The MACD, on the other hand, is trending above the mean line (precisely at 0.2814). It features a minor bearish divergence (-0.025).
In other words, the path of least resistance is no longer to the upside. Instead, Chainlink is likely to focus on holding above the support at $16.00 in order to avert further losses to $15.00. Other support levels lie with the 50 SMA and the 100 SMA in the 15-minutes timeframe.
LINK/USD intraday levels
Spot rate: $16.18
Percentage change: -1.31 (on the day)
Relative change: -0.15
Trend: Bearish bias
Volatility: Shrinking

Buy Zone and Target for Chainlink LINK/USDT $LINKMy buy zone for Chainlink $LINK and its target. I belive link could possibly get one more leg up.
(Not financial advice)


Buying Chainlink Fomo Here Is Very SketchyAll of the talk in crypto town is around chainlink.
You know what they say... when everyone is talking about it, probably not a good time to buy.
This one has an insane rally and now is dead on Resistance at $10.
If your buying this now, I pray for you.
I personally think it's a good time to take profit and hop out.
The risk to reward buying here is not worth it, lots of room for support drop off.
I'm not interested, but I do wish you the best of luck hodlers.

Link up 125% since my previous postThe time to be bullish on #link is long gone. Sure it can still go up from there, but the risk of buying here is far higher...
Beware of people who shill you $link at these prices for clout chase...
These "link just made a new ATH" people ....

Have you given up hope? LONG LINKUSDPlaced two stop losses (S1 being for day-swing traders) & then the main one being S2 -- for the superlong HODLER) who has been in this far too long to quit.
I learned to program python 3.6, cobolt 6, java, API & cloud computation + data compression through kubernetes/docker... I've invested too much time into this career, what am I supposed to do?
I learned to be a financier (from trendline breakouts) to fundamentals/market data, conducting TA & more...as I've said -- TOO MUCH OF MY LIFE/TIME INVESTED/WASTED, WHAT AM I GONNA DO?!
Just QUIT?! & "LearntoCode?"
I can't...this is ALL i know how to do...
Anyway I'm balls deep in and when I see a superlong like this (est. timeframe >30 days min-- though if I had to GUESS a ballpark on these figures I'd say 2-3 months. So by start of Q3, that's a complete pulled out my ass figure so don't take that as bond.
When I see patterns emerge like this from a fundamentals perspective I cannot help but get excited for the future, despite the fact that i've cried myself to sleep last night and every night since last Monday.
Disclaimer
Note: This is strictly conjecture based on my own technical analysis and not any information based on any sources from the GOP Or federal government/treasury dept / ay institution of any form this example is for educational purposes only and should not be relied upon for any other use. Please invest responsibly and make all decisions based on your head; not your gut. Any projections or figures provided in this analysis are Forward-looking statements And have no basis Other than my own opinion and not information related to the GOP, SEC or wall sf in general. Just the wiz doing what he always did best — Disclaimer must be extended and extensive So forgive me as I need to truly emphasize None of the information obtained in conducting this analysis was provided by insider trading in anyway shape or form.
Certain information set forth in this presentation contains “forward-looking information”, including “future oriented financial information” and “financial outlook”, under applicable securities laws (collectively referred to herein as forward-looking statements). Except for statements of historical fact, information contained herein constitutes forward-looking statements and includes, but is not limited to, the (i) projected financial performance of the Company; (ii) completion of, and the use of proceeds from, the sale of the shares being offered hereunder; ( iii ) the expected development of the Company’s business, projects and joint ventures; (iv) execution of the Company’s vision and growth strategy, including with respect to future M&A activity and global growth; (v) sources and availability of third-party financing for the Company’s projects; ( vi ) completion of the Company’s projects that are currently underway, in development or otherwise under consideration; ( vi ) renewal of the Company’s current customer, supplier and other material agreements; and ( vii ) future liquidity, working capital, and capital requirements. Forward-looking statements are provided to allow potential investors the opportunity to understand management’s beliefs and opinions in respect of the future so that they may use such beliefs and opinions as one factor in evaluating an investment.
These statements are not guarantees of future performance and undue reliance should not be placed on them. Such forward-looking statements necessarily involve known and unknown risks and uncertainties, which may cause actual performance and financial results in future periods to differ materially from any projections of future performance or result expressed or implied by such forward-looking statements.
Peace & Love
Twitter / LInkdeln / Steemit / TradingView / StockTwits / IG
-@a1mtarabichi

Chainlink Potential BreakoutYou can see there is a bullish flag here. And Link just broke the upper resistance if we could stay above, the price we soon go up again, ending the consolidation phase.
I thinking of buying near 7,3ish and 7,0ish, with a stop near 6,4ish.
Still waiting for confirmation< here at the 1D chart
RSI and MACD are trying to go up again, and let's wait for the crossover.


LINK.USDT\BTC (Y20.P3.E4).TA on the Macro structureHi all,
My thoughts on LINK both USDT and BTC pairing.
My thoughts are:
===================================================
> LINK.USDT < based on the below chart, on the right plain
Based on my chart, we have a typical channel bull flag, as per chart and its found the fib. level 0.5 a area of demand and the 0.382 as support
On the daily, and longer time frames 2D, 3D etc the upward pressure is still there. However the weekly its dropping of
===================================================
> LINK.BST < based on the below chart, on the left plain
* I see a temporary rally against bitcoin while BTC consolidates (forming a bull-flag likely a wedge or pennant) for another leg up to 12K +
===================================================
Snapshot of LINK.USDT a bit early in the day when I planned to draft this post (ref. below I.Charts)
I believe for what ever comes to BTC top this year will be wave 5 followed by ABC or 123 downward impulse (correction) then to start the next wave up of the macro structure, from 2 to 3 point of the elliot wave.
Hence my thoughts is that many of the ALTs have made their top in this cycle and the remaining time will be the 123 impulse to find the bottom while BTC does the same.
Note, I did buy into LINK today with the understanding that it will fall short or double top before sliding further down as the previous cycles as shown on the main chart.
Please give me a like or tick for this post
Regards,
S.Sari
BTC fractal
My PREVIOUS LINK.BTC chart posted

ChainLink (LINK) LONG Falling Wedge in support of 50% Fib-RatioHello Viewers.
Chain Link after a huge boom of Rally, making it lie-under top rannked Cryptos, Possibly a breakout can be seen through the Falling Wedge, Potential Entry is around 50% Fib-Ratio, in support with Over Sold on MACD , RSI and MA"s. Potential resistances on charts are Targets to hit.


Chainlink Update once again Looking at the RSI Updated from my ealier 2 post we are officially in the sell region on the 1h chart now you can either wait it out a little longer or sell the choice is yours although note the MACD is indicating uptrend still so i personally will hold till the RSI is 60 or higher however if you boughht in my earlier buy signal you should have made a decent trade.
Thumbs up comment opinions

Follow the RSI on on 1h Chainlink Update on last Post, For everyone checking out my charts if you caught the buy signal i last posted on LINK this new update is when to sell. Any where in this area of the RSI will be a good sell signal no bearish divergence for chainlink dont sleep on it. the goal is to buy low sell high this bull run has officially started profit as much as you can.
Also if we look at the MACD Chainlink is about to have a Golden Cross for a short term uptrend from the buy signal i posted earlier
for long term holders in Chainlink keep stacking it will shoot to the moon as well in my opinion do your own research though, i get it LINK has been performing terribly the past week almost 2 weeks now
if you like my charts hit the thumbs up been trading for months now had to learn a lot now i will be posting ideas i will update on BTC and also ETH later tonight possibly

