Recovery for LINKUSDChart comparison Between Link and the earlier days of ETH
ETH went through a long period of being flat which is a possibility for LINKUSD
This pause period can be seen on the MACD as the bear cross
Recovery could be as earlier as it touches the 50MA or later shown by the comparison
Chainlinkusd

LINKUSD 15 dollar line. Watching 4 hour - there was no charting needed for the past week just sideways, sideways. Even when i cant grab a dip i also but weekly 200 of bitcoin and Eth. Steady through the storm,

LINKUSD 13.36 - still testing - Watching for Break - Seeking 7I like lINK as a project. I am learning this as i go, and it is useful, that it seems i need to continuously recount. It does enable me to find more connections along the way. Im not sure of the social response aspect. But Link is like little digital suit wearing personal assistants. I don't see a reason why this sector would be single chain dominant. Id say it's more like little service companies for value trace and transfer.

Inverse Head And Shoulders (33%)
Hi everyone.
I have found over the years that, investors tend to wait until most of the trend is over :)
Entry= $ 14.6
Target= $ 19.5 (Inverse head and shoulders pattern should be easily recognizable)
Invalidation level (stop loss) = $ 13

Good set-up on ChainLink Crypto Hello Traders,
I been viewing it in last couple of days and hoping for a good set-up, well it is happening. A wonderful set-up with RR (Risk-Return) of 2x or more.
Price Action in Daily candle sticks chart tells-us that ChainLink has secured a support at 18.20ish and it is ready to rise above 30 level in 60 days.
Strategy = Long Position
Duration = 60 days
Entry = Spot (current rate) or anywhere between 18.50 and 22. Use averaging method.
StopLoss = 16.5ish, it should not touch this level because you will notice strong upwards push when prices get close to 18ish levels.
Target = 30 and above.
In coming days you will see price struggle between buyers and sellers at 23 levels but once it is broken there is not stopping back till it hits 30 and above.
Remember to use risk management. Use 1%, 2%, or 3% of total Capital to place trade.
Happy trading
Disclaimer: Above idea is based on my thoughts and not a recommendation or advise to buy/sell. I strongly recommend you to abide by risk management policy laid down by your country's' regulatory board.

Use discernment
Hi everyone.
I cannot remember a single time when I sold the bottom and was not sorry letter on that I made that decision.
Double Three:
Double three is a sideways combination of two corrective patterns*, This pattern combines a zigzag (denoted wave W), followed by wave X, and ends with a zigzag (denoted wave Y)
The wave analyst should pay attention to wave W and the end of wave Y.
*Wave W and wave Y subdivision can be zigzag, flat, double three.

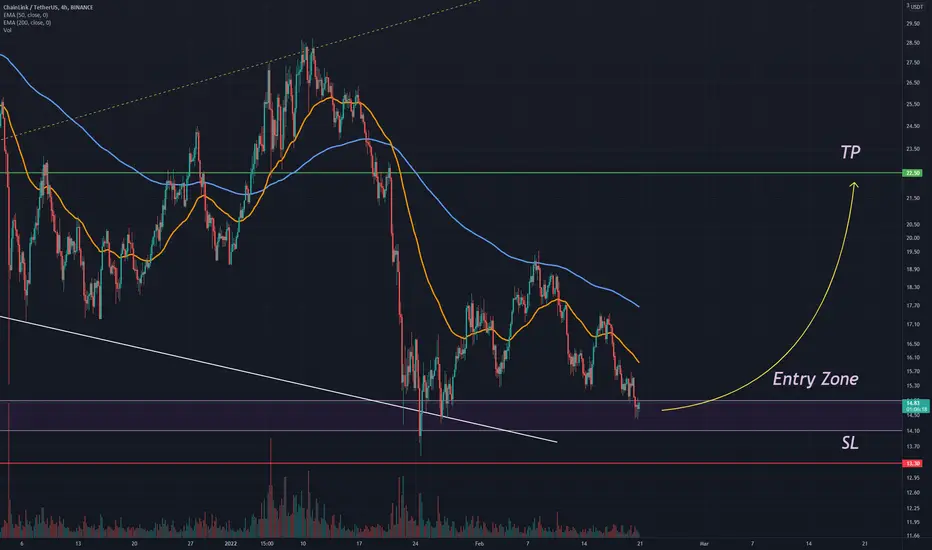
LINKUSD 13.36 - the crossing watch - buys entered for dipHere we are at the 13.36 line. I am very hopeful we all get some buying opportunities here. id love to see the 7s again. I think id start loading up at 8. Maybe a little taste at 10. So much of what is occurring is manufactured. Participate. Russia just announced a plan basically the same as what the Federal reserve wants. That at the end of the transaction is USD. The vehicle is irrelevant Like a coupon. A stock. Ukraine just legalized it in a similarly regulated way. So even in threat of war the crypto revolution is uniting. How do we appease the Federal Reserve. What if we make a house loan on staked crypto. What if we crowd fund a government. They really wont have that and we don't have the power to stop them. We have the power to make change though. I can not wait to see what is about to emerge.

LINKAccording to the bullish divergence on daily time frame looks like LINK can go 50% upside atleast

ChainLink (LINK) Buy ZoneChainLink (LINK) Buy Zone
--------------------
BIAS
Mid-Term : Bullish
Long-Term : Bullish
Risk : Medium
Overall Market Structure for ChainLink remains mid-term bullish and long-term bullish, and currently rejecting from the long-term support.
--------------------
$LINK/USDT LONG SETUP
Leverage : x3 - x5
Entry Price : 14.1 - 14.9
TP 1 : 15.3
TP 2 : 15.8
TP 3 : 16.55
TP 4 : 17.5
TP 5 : 18.6
TP 6 : 19.4
TP 7 : 20.7
TP 8 : 22.5
Stop Loss : 13.3
*Maximum 3% of Portfolio.
*Unload 12.5% at each TP. Whenever TP 2 hits, Move stop loss to entry.
--------------------
LINKUSD 15 minute 2/16/22 - Waiting for the Old GuardIt is probably the most fascinating moment in my experience of economical history. very telling of our worlds Governments. Are they for us or against us. Canada once a place deemed "more free" than USA, is now trying to figure out how to control its people by limiting their money. The forced a project of fundraising to return money as opposed to supporting people who do not want vaccine. our government pulled XRP and at least for me, stole my money and potential to make money. I Have no idea what they did with my XRP. Im sure others who refused to sell also just had their account wiped. Weird. Especially when you look at Governments and their players making deals with banks. if they accept change and pivot they must see how developments like chainlink can add to oversight and offer trust for the people. The fact that we elect someone does not mean that someone has the ability of self control. A smart contract offers Mutual trust. Preset terms. and a better democracy. In my opinion this is the carrot. Democracy has not been achieved and the people in control see it rising and are afraid of the unknown. This is why they add to the unknown with confusion and distrust. We are all so fortunate to witness this point in history. Where our ancestors were used by power we may finally get the chance to wield the power and dilute its extremes to a balance.

Chainlink LINKUSD - 24 hour chart patternsChainlink is being reported as at the bottom of its safe zone. I have a little bit lower but its already below it's strength line. I do like Link. i have made a great amount off of it's huge wave lengths. It like the rest of the market seems to be sitting on the edge and the fed meeting tomorrow seems to be the resistance right now. Interesting.

Elliott Wave Theory (Wave 5- $ 100)
Hi everyone,
A Possible scenario is shown in the chart (Target $ 100).
The pattern emerges normally between one flat and one falling lines.
Corrective wave patterns:
The best way to trade an Elliott Wave triangle is to anticipate the end of wave '5'. Sometimes this is easier said than done!

LINK short??- quick analysis on chainlink
- overbought on the stochastic RSI
- TP3 is what the elliott wave predicts but im not too sure about it as its quite low
- other TPs seem more than reasonable

LINK/USDT - Potential 157% SetupHello Traders!
LINK is completing a big business cycle. The main purchase support base is in the range of $9.75 - $10.95. It should not be forgotten that LINK is leading among oracles on the market and most likely the new cycle will be started only in case of fundamental updates of the project.
Medium-term purchases may be considered near the support level of $10.95.
The position should be closed at a stop-loss after the price moves under the support level of $6.50
The targets will be in the price range of $25.45 - $28.25
Good luck and watch out for the market
P.S. This is an educational analysis that shall not be considered financial advice

LINK Chainlink Price TargetLINK Chainlink just bounced from a strong support and is heading to the $20.50, resistance, which is also my price target area.
Looking forward to read your opinion about it.

(CHAINLINK) The market dunce with enormous potential.. Hello everyone !
Today H₿ Capital is analyzing LINK based on a « 2 Weeks » chart 📈
What we can see :
LINK has been one of the worst player during the last 12 months regarding its performance….. Worse than some Stock assets too… Very very disappointing for Hodlers (like me). By the way, LINK is one of the strongest fundamentals token in the market right now.
You cannot ignore the following : CCIP + Staking to be released this year + Eric Shmidt who joined the Chainlink foundation as an Advisor (ex CEO of Google 2001-2011).
Technically:
- LINK is progressing into a descending triangle (trend continuation pattern)
- It seems that we are actually in a « flat » ABC correction (to be confirmed soon with the 2 weeks candle ended this week , which could print on the chart a nice double bottom figure)
- Our white trend line act as a support for prices and this one must hold…
What we can expect :
- If prices failed to hold the white trend line + break the triangle support line (where prices are right now) we can expect Link to reach the 8$ area……..
- If prices manage to hold our white trend line + break the triangle with conviction, we can expect the following :
Triangle Breakout :
Target 1 = Distance between the mouth of the triangle added to te breakout
Target 2 = 100% extension of the first impulse move
Triangle Pullback :
Target 1 = Distance between the mouth of the triangle added to the pullback
Target 2 = 100% extension of the first impulse move
Trend-based Fib extension :
1.618 = 86$
2.618 = 131$
3.618 = 176$
IF YOU LIKE THIS POST, FEEL FREE TO LEAVE A LIKE AND FOLLOW ⭐ H₿ CAPITAL ⭐
MAY THE CRYPTO BE WITH YOU GUYS (D.Y.O.R)

ChainLink Update: H&S ConfirmedChainLink just broke the most important support level at $16 and now the price is heading to the next support levels. The target projection of the main head and shoulders pattern is around $4 but before that we have some initial supports to hold the price at $10 and $5

Chainlink at a Beautiful ConfluenceIf this can hold which I think it will we have a ton of upside, whole market is scared crapless, a whales paradise. Both the vs BTC & ETH broke 2 year long downtrends and look great also.

ANOTHER DROP FOR CHAINLINK POSSIBLY INCOMING Chainlink massive drop testing June/July support levels. Possible bottom 15-13 dollars inevitable.then a quick 2nd retest/confirmation. Then sky's the limit after the holiday's.

LinkLinkBTC is correcting back to the previous resistance after few days , now we have a support zone about 47 satoshi and the Fib 0.61 retrace is at 47 satoshi aswell , then it gives us a geat support. Im checking this as a bestie Bahram did ask for it

Chainlink Chainlink Are u gonna Chain the Bull?Bull Divergence on 4H Chainlink chart
Will it Chain the Bull
or Will it Link the Bear
Let's see...
NFA DYOR

Link ascending triangle on the weeklyIf we ignore the one fakeout, we can see this ascending triangle forming and waiting for a breakout. Link could easily rise to $200 in 2022 based on fundamentals. It is nice to see that technicals can support this theory.

A Bullish look on Chainlink? Elliot correction wave AnalysisA break in the Leading Diagnal could also then be wave X which would still be Bullish short term, as X generaly move in the opposite direction of the correction
Any Inputs Appreciated

Chainlink current trade idea.I am interested in this trade because of the following reasons:
1. Support above the 200D SMA
2. Support on the MA 20 (middle bb)
3. Bullish throwback to the EQ of the parallel channel.
4. Volume increasing for the breakout and decreasing during the bullish throwback.
