27% PROFIT OPPORTUNITY ON CHAINLINK (LONG ENTRY)BINANCE:LINKUSDT has retraced down to a strong support level and expecting to make an increase to the 0.618 fib level which would amount a 27% profit, as shown on the chart.
Good luck,
Your Ganbu
⚠️ Let me know your feedback and comments below!
⚠️ Follow me if you would like to see more analysis like this
Chainlinkusd

Link, is about timeIs the moment to prepare helmets?
Link was sleeping more than 1 year in accumulation.

GRAYSCALE FUND 52 billion asset buying CHAINLINK N SUSHISOO, the whales are booking NET BUY for the last few weeks during the market drops,, that means we should buy too !
BUY WHEN PEOPLE ARE SCARED
SELL WHEN PEOPLE ARE GREEDY '
thats the only thing u should know about market

Link - keep your eyes on these levels 👀❗❗The last couple of days the cryptocurrency market has been experiencing very strong swings in one direction and the other.
It's worth keeping in mind that a lot depends on bitcoin's behaviour right now.
LINK is sandwiched between the $30.6 and $28 levels. A squeeze near the mirror level could result in a breakout and a fall to the lower marked area.
In case the resistance level of $30.6 is broken, there could be a continuation of the rise to the area marked above.
Write in the comments all your questions and instruments analysis of which you want to see.
Friends, push the like button, write a comment, and share with your mates - that would be the best THANK YOU.
P.S. I personally will open entry if the price will show it according to my strategy.
Always make your analysis before a trade.

LINKUSD Buy On Support LineAn Idea for LINKUSD showing the main trend line that can be drawn
Along with the areas of interest along this trend line
Each point just makes the support stronger
Good buy

CHAINLINK BEST PICK FOR Q1 2022 TARGET 100% UPSIDE in 4 MONTHSMY TOP PICK FOR Q1 2022 IS LINK with 100% potential upside
Chainlink looks to be an important technology as cryptocurrencies continue to evolve. Having an oracle such as Chainlink in place will be key to the long-term stability and viability of cryptocurrency in general. Thus, LINK may be a sound investment if you believe Chainlink will become the industry standard as the most widely-used, decentralized oracle network.
BUY LINK AT 28-30
RISK 10 : REWARD 90 RATIO
TECH; HEAVILY OVERSOLD.
Based on W.I. forecasts, a long-term increase is expected, the price prognosis for 2026-11-14 is 125.802 US Dollars. With a 5-year investment, the revenue is expected to be around +320.01%.
-- do your homework, follow your gut,

Linkiesavoid the stink trap this time, kapiche?
⠀⠀⠀⠀⠀⠀⠀⠀⠀⠀⠀⠀⠀⠀⠀⢠⡟⢄⠂⠀⠀⠀⠀⠀⠀⠀⠀⠀⠀⠀⠀⠀⠀⠀⠀⠀⠀⠀⠀⠀
⠀⠀⠀⠀⠀⠀⠀⠀⠀⠀⠀⠀⠀⠀⠀⣾⣄⡎⠀⠀⠀⠀⠀⠀⠀⠀⠀⠀⠀⠀⠀⠀⠀⠀⠀⠀⠀⠀⠀⠀
⠀⠀⠀⠀⠀⠀⠀⠀⠀⠀⠀⢠⡀⣆⢸⣿⣿⠀⠀⠀⠀⠀⠀⠀⠀⠀⠀⠀⠀⠀⠀⠀⠀⠀⠀⠀⠀⠀⠀⠀
⠀⠀⠀⠀⠀⠀⠀⠀⠀⠀⠀⢸⣷⣿⣼⣿⣷⡀⠀⠀⠀⠀⠀⠀⠀⠀⠀⠀⠀⠀⠀⠀⠀⠀⠀⠀⠀⠀⠀⠀
⠀⠀⠀⠀⠀⠀⠀⠀⠀⠀⠀⠸⢿⣿⡿⠛⠛⠉⠉⠁⠀⠀⠀⠀⠀⠀⠀⠀⠀⠀⠀⠀⠀⠀⠀⠀⠀⠀⠀⠀
⠀⠀⠀⠀⠀⠀⠀⠀⠀⠀⠀⢀⣼⡿⠀⠀⠀⠀⠀⠀⠀⠀⠀⠀⠀⠀⠀⠀⠀⠀⠀⠀⠀⠀⠀⠀⠀⠀⠀⠀
⠀⠀⠀⠀⠀⠀⠀⠀⠀⠀⠀⣾⣿⠁⠀⠀⠀⠀⠀⠀⠀⠀⠀⠀⠀⠀⠀⠀⠀⠀⠀⠀⠀⠀⠀⠀⠀⠀⠀⠀
⠀⠀⠀⠀⠀⠀⠀⠀⠀⠀⣼⣿⡇⠀⠀⠀⠀⠀⠀⠀⠀⠀⠀⠀⠀⠀⠀⠀⠀⠀⠀⠀⠀⠀⠀⠀⠀⠀⠀⠀
⠀⠀⠀⠀⠀⠀⠀⠀⠀⢘⣹⣿⠀⠀⠀⠀⠀⠀⠀⠀⠀⠀⠀⠀⠐⢠⢀⠠⠀⠀⠀⠀⠀⠀⠀⠀⠀⠀⠀⠀
⠀⠀⠀⠀⠀⠀⡀⣀⣼⣿⣿⡇⠀⠀⠀⠀⠀⠀⠀⠀⠀⠀⠀⠀⠀⠀⠁⠈⣆⣀⠀⠀⠀⠀⠀⠀⠀⠀⠀⠀
⠀⠀⠀⠀⠀⠀⠋⠻⠶⢻⣿⠁⠀⠀⠀⠀⠀⠀⠀⠀⠀⠀⠀⠀⠀⠀⠀⠠⡞⢻⠡⠀⠀⠀⠀⠀⠀⠀⠀⠀
⠀⠀⠀⠀⠀⠀⡀⠀⠀⠀⠀⠀⠀⠀⠀⠀⠀⠀⢀⡤⠞⡛⠛⢿⣶⣶⠀⠀⠀⠀⠁⠀⠀⠀⠀⠀⠀⠀⠀⠀
⠀⠀⠀⠀⠀⠀⣧⠀⠀⠀⠀⢠⠀⠀⠀⠀⠀⠀⣼⠤⡘⠣⠤⢊⣿⣿⡄⠀⠀⠀⠀⠘⡄⠀⠀⠀⠀⠀⠀⠀
⠀⠀⠀⠀⠀⢸⡃⠀⠐⠀⠀⢸⡇⠀⠀⠀⠀⠀⠄⠀⠀⠀⠀⣼⣿⣿⣟⠀⠀⠀⠀⠀⠘⣦⡀⢀⠀⠀⠀⠀
⠀⠀⠀⠀⠀⠀⣧⡀⠀⠰⣤⣼⡇⢀⠀⠀⠀⣶⣾⣶⣷⣶⣤⣿⣿⣿⣿⠀⠀⠀⠀⠀⠀⢹⣷⣌⢷⣤⡀⠀
⠀⠀⠀⠀⠀⠀⢹⣿⣷⡄⠙⠟⠀⠀⠀⠀⠀⣿⣿⡿⣿⣿⣿⣿⣿⣿⡟⠀⠀⠀⠀⠀⠀⢨⣿⣿⡷⣄⣽⡖
⠀⠀⠀⠀⠀⠀⠀⠹⣿⢣⡀⠀⠀⠀⠀⠀⣰⠀⠉⠐⢿⡏⣽⣿⣿⡿⠀⠀⠀⠀⠀⠀⠀⠠⢩⣁⣴⣿⡿⠁
⠀⠀⠀⠀⠀⠀⠀⠀⢻⠃⠁⠀⠀⠀⠀⠀⠙⠀⠀⡀⢀⣼⣿⣿⢯⠄⠀⣠⣀⣴⣿⣦⣖⣶⣿⣿⣿⡟⠁⠀
⠀⠀⠀⠀⠀⠀⠀⠀⠀⠀⠘⡇⠀⠀⠀⠀⠀⢀⠀⠀⠈⠉⠉⠡⠀⢀⢰⣽⠟⣻⣿⣵⣿⣿⣿⣿⠟⠀⠀⠀
⠀⠀⠀⠀⠀⠀⠀⠀⡂⠀⠀⠃⠀⠀⠀⠀⠀⠘⠀⠀⠀⠀⠀⠀⢀⣾⣾⣿⣾⣿⣿⣿⣿⡿⠟⠁⠀⠀⠀⠀
⠀⠀⠀⠀⠀⠀⠀⠀⡇⠀⠀⢸⣄⠀⠀⠀⠀⠀⠀⠀⠀⠀⠀⣴⣿⣿⣿⡟⣿⣿⣿⠟⠉⠀⠀⠀⠀⠀⠀⠀
⠀⠀⠀⠀⠀⠀⠀⠀⡇⠀⠀⠘⠏⠀⠀⠀⠀⠀⠀⠀⣠⣾⣿⣿⣿⣿⣟⣶⣿⠋⠀⠀⠀⠀⠀⠀⠀⠀⠀⠀
⠀⠀⠀⠀⠀⠀⠀⠀⢸⣆⠁⡀⠀⢶⣄⣼⠷⡀⠀⠀⠿⣿⡿⣿⣿⣟⣾⣿⠏⠀⠀⠀⠀⠀⠀⠀⠀⠀⠀⠀
⠀⠀⠀⠀⠀⠀⠀⠀⠸⣏⡏⠉⠂⠀⠉⠀⠀⠐⠂⢀⣠⣾⣿⣿⣿⣿⣿⠋⠀⠀⠀⠀⠀⠀⠀⠀⠀⠀⠀⠀
⠀⠀⠀⠀⠀⠀⠀⠀⠀⣧⣹⣶⠞⠂⠀⡞⡆⠰⠶⣬⣿⣯⣿⣿⣿⣿⠃⠀⠀⠀⠀⠀⠀⠀⠀⠀⠀⠀⠀⠀
⠀⠀⠀⠀⠀⠀⠀⠀⠀⣿⣿⣿⣶⣦⣼⣧⣦⣤⣠⣼⣿⣿⣿⣿⣿⠇⠀⠀⠀⠀⠀⠀⠀⠀⠀⠀⠀⠀⠀⠀
⠀⠀⠀⠀⠀⠀⠀⠀⠀⢿⣿⣿⣿⣯⣿⣿⣿⣉⣿⣿⣿⣿⣿⣿⡿⠀⠀⠀⠀⠀⠀⠀⠀⠀⠀⠀⠀⠀⠀⠀
⠀⠀⠀⠀⠀⠀⠀⠀⠀⢸⣿⣿⣿⣿⣿⣿⣿⣿⣿⣿⣿⣿⣿⣿⡟⡀⠀⠀⠀⠀⠀⠀⠀⠀⠀⠀⠀⠀⠀⠀
⠀⠀⠀⠀⠀⠀⠀⠀⠀⠈⣿⣿⣿⣿⣿⣽⣽⣿⣿⣿⣿⣿⣿⣿⣇⡇⠀⠀⠀⠀⠀⠀⠀⠀⠀⠀⠀⠀⠀⠀
⠀⠀⠀⠀⠀⠀⠀⠀⠀⠀⣿⣿⣿⣿⣿⣿⣿⣿⣿⣿⣿⣿⣿⣿⣿⣇⠀⠀⠀⠀⠀⠀⠀⠀⠀⠀⠀⠀⠀⠀
⠀⠀⠀⠀⠀⠀⠀⠀⢀⡴⣿⣿⣿⣿⣿⣿⣿⣿⣿⣿⣿⣿⡿⢿⣿⣿⠀⠀⠀⠀⠀⠀⠀⠀⠀⠀⠀⠀⠀⠀
⠀⠀⠀⠀⠀⠀⠀⠀⣼⣿⣦⣉⡘⠿⣿⣿⣿⣿⣿⣿⣿⡟⠁⣾⠿⣡⣿⡀⠀⠀⠀⠀⠀⠀⠀⠀⠀⠀⠀⠀
⠀⠀⠀⠀⠀⠀⠀⢠⣿⣿⣿⣿⣿⣿⣾⣿⣿⣿⣿⣿⣿⣶⣶⣿⣿⣿⡿⣷⠀⠀⠀⠀⠀⠀⠀⠀⠀⠀⠀⠀
⠀⠀⠀⠀⠀⠀⣀⣼⣿⣿⣿⣿⣿⣿⣿⣿⣿⣿⣿⣿⣿⣿⣿⣿⣿⣿⣿⡿⠀⠀⠀⠀⠀⠀⠀⠀⠀⠀⠀⠀
⠀⠀⠀⠀⠀⠀⢿⣿⣿⣿⣿⣿⣿⣿⣿⣿⣿⣿⣿⣿⣿⣿⣿⣿⣿⣿⣿⡇⠀⠀⠀⠀⠀⠀⠀⠀⠀⠀⠀⠀
⠀⠀⠀⠀⠀⣴⣿⣿⣿⣿⣿⣿⣿⣿⣿⣿⣿⣿⣿⣿⣿⣿⣿⣿⣿⣿⣿⡇⠀⠀⠀⠀⠀⠀⠀⠀⠀⠀⠀⠀
⠀⠀⠀⠀⢰⣿⣿⣿⣿⣿⣿⣿⣿⣿⣿⣿⣿⣿⣿⣿⣿⣿⣿⣿⣿⣿⣿⡇⠀⠀

💰 27% PROFIT TRADE (TUTORIAL STEP BY STEP) ON CHAINLINK 🚀🚀🚀BINANCE:LINKUSDT is showing a great long entry right now for a targeted profit of around 27%.
Entry & exit shown on the chart.
Good luck,
Your Ganbu
⚠️ Let me know your feedback and comments below!
⚠️ Follow me if you would like to see more analysis like this

LINK USDT LINK USDT TECHNICAL ANALYSIS DAILY CHART.
Possible reversal or buy zone is $25 (WICK TIP) TO $26.
Breakout and retest at the previous trendline resistance that could possible turn into a support.
Support trendline at the bottom (blue line).
$77 target is based on fib 1.618

LINKUSD Head and Shoulders ScenarioA bearish scenario for LINKUSD, identifying the head and shoulders pattern that can be drawn on this chart.
The bars pattern placed is very speculative
Long term I really think LINKUSD will increase. This is more of a short term scenario.
This is the opposing scenario, in which LINKUSD recovers easily
Both share a common uptrend. The trendline up is the point of interest in both posts.

link on the risky placewe have channel break out and after that we have a nice fibonacci support and also a trend line

LINKUSD May Recover EasilyPrice is sitting above the Triangle
This may lead to a bull move as suggested by the double curve
Easy continuation up from where it is now

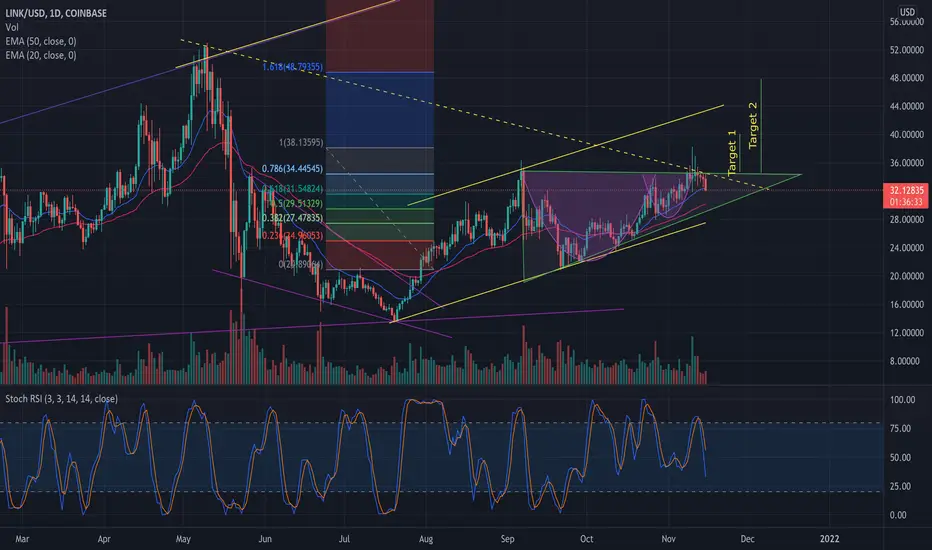
Chainlink ready for $48 according to these specific patterns.Hello all. looking at chainlink on a daily timeframe we have two patterns that are primed to play out in a very short time. first pattern is the ascending triangle which is a bullish pattern. The breakout for this pattern will put link at $48. Second, the cup and handle pattern gives us two possible breakout targets target 1 $40 and target two $48. both ascending triangle and cup and handle patters gives us a price target which also correlates with fib 1.6 level, again at $48. Overall Chainlink remains bullish as it trades in this yellow rising channel, above the 50 EMA, and gets very close to braking out one of these patterns as there is little room left for consolidation. Thanks for reading. Enjoy.
LINK incremental increaseLINK looks very good on the chart, the growth with slight fluctuations for a long time and no major corrections, this shows a strong position LINK

CHAINLINK WILL MAKE A 30% INCREASE OR MORE IN THE NEXT FEW WEEKSBINANCE:LINKUSDT finally broke resistance and it looks like it is now treating it as a level of support which is a great bullish confirmation. From here on we have a LONG opportunity of at least 30% until the next resistance level is reached, as shown on the chart.
Good luck,
Your Ganbu
⚠️ Let me know your feedback and comments below!
⚠️ Follow me if you would like to see more analysis like this

LINK 30% move if resistance breakLINK has been holding the 31$ since last idea, which was a point of entry for going long.
Now prices are trying to break the resistance area, if not already on the market i would wait and see and look for:
1) A retest of 31$ area to go long on pullback
2) Wait for a break of 37$ and go long on intraday pullback at around 34$ to 35$.
For now, if you are already in the market you can look on the break of 37$ in order to target above 47$ as 1st TP.
Let's see how it will play out

$LINK Poised to Retest $34-$36 | TP1: $42$LINK has underperformed this year compared to the rest of the crypto-market, but I'm still bullish. Just broke out of the descending trendline and looking to retest $34 and then $36. Once $LINK clears the resistance area, we'll be on our way to $42. Patience is key.

LINK - Before Breakout Hello Folks,
A LINK analysis for you.
1. In an Ascending Triangle, approaching breakout.
2. Fractal from former recovery & price discovery combination displaying potential price action.
3. Fibonacci levels to give you an idea about potential targets.
Enjoy & trade,
Goraxes

LINK calm and stabilityLINK from Sep 27 to Nov 5 shows gradual and steady growth, of course there are some fluctuations along the way, but the main direction is the same, a very good sign for LONG

But what about Chainlink?Sometime in the next 20 days Chainlink will have its big move and start its final leg up to 200 dollars, right now price is coming in a squeeze ,its hard to see if your not looking at it using Gann Fan but its there price needs to pop in a direction and my call is we going up sometime mid November.
This trendlline has been holding chainlink up for 105 days but not only that this trend line connects with a massive multi year macro trend line for chainlink take a look :
ibb.co
Rewards far out way the risks with Chainlink.

LINKUSDT downward trend is over, Nov 2Chainlink downward trend is over
It's better to buy after it breaks $32 static resistance level if you want to.
A pullback might happen or might not anyway I expect it another Higher High to happen.
There are three resistances on the way, $52 level is the most important one.

#LINK Chainlink 1M LOG - Follow the trendChainlink on a 1M LOG Chart showing the high and low on Jan 1 2022 assumption.
Circled areas are the touches of the Equilibrium on the Parallel Channel.
What are your thoughts? Comment below and hit the like please. Thank you!
Disclosure: This is just my opinion and not any type of financial advice. I enjoy charting and discussing technical analysis . Don't trade based on my advice. Do your own research! #cryptopickk #bitcoin #altcoins

LINK attempts to breakLINK has a difficult period, attempts to defend price levels and rebound to the right rate, then days it will be a fight for a rebound and return to earlier price levels (BTC also plays its role here)
